

Introduction
Materials and Methods
Plant materials and growth environments
Phenotypic data collection
Principal component analysis (PCA)
Cluster analysis
Genomic DNA extraction
RAPD analysis
Molecular marker analysis
Genetic similarity assessment (Phylogenetic tree)
Statistical analysis
Results
Identification of key morphological traits using PCA
Clustering based on floral morphological traits
Floral trait profiles of the three clusters
Molecular marker analysis
Genetic similarity and cluster analysis based on RAPD
Discussion
Conclusion
Introduction
Hibiscus syriacus, commonly known as Rose of Sharon, is a widely cultivated ornamental woody plant valued for its aesthetic appeal and economic importance. Globally, H. syriacus is used as an ornamental tree for streetscapes, gardens, and container planting, and breeding efforts have primarily focused on the development of cultivars exhibiting distinctive and vivid floral characteristics, which contribute to enhanced overall ornamental value. Among these traits, the flower color, shape, and size are considered the primary determinants of cultivar identity and preference in the floricultural market. In addition to its use in floriculture, it has been traditionally used as an antipyretic and expectorant in Korea, China, and India (Singh et al. 2021). It has also been used to treat mental disorders, skin diseases, jaundice, gastroenteritis, and bronchitis (Balkrishna et al. 2022). Furthermore, H. syriacus exhibits various biological activities, finding use as an antioxidant (Kwon et al. 2003; Molagoda et al. 2020), antimicrobial agent (Sánchez-Hernández et al. 2021), anti-inflammatory substance (Lee et al. 2023), anticancer agent (Hsu et al. 2015), and skin-protective substance (Karunarathne et al. 2021). This plant also has potential benefits for sleep regulation (Kim et al. 2022). These properties highlight its potential applications in various industries.
In vitro propagation techniques, such as somatic embryogenesis, callus induction, and organogenesis using stems, leaves, and roots, are commonly used to produce clonal plants (Bidabadi and Jain 2020). In addition to traditional breeding, micropropagation has excellent potential for large-scale production in diverse industries (Cardoso et al. 2018), including biofuels (Norouzi et al. 2022), food (Hasnain et al. 2022), cosmetics (Leib et al. 2018), pharmaceuticals (Nielsen et al. 2019; Chandran et al. 2020), and companion plant markets (Akramian et al. 2024). However, somaclonal variations, alterations that arise in vitro, have been reported across multiple dimensions, ranging from externally observable phenotypic variations to those on internal cellular and molecular levels (Čellárová et al. 1997; Heisam et al. 2021; Zhang et al. 2021; Adamek et al. 2022). These variations may hinder the stable and industrial-scale application of clonally propagated plants. Thus, their suitability for large-scale commercial production warrants extensive evaluations.
In particular, calli derived from leaf tissue exhibit a higher frequency of somaclonal variation, both phenotypically and genetically, compared to those derived from other explant sources (Potter and Jones 1991). Therefore, the uniformity of callus-derived clonal plant populations must be assessed to ensure stable large-scale production. Although callus-based clonal propagation is widely used, the uniformity of regenerated populations remains poorly characterized. Clonal uniformity refers to the extent to which regenerated plants retain the genetic and phenotypic traits of the original genotype (Hanna et al. 1984). Considerable deviations in donor traits can lead to undesirable variabilities and reduced yield performance. Therefore, prior assessments of uniformity are essential for the development of stable and reliable micropropagation systems (Khan et al. 2017).
Somaclonal variation is a well-documented phenomenon observed in various plant species during the in vitro culture process. It is affected by various culture-related factors, including the type of explant (Roostika et al. 2015), the culture system (Sakhanokho et al. 2022), the plant growth regulators used (Giménez et al. 2001), the medium composition (Palombi et al. 2007), and the use of prolonged sub-culturing (Sun et al. 2013; Roostika et al. 2015). These factors can induce both genetic and epigenetic alterations (Krishna et al. 2016), potentially affecting the stability and uniformity of regenerated plants. From the perspective of commercial applications involving large-scale in vitro propagation, somaclonal variation represents a double-edged sword. On the one hand, in-vitro-derived regenerants exhibiting superior morphological characteristics, enhanced biosynthesis of bioactive compounds, and improved growth relative to the donor genotype may serve as valuable genetic resources (Duta-Cornescu et al. 2023). However, regenerants with substantial deviations in morphological, genetic, metabolic, and physiological traits present serious challenges for industrial implementation (Espinosa-Leal et al. 2018). Without a proper evaluation, the mass propagation and distribution of these variants may have undesirable outcomes, including dwarfism (Khalili et al. 2020), reduced pest resistance (Hadi and Bridgen 1996), lower flowering rates affecting productivity (Margherita et al. 1996), and ecological disruptions (Cornelissen et al. 2014; Herben et al. 2014). Therefore, a minimum level of verification tailored to specific applications is essential for the adequate uniformity and stability of in vitro-derived plants (Adamek et al. 2022; Duta-Cornescu et al. 2023).
Although the genetic fidelity between donor plants and in-vitro-derived clones may be adequate for breeding applications (Luo et al. 2023), large-scale micropropagation and commercialization require a more comprehensive evaluation of clonal uniformity that extends beyond genetic stability alone (Duta-Cornescu et al. 2023). Various methodologies have been employed to assess the uniformity of tissue-culture-derived clones at internal levels, including cytological, genetic, physiological, and metabolic analyses, as well as external phenotypic evaluations (Hanna et al. 1984; Maraschin et al. 2002; Khan et al. 2014; Dey et al. 2015; Bhattacharyya et al. 2017; Qahtan et al. 2021; Sandhya et al. 2021). In addition to assessing uniformity within clonal populations, it is important to identify and anticipate unexpected somaclonal variations that may arise during micropropagation. Undesirable alterations can adversely affect the efficiency of mass propagation and distribution. Therefore, even minor phenotypic variants should remain within an acceptable range for the original cultivar. This highlights the need for a carefully structured evaluation framework to ensure the reliability and quality of tissue-culture-derived plant materials.
H. syriacus exhibits strong adaptability to diverse environmental conditions. Thus, the genetic diversity of this species must be studied to identify and classify fundamental variations. Diversity among H. syriacus cultivars has been primarily evaluated based on morphological traits, whereas relatively few studies have used molecular markers (Lee et al. 2002). Moreover, assessments of genetic diversity based on morphological characteristics remain rare, with only a limited number of reported examples (Cho 2006). In this study, we assessed the morphological uniformity of H. syriacus ‘Nanpa’ plants regenerated from a leaf-derived callus by means of the principal component analysis (PCA)-based clustering of floral traits. We also evaluated their genetic fidelity to the donor plant through random amplified polymorphic DNA (RAPD) profiling. Although both morphological characteristics and molecular-level variations are critical for the efficient in vitro production of tissue-culture-derived clones with breeding potential in H syriacus, the integration of these aspects remains limited. Therefore, the present study elucidates the relationships among leaf-callus-derived clonal plants based on a combination of floral morphological and molecular clustering approaches, with the objective of determining whether the clonal population maintains a level of floral phenotypic uniformity suitable for industrial and commercial applications, or alternatively, whether floral phenotypic variations that could be utilized for breeding purposes exist. Our findings provide insights into both floral phenotypic uniformity and potential utility of H syriacus in breeding programs.
Materials and Methods
Plant materials and growth environments
The clonal plants of H. syriacus ‘Nanpa’ (internal accession number NIFoS-Dd-SgRr001) used in this study were derived from leaf tissue through callus-mediated regeneration, as described in a previous study by the authors (Son et al. 2019). The original donor plant was provided by the National Forest Seed and Variety Center, Korea Forest Service, Republic of Korea and has since been maintained in an experimental field at Jeju National University, Republic of Korea. All plants were cultured in a growth chamber maintained at 23–25°C under long-day photoperiod conditions (16 h light/8 h dark) with LED lighting at a photosynthetic photon flux density (PPFD) of 300 µmol m-2 s-1 and relative humidity of 48–60% during the hardening process. Callus induction was carried out for approximately six weeks with one subculture, followed by shoot regeneration for four weeks with one subculture, and subsequent root formation for approximately eight weeks with one to two subcultures. The donor plant and its clonal derivatives were both cultivated under identical environmental conditions.
Phenotypic data collection
Floral phenotypic traits of H. syriacus ‘Nanpa’ callus-derived clones were evaluated using nine floral and vegetative characteristics: the number of calyces, number of epicalyces, number of stamen-petal intermediates, plant height, petal length, petal width, petal index (width/length), flower diameter, and floral asymmetry. Phenotypic variations were primarily analyzed at the clone level in earlier work by the authors (Son et al. 2025). Building on these findings, the present study extended the analysis to the population level. In particular, we assessed morphological characteristics across the clonal population to capture broader patterns of variation. For each plant, data were collected from more than five flowers and all measurements were systematically recorded in an Excel spreadsheet for further analysis.
Principal component analysis (PCA)
Before the cluster analysis, PCA was conducted to reduce the dimensionality of the dataset and facilitate visualization. The dataset was initially standardized to ensure comparability among the nine morphological traits. The PCA utilized the factoextra package in R software (version 4.3.2). Eigenvalues were examined to determine the number of principal components (PCs) to be retained, and only those with eigenvalues > 1 were selected. The fviz_pca_var() function was used to visualize the contribution of each variable to the PCs, thereby identifying the key traits affecting clustering. The eigenvalues and proportion of variance explained by each PC were extracted using the get_eigenvalue() function [factoextra package] in R.
Cluster analysis
Following PCA-based dimensionality reduction, a cluster analysis was performed using the scores of the first two PCs. The partitioning around medoids (PAM) algorithm was applied with the Euclidean distance as the dissimilarity metric to minimize the influence of outliers. Two complementary approaches were used to evaluate the clustering tendency of the dataset: (i) the Hopkins statistic (H value) for statistical assessment and (ii) the visual assessment of tendency (VAT) algorithm for visual confirmation. The optimal number of clusters was determined using the fviz_nbclust() function in the factoextra package in R. Once the clusters were established, a silhouette analysis was conducted by assessing how well the clones were grouped to validate the clustering results. Clones with silhouette width values > 0.5 were considered well clustered.
Genomic DNA extraction
Total genomic DNA was extracted from 5 mg of leaf tissue using the cetyltrimethylammonium bromide method. To prevent polysaccharide contamination of the DNA extract, a high-salt solution (3M potassium acetate and 6M NaCl) was used during precipitation. The DNA concentration and purity were assessed by measuring the A260/A280 ratio using a NanoDrop 2000 spectrophotometer (Thermo Scientific™, Waltham, MA, USA). An aliquot of the DNA was diluted in double-distilled water to a final concentration of 50 ng/µL and stored at –20°C for the subsequent PCR amplification experiments.
RAPD analysis
The RAPD technique offers advantages for the rapid, simple, and efficient detection of genetic variations within large populations of tissue-culture-derived clonal plants. RAPD markers have been successfully applied for genetic identification in Hibiscus species (Barik et al. 2006) and for detecting somaclonal variations in woody plants (Heinze and Schmidt 1995). Accordingly, RAPD markers were selected for use in this study.
The RAPD analysis involved 25 callus-derived clonal samples of H. syriacus. PCR amplification was performed using the five RAPD primers listed in Table 2. These primers were selected based on our previous study (Son et al. 2025), which identified polymorphic band patterns between donor plants and regenerated clones. Each 20-µL reaction mixture consisted of 10 µL of 2× Master Mix (EmeraldAmp® PCR Master Mix, Takara), 10 pmol of primer, and 5 µL of genomic DNA (10 ng/µL), with the final volume adjusted using sterile distilled water. The PCR cycling conditions were as follows: initial denaturation at 95°C for 2 min; 35 cycles of denaturation at 95°C for 1 min, annealing at 37°C for 1 min, and extension at 72°C for 1 min 30 s, followed by a final extension at 72°C for 7 min. The amplified PCR products were separated through electrophoresis on a 1% (w/v) agarose gel at 100 V for 40 min.
Molecular marker analysis
Amplified DNA bands were scored as present (1) or absent (0). Only the bands that were reproducible in at least two independent experiments using the same RAPD primer set were included in the molecular analysis. Polymorphic bands were defined as those located at different gel positions in the sample population. The polymorphism percentage was calculated using the following formula:
Polymorphism (%) = (Number of polymorphic bands / Total number of bands) × 100
Polymorphic information content (PIC) values, which reflect the discriminatory power of each primer, were calculated using the following formula:
PIC = 2 fi (1–fi),
where fᵢ is the frequency of the band present.
Genetic similarity assessment (Phylogenetic tree)
A binary matrix representing the presence or absence of amplified DNA bands was used to compute the pairwise genetic similarity using the Jaccard similarity coefficient. This similarity matrix was then used to construct a phylogenetic tree (dendrogram) using the unweighted pair group method with the arithmetic mean algorithm in the NTSYS-pc (version 2.02) software package. Major branching points were examined using R, and four distinct genetic clusters were identified based on a visual assessment of divergence patterns among the leaf-callus-derived clonal plants.
Statistical analysis
To compare the mean values of phenotypic traits across the identified cluster groups, the average value of each trait was calculated for each group based on the PCA and clustering results. A one-way analysis of variance was performed to determine the significance of differences between groups. Duncan’s multiple range test (DMRT) was conducted for multiple comparisons using SPSS software (version 21.0).
Results
Identification of key morphological traits using PCA
In total, 35 clonal plants derived from leaf explants of the donor plant ‘Nanpa’ were obtained (Supplementary Fig. 1A) (Son et al. 2019) and cultivated under identical environmental conditions (Supplementary Fig. 1B). Nine floral traits were measured at the same developmental stage to investigate morphological variations, and PCA was utilized to identify traits that contributed most to the observed variations. The first four PCs, each with eigenvalues > 1, collectively explained 79.9% of the total variance (PC1: 31.2%, PC2: 22.7%, PC3: 12.9%, and PC4: 11.7%) (Fig. 1A). An eigenvalue greater than 1 indicates that the corresponding component explains more of the variance than any single original variable, thereby enhancing the interpretability of the dataset.
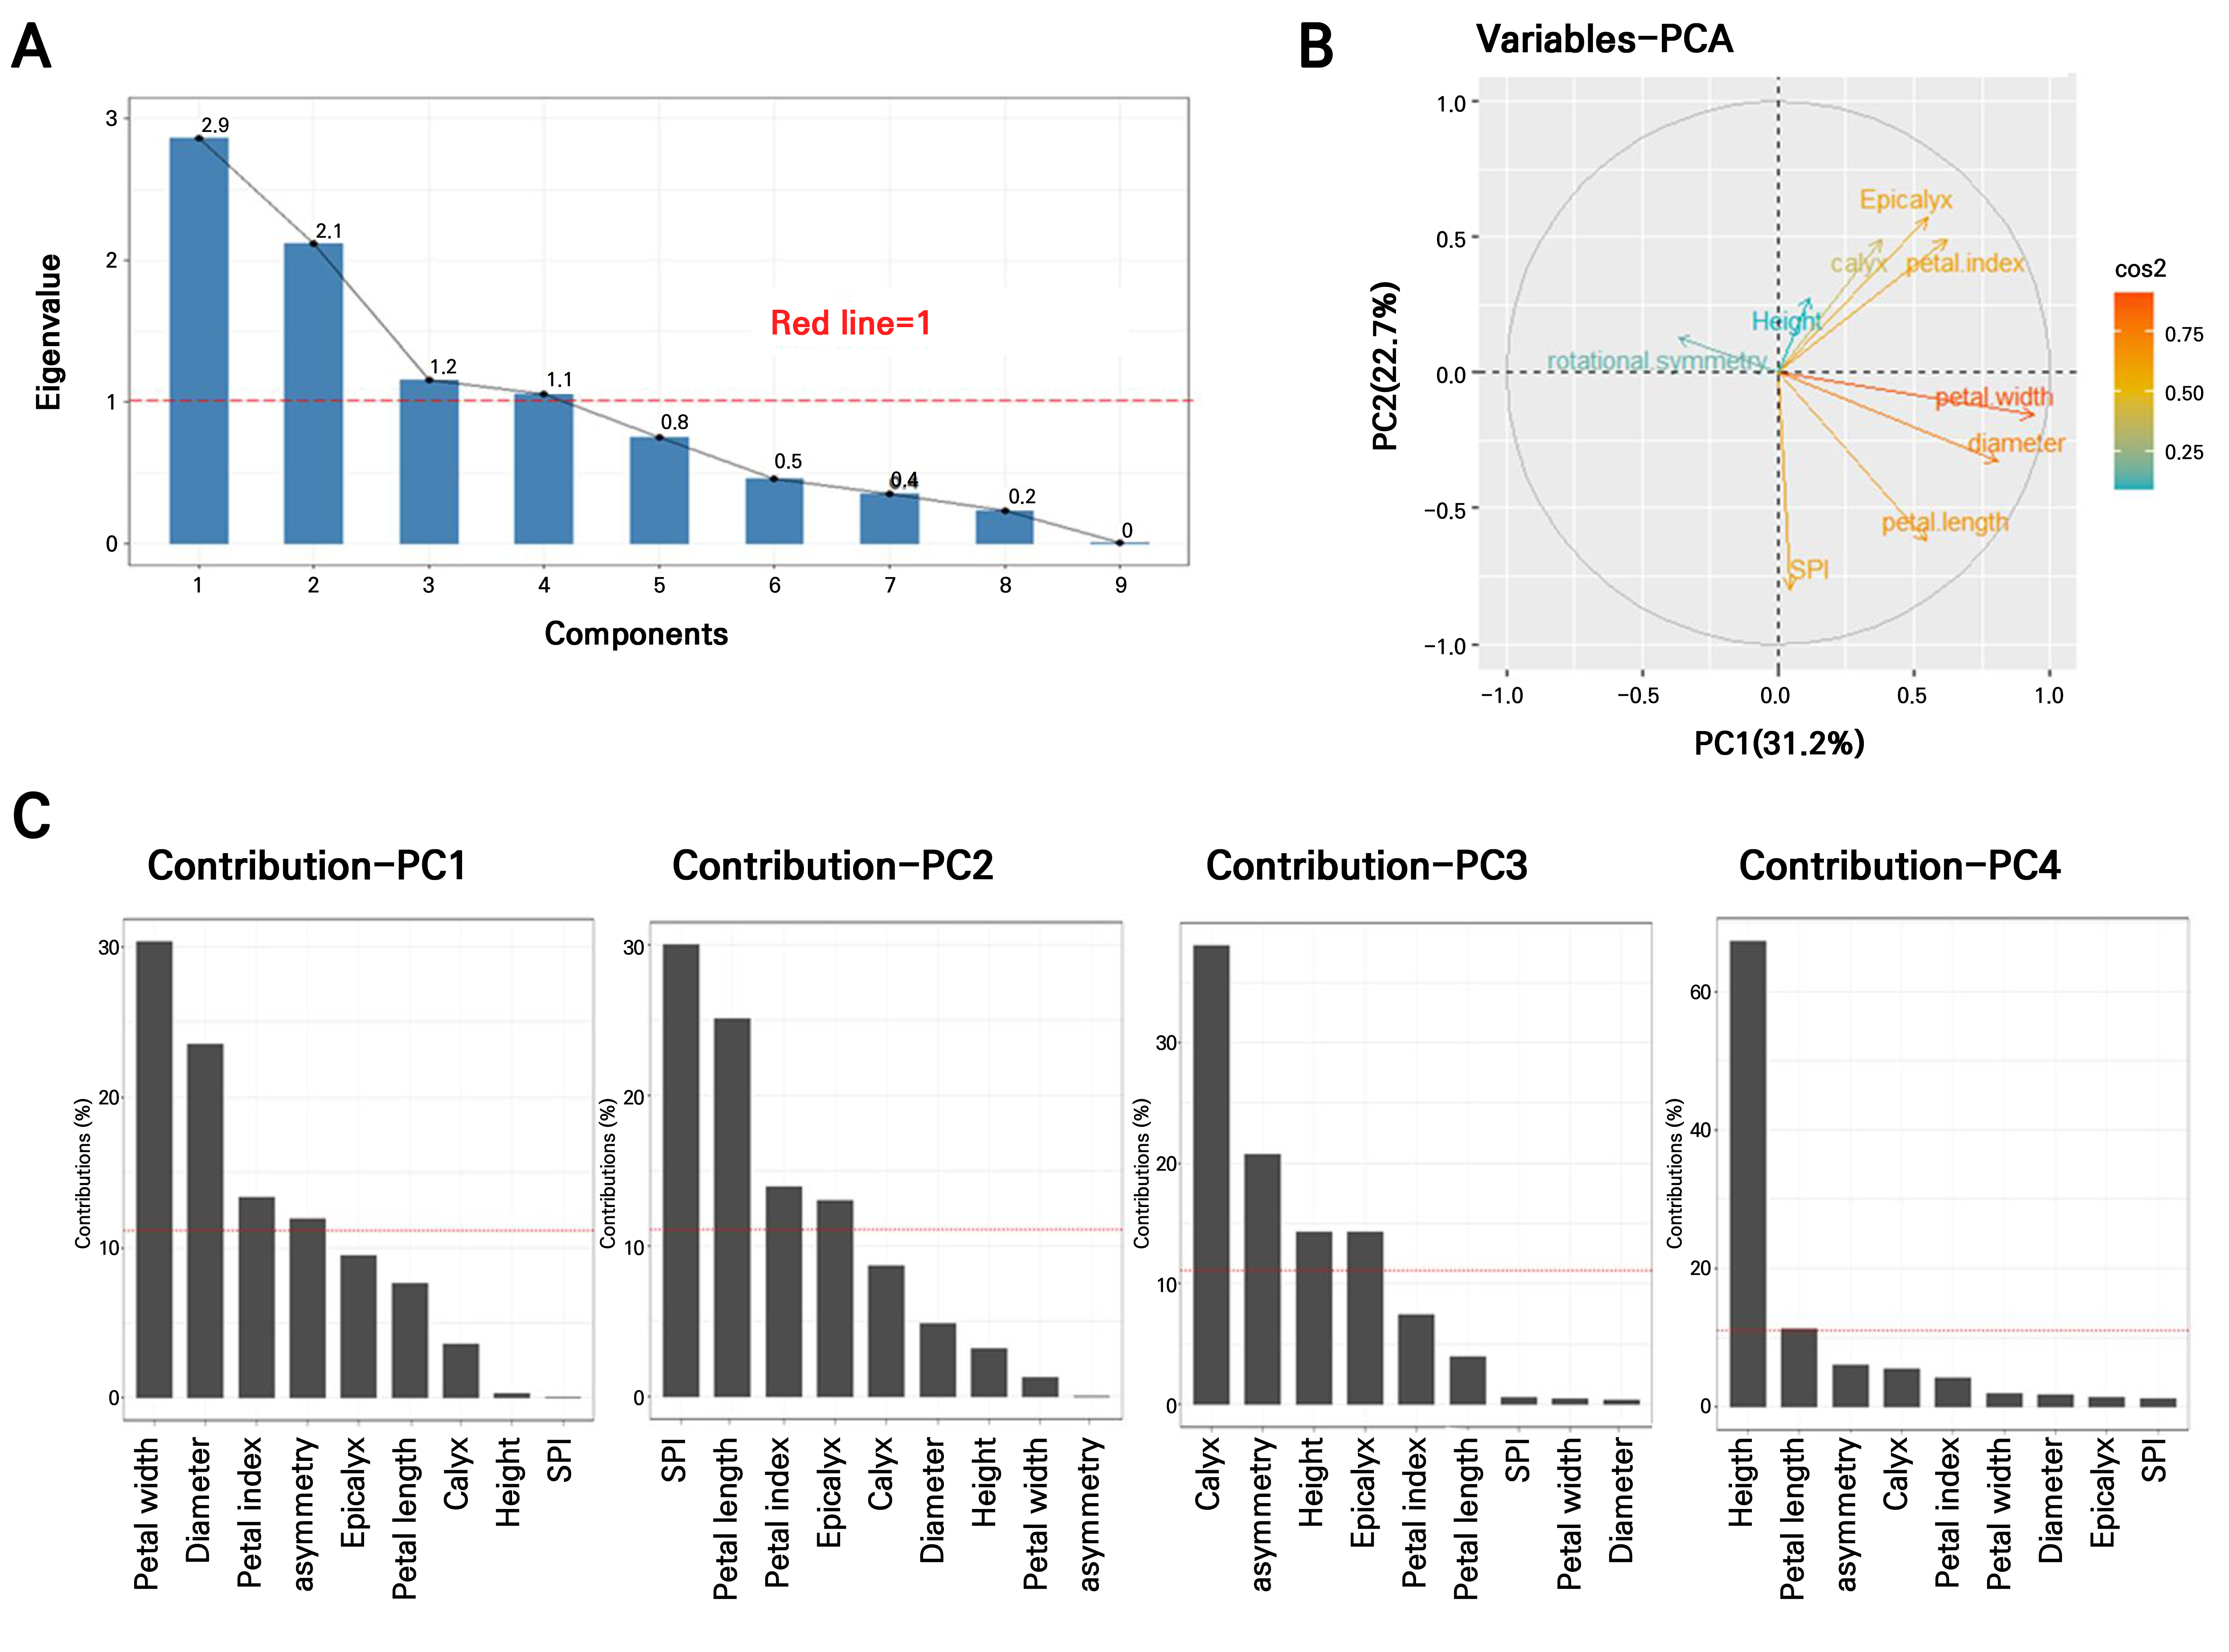
Fig. 1.
Principal component analysis (PCA) to identify key traits in leaf callus-derived clones; (A) Scree plot showing the eigenvalues of the first nine principal components. The red line indicates the threshold of eigenvalue > 1, meaning that each selected component accounts for more variance than an individual variable in the standardized data. (B) Variable correlation plot illustrating relationships among traits based on PCA. Traits positioned closer together are positively correlated, while those farther apart or on opposite axes are negatively correlated. (C) Contribution (%) of nine variables to PC1 (Dim-1), PC2 (Dim-2), PC3 (Dim-3), and PC4 (Dim-4). The red dashed line represents the expected average contribution. Variables exceeding this threshold are considered important contributors to the respective dimensions. PCA interpretation and visualization were conducted using the factoextra package in R.
The PCA loading plot (Fig. 1B) illustrates the relationships between traits; closely positioned variables indicate strong correlations. For example, the numbers of calyces and epicalyces were closely related. Petal width, flower diameter, and petal length were clustered in the same direction, with petal width found to have made the strongest contribution to the PCs. The number of stamen-petal intermediates (SPI) and petal length showed a moderate correlation, whereas flower asymmetry exhibited a negative correlation with petal width and flower diameter, which were positioned in the opposite direction. Additionally, flower asymmetry appeared nearly orthogonal to plant height and the number of SPI, indicating weak associations among these traits.
As shown in the contribution bar plot (Fig. 1C), PC1 (31.2%) was primarily affected by the petal width, flower diameter, and petal index. PC2 (22.7%) was shaped by the SPI number, petal length, and petal index. PC3 (12.9%) and PC4 (11.7%) were largely determined by the calyx number and plant height, respectively. The detailed loading values for each trait are listed in Supplementary Table 1.
Clustering based on floral morphological traits
The Hopkins statistic and VAT method were applied to evaluate the suitability of the H. syriacus leaf-callus-derived clonal plant dataset for a cluster analysis. The VAT image confirmed the clustering tendency, revealing three potential clusters along the diagonal. These consisted of two large clusters and one smaller cluster, as indicated by the orange regions in Fig. 3A. The optimal number of clusters was subsequently determined using the fviz_nbclust() function from the factoextra package in R, which applies the silhouette method to evaluate PAM clustering (Fig. 2B). Three clusters were the most appropriate for the 35 H. syriacus clones, including the donor plant. PCA-based PAM clustering was performed based on this result (k = 3). All 35 clonal plants, including the donor, were grouped into three distinct clusters (Fig. 3A). Most of the clones were grouped into Clusters 1 (n = 18) and 3 (n = 13), with the donor plant included in Cluster 1. In contrast, Cluster 2 consisted of only four individuals.
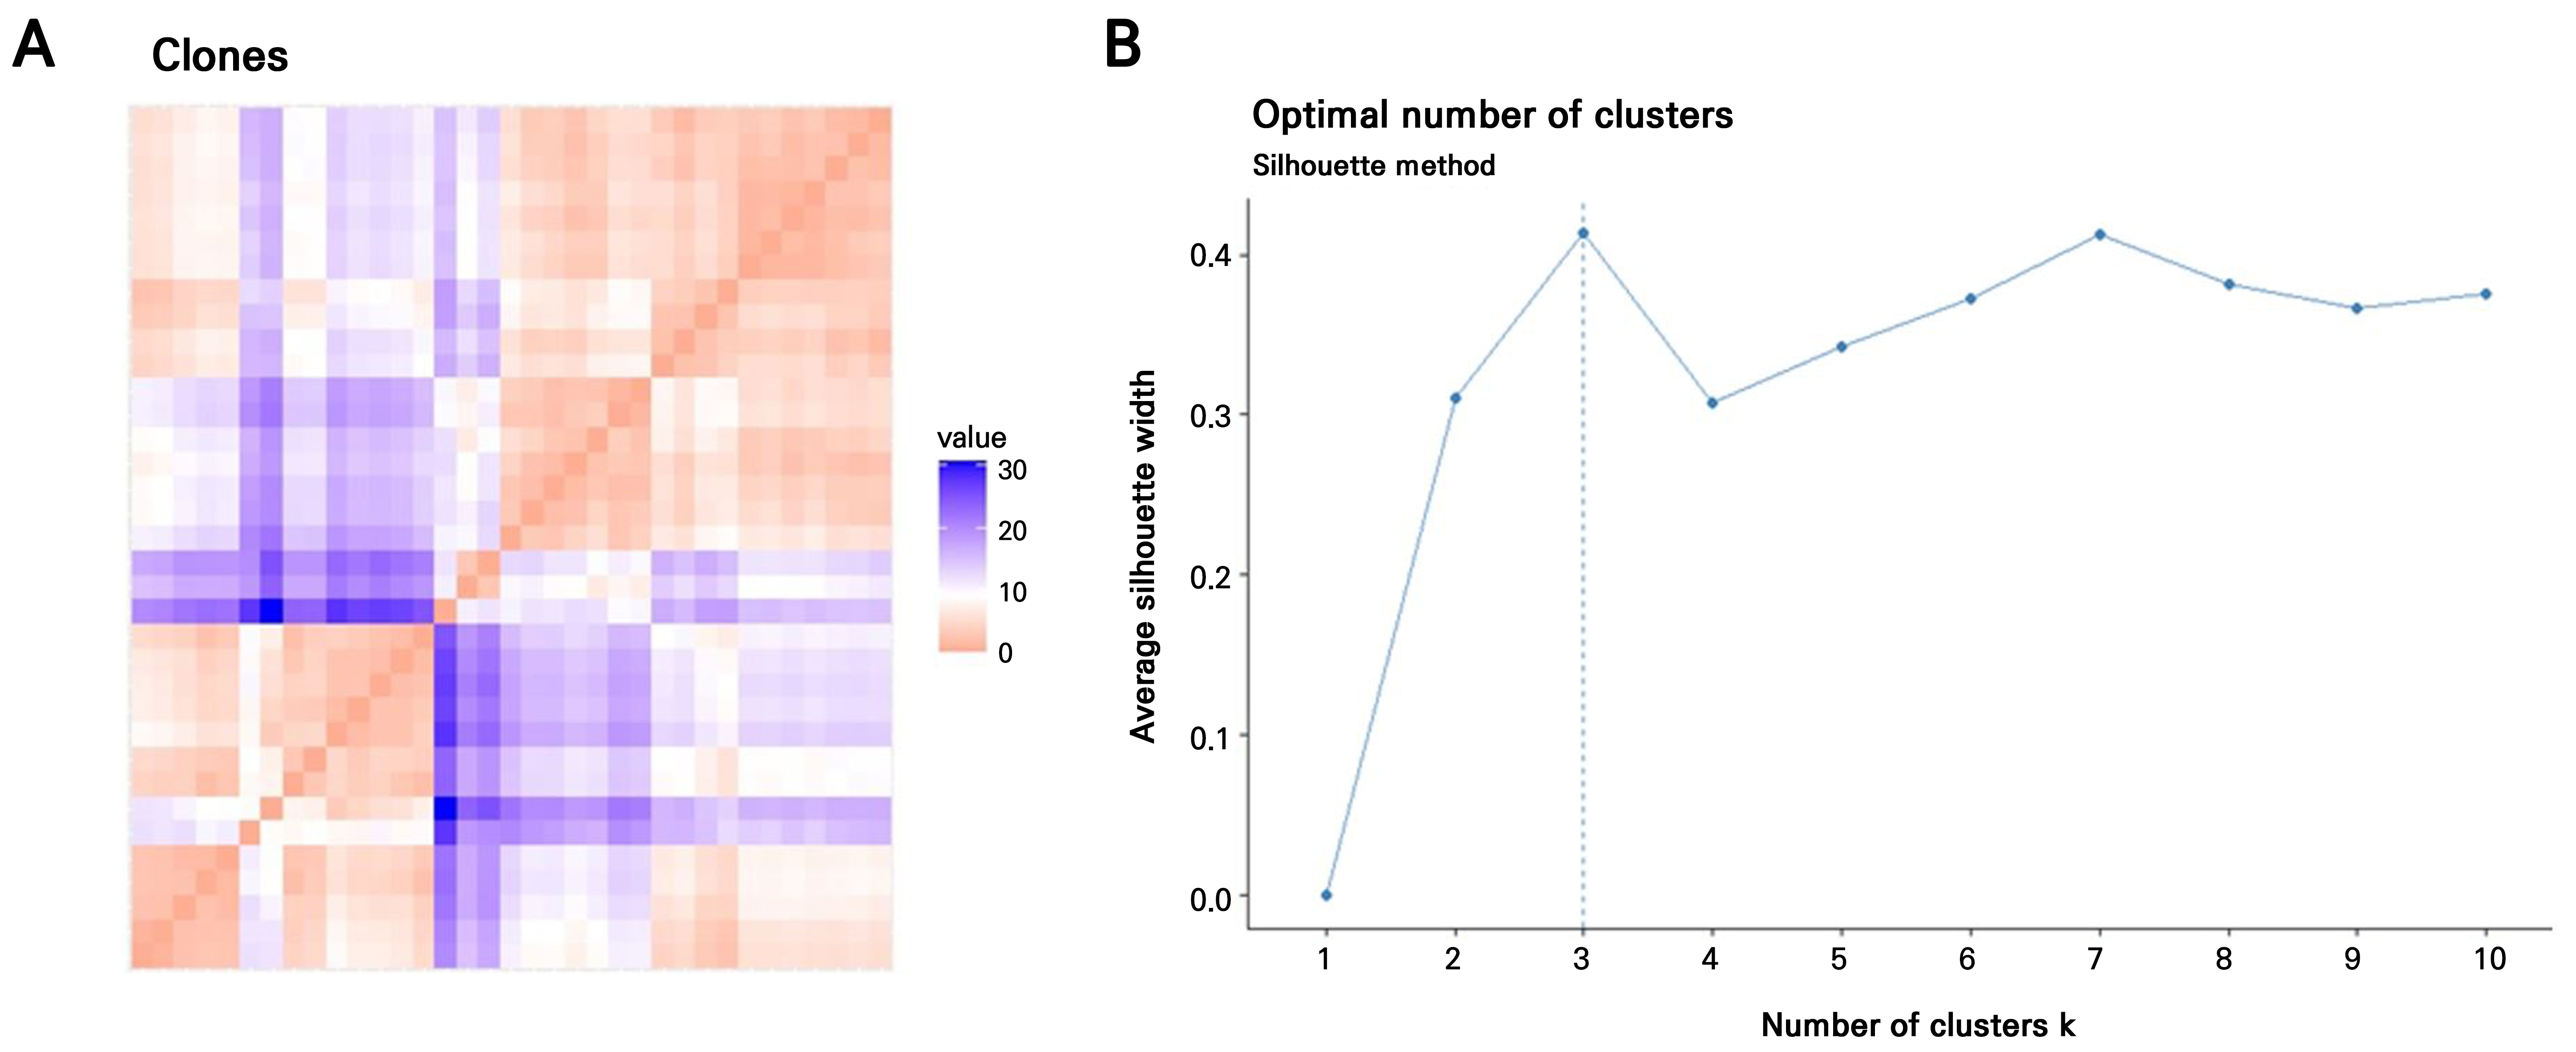
Fig. 2.
Determination of the optimal number of clusters in leaf callus-derived clones of H. syriacus ‘Nanpa’; (A) Visual assessment of cluster tendency (VAT) based on nine morphological traits. The VAT image, generated from a dissimilarity matrix, reveals an underlying cluster structure in the clone population. Color intensity indicates dissimilarity: red represents high similarity (near 0), while blue indicates lower similarity. The VAT was generated using the fviz_dist() function from the factoextra package in R. (B) Determination of the optimal number of clusters using the partitioning around medoids (PAM) algorithm and silhouette analysis. The dashed line indicates the optimal number of clusters as calculated using the fviz_nbclust() function (factoextra, R).
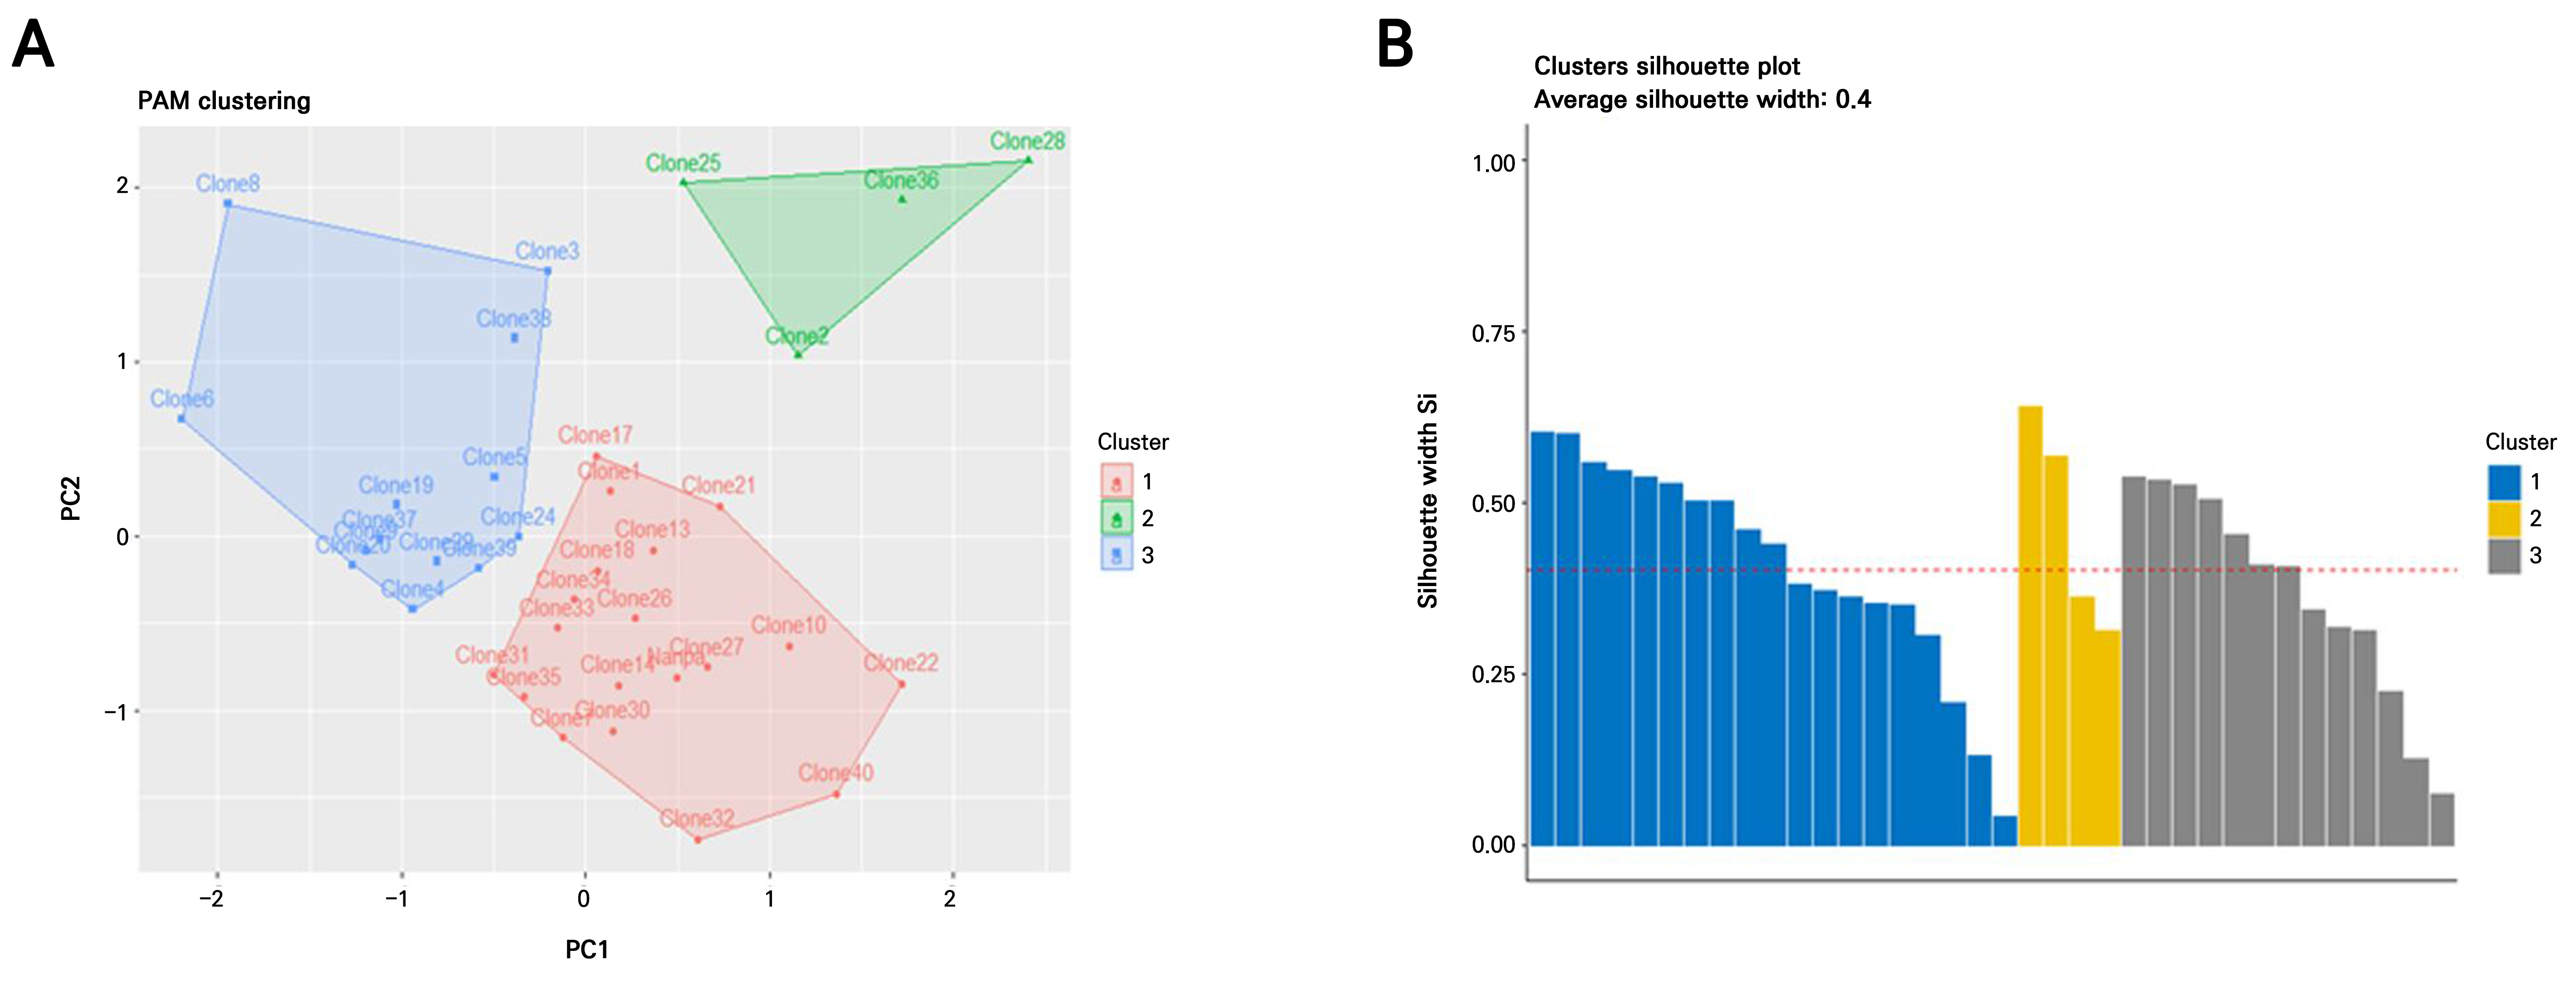
Fig. 3.
Clustering of H. syriacus ‘Nanpa’ somaclones based on morphological traits and cluster validations; (A) PAM clustering of individual somaclones based on a principal component analysis (PCA). The plot displays three clusters: red for Cluster 1, green for Cluster 2, and blue for Cluster 3. The arrow indicates the position of the donor plant ‘Nanpa’. The plot was generated using the eclust() function from the factoextra package in R. (B) Silhouette plot for validation of PAM clustering. A silhouette analysis evaluates how well each observation fits within its cluster, based on the average dissimilarity with its own and neighboring clusters. The average silhouette coefficients (Si) for Clusters 1, 2, and 3 were 0.42, 0.36, and 0.55, respectively. Si values greater than 0.5 indicate well-clustered points. The overall average silhouette value is indicated by the red dashed line. This plot was generated using the fviz_silhouette() function from the factoextra package in R.
A silhouette analysis was conducted to validate the clustering results. The average silhouette widths (Si) for Clusters 1, 2, and 3 were 0.41, 0.47, and 0.37, respectively, with an overall average silhouette width of 0.42 (Fig. 3B). A silhouette coefficient (s) > 0.5 generally indicates well-separated and well-defined clusters. The donor plant ‘Nanpa’ showed the highest silhouette value (s = 0.61) in Cluster 1, indicating clear separation, whereas Clone 31 exhibited the lowest value (s = 0.13). In Cluster 2, Clone 36 showed the most distinct grouping (s = 0.64), whereas Clone 2 showed the least separation within the cluster (s = 0.31). Clone 19 had the highest silhouette score (s = 0.54) in Cluster 3, whereas Clone 24 had the lowest (s = 0.07), suggesting weaker assignment confidence (Supplementary Table 2).
Floral trait profiles of the three clusters
The floral morphological traits of the three clusters (Table 1) were compared based on the clustering results. Each cluster exhibited distinct floral characteristics, and significant differences were confirmed using DMRT. Cluster 1 was characterized by relatively long petals. Cluster 2 showed the lowest SPI values relative to those of the other clusters. In addition, the petal index of Cluster 2 was significantly higher than those of the other clusters, indicating that the shapes of the petals were broader and shorter. In contrast, Cluster 3 exhibited a significantly narrower petal width and smaller floral diameter, representing an overall small-flowered phenotype. The clones in Cluster 1 showed values similar to those of the donor plant ‘Nanpa’ for most morphological traits (Supplementary Tables 1 and Table 1). This indicates that Cluster 1 most closely reflects the floral characteristics of the original cultivar. These morphological differences were visually supported by representative floral images from each cluster (Fig. 4). In particular, the floral size, shape, and color of Clones 28 and 36 from Cluster 2 were clearly distinguishable from those in the other clusters, consistent with the clustering pattern based on floral traits.
Table 1.
Comparison of floral morphological traits among three clusters identified by the pam algorithm based on principal component scores

Molecular marker analysis
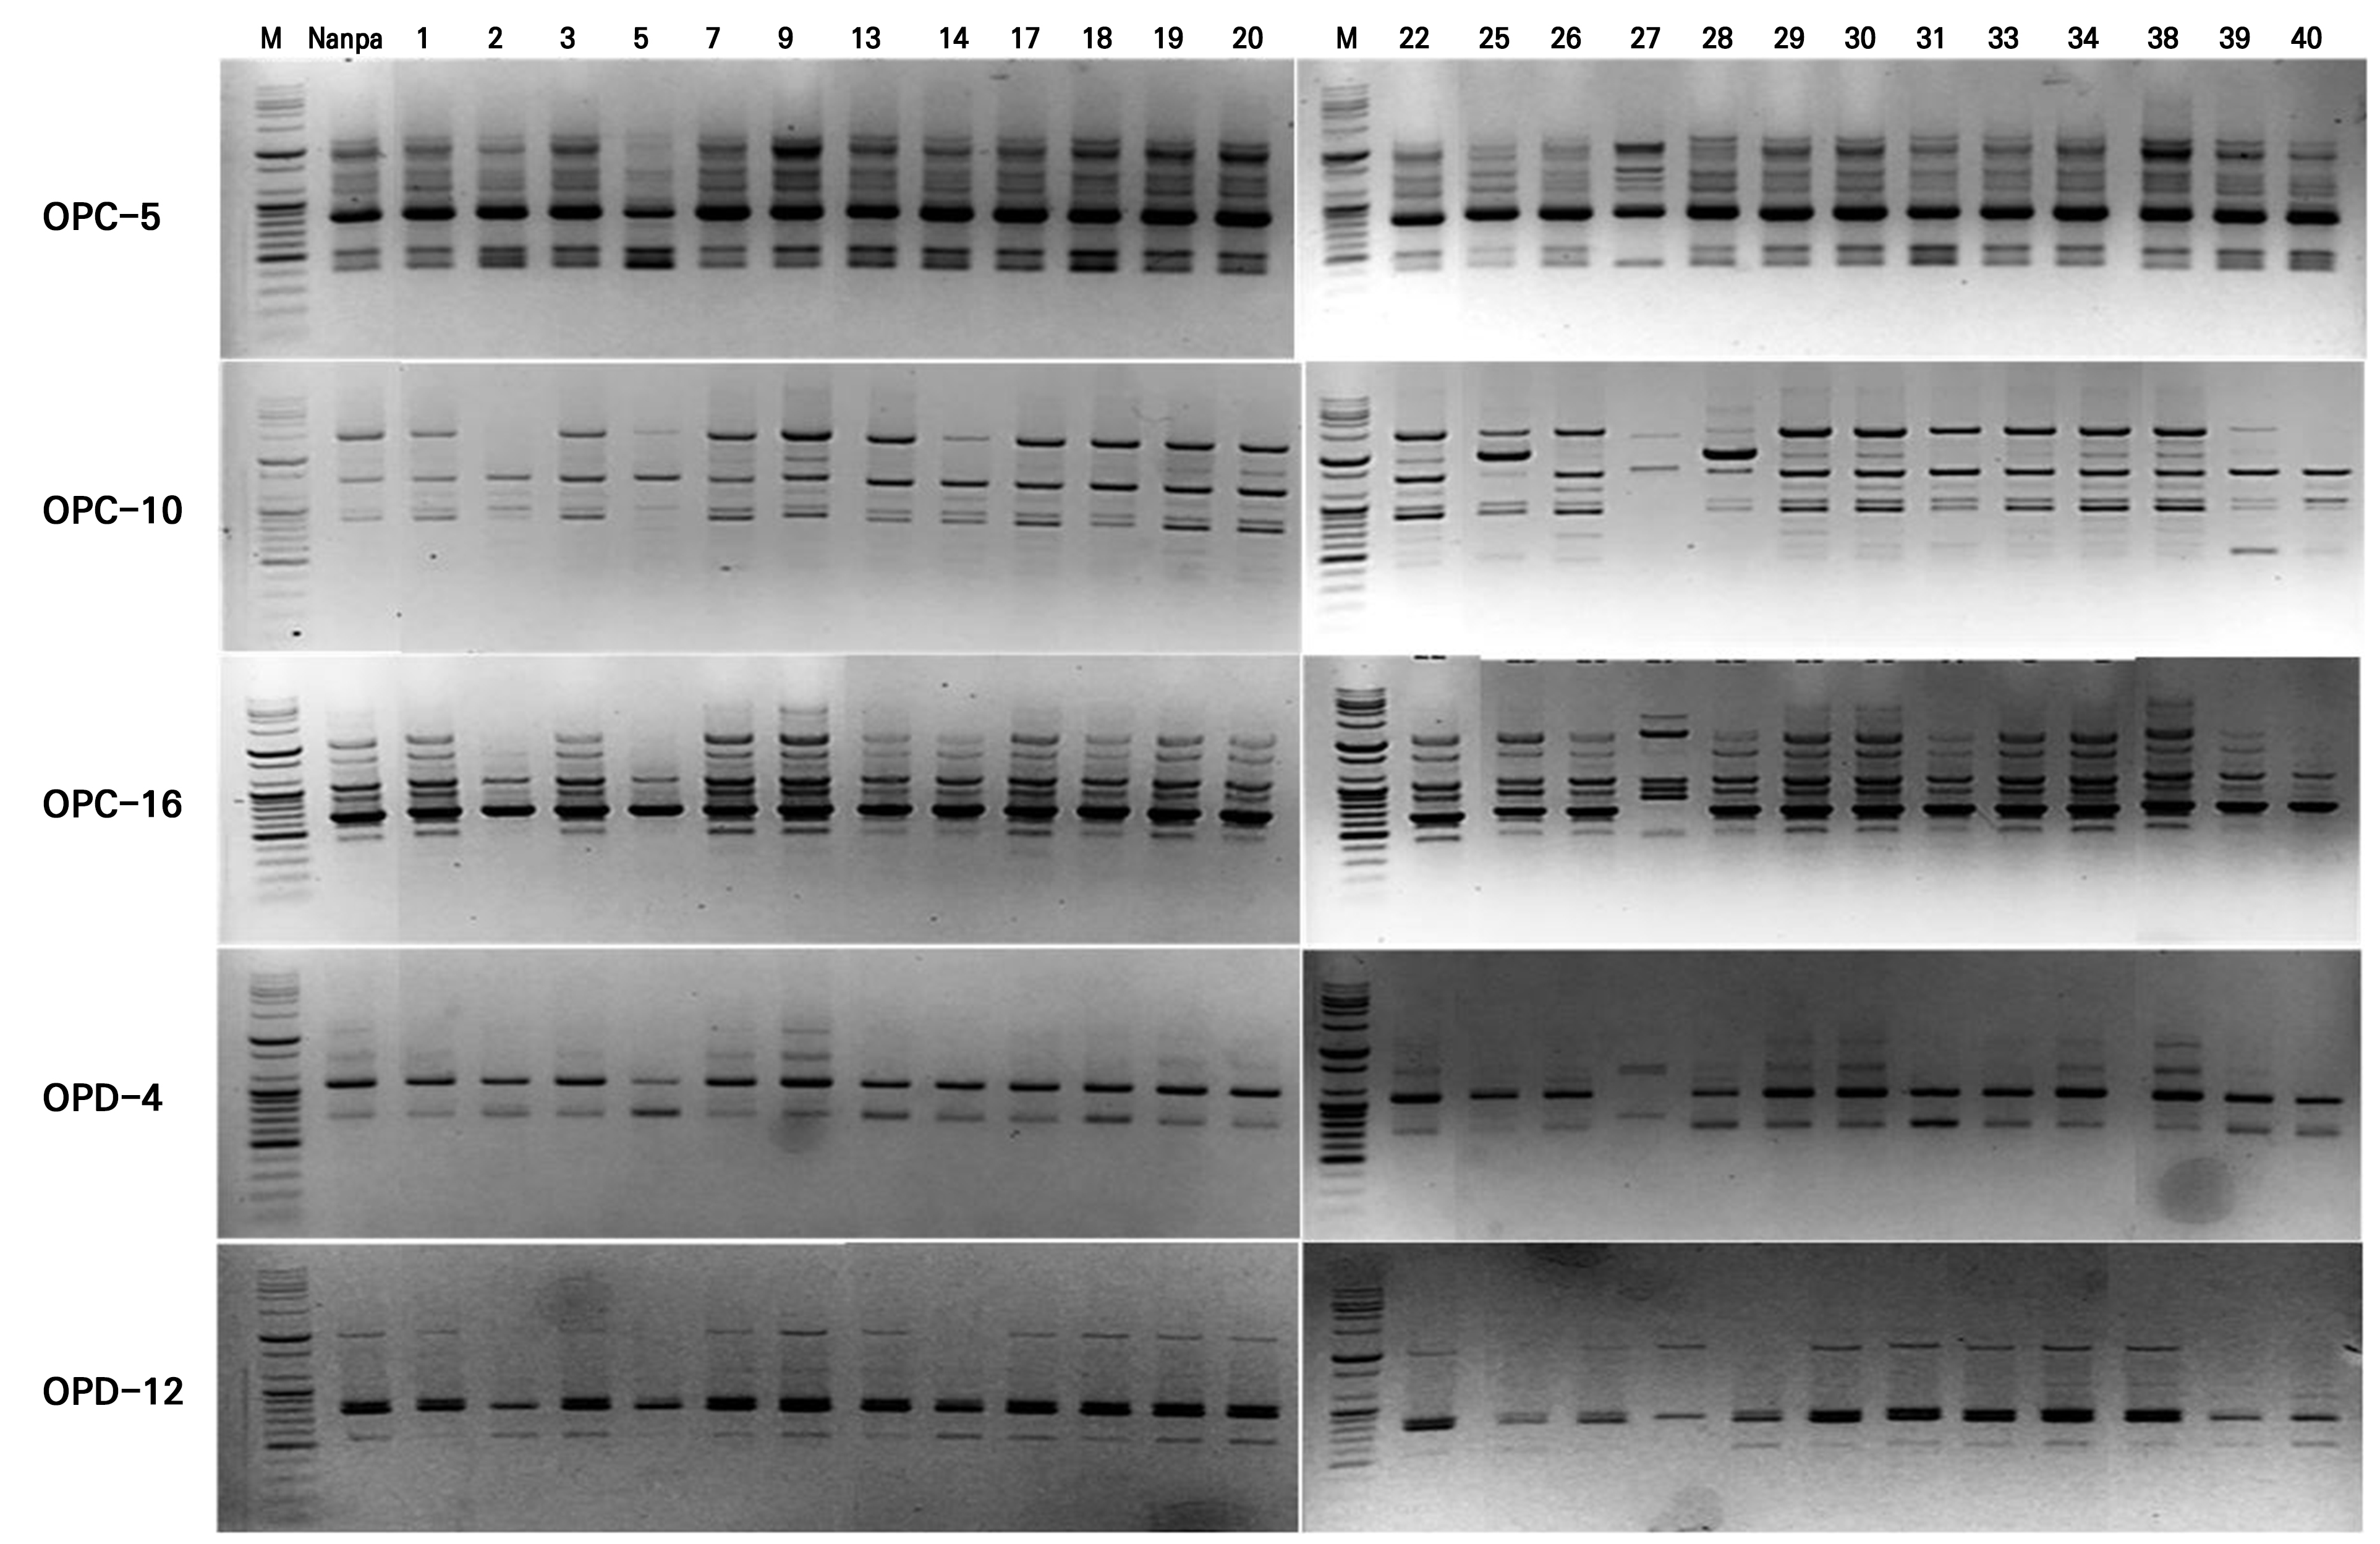
In this study, five primers were selected from an initial screening of 40 RAPD primers based on their ability to produce clear and reproducible amplification patterns. They were then used to evaluate the genetic stability of 25 callus-derived H. syriacus ‘Nanpa’ plants. The five primers generated 46 bands, of which 42 (approximately 91%) were polymorphic (Table 2). The amplified fragments ranged from 400 to 10,200 bp in size, and the percentage of polymorphic bands varied among the primers. For instance, OPC-5 showed 70% polymorphism, whereas OPD-4 and OPD-12 exhibited 100% polymorphism. These results demonstrate a strong discriminatory capacity for detecting genetic differences. In particular, OPD-4 and OPD-5 had the highest (0.461) and lowest (0.225) PIC values, respectively.
Table 2.
Characteristics of the Five RAPD primers used for 35 clones and the mother plant (H. syriacus ‘Nanpa’)
| Primer |
Primer seq (5’- > 3’) |
Range of amplified band size (bp) | Total number of bands |
Polymorphic bands |
Polymorphic Band (%) | PICz value |
| OPC-5 | GATGACCGCC | 400–2300 | 10 | 7 | 70 | 0.225 |
| OPC-10 | TGTCTGGGTG | 400–10200 | 13 | 11 | 84.61 | 0.375 |
| OPC-16 | CACACTCCAG | 450–5000 | 12 | 10 | 83.33 | 0.313 |
| OPD-4 | TCTGGTGAGG | 700–2000 | 6 | 6 | 100 | 0.461 |
| OPD-12 | CACCGTATCC | 550–1000 | 5 | 5 | 100 | 0.267 |
The RAPD banding patterns (Fig. 5) provided additional evidence of genetic variability among callus-derived clones, as several primers amplified distinct polymorphic bands unique to specific plants. Although the overall banding profiles suggested a generally high level of genetic fidelity among the tissue-culture-derived clones, the presence of unique bands in certain individuals indicated somaclonal variations during the in vitro culturing step. Clone 27 displayed a distinct RAPD profile compared to the donor plant ‘Nanpa,’ with clear differences in both the number and positions of bands across all five primers tested. These findings highlight not only the effectiveness of RAPD markers when used to assess the genetic uniformity of callus-derived clonal plants but also the potential value of such variations as a source of novel traits for breeding applications.
Genetic similarity and cluster analysis based on RAPD
Pairwise comparisons of callus-derived clonal plants based on RAPD markers revealed various genetic similarities with the donor plant H. syriacus ‘Nanpa.’ These ranged from 0.522 (between ‘Nanpa’ and Clone 5) to 0.957 (between ‘Nanpa’ and Clone 1) (Table 3). Clone 1 retained markedly high genetic similarity to the donor plant, whereas Clone 5 exhibited substantial genetic differences. The average similarity between clones and donors was approximately 0.78. The Jaccard similarity index ranged from 0.413 to 1.000 among the clones. Clones 22 and 29 showed a similarity coefficient of 1.000, indicating identical RAPD banding patterns with no detectable polymorphisms. In contrast, clone pairs, such as Clones 5 and 29 (0.413), exhibited relatively large differences. This suggests a measurable degree of somaclonal variation within the population. The overall average genetic similarity among all leaf-callus-derived clones was approximately 0.739.
Table 3.
Genetic similarity coefficients among H. syriacus ‘Nanpa’ clones and the donor plant based on rapd markers
A dendrogram was constructed based on similarity coefficients derived from the RAPD profiles (Fig. 6). The clones were grouped into four distinct clusters based on major branch points. Cluster 1, which comprised 17 clones including the donor plant ‘Nanpa,’ separated at a similarity level of 0.81, indicating relatively high genetic similarity. Clusters 2 (three clones) and 3 (five clones) were separated at similarity thresholds of 0.79 and 0.73, respectively. Cluster 4 contained only Clone 27, which diverged from the rest at a similarity level of 0.49. These results indicate that most of the clonal plants shared high genetic similarity with the donor and were classified into the same cluster.
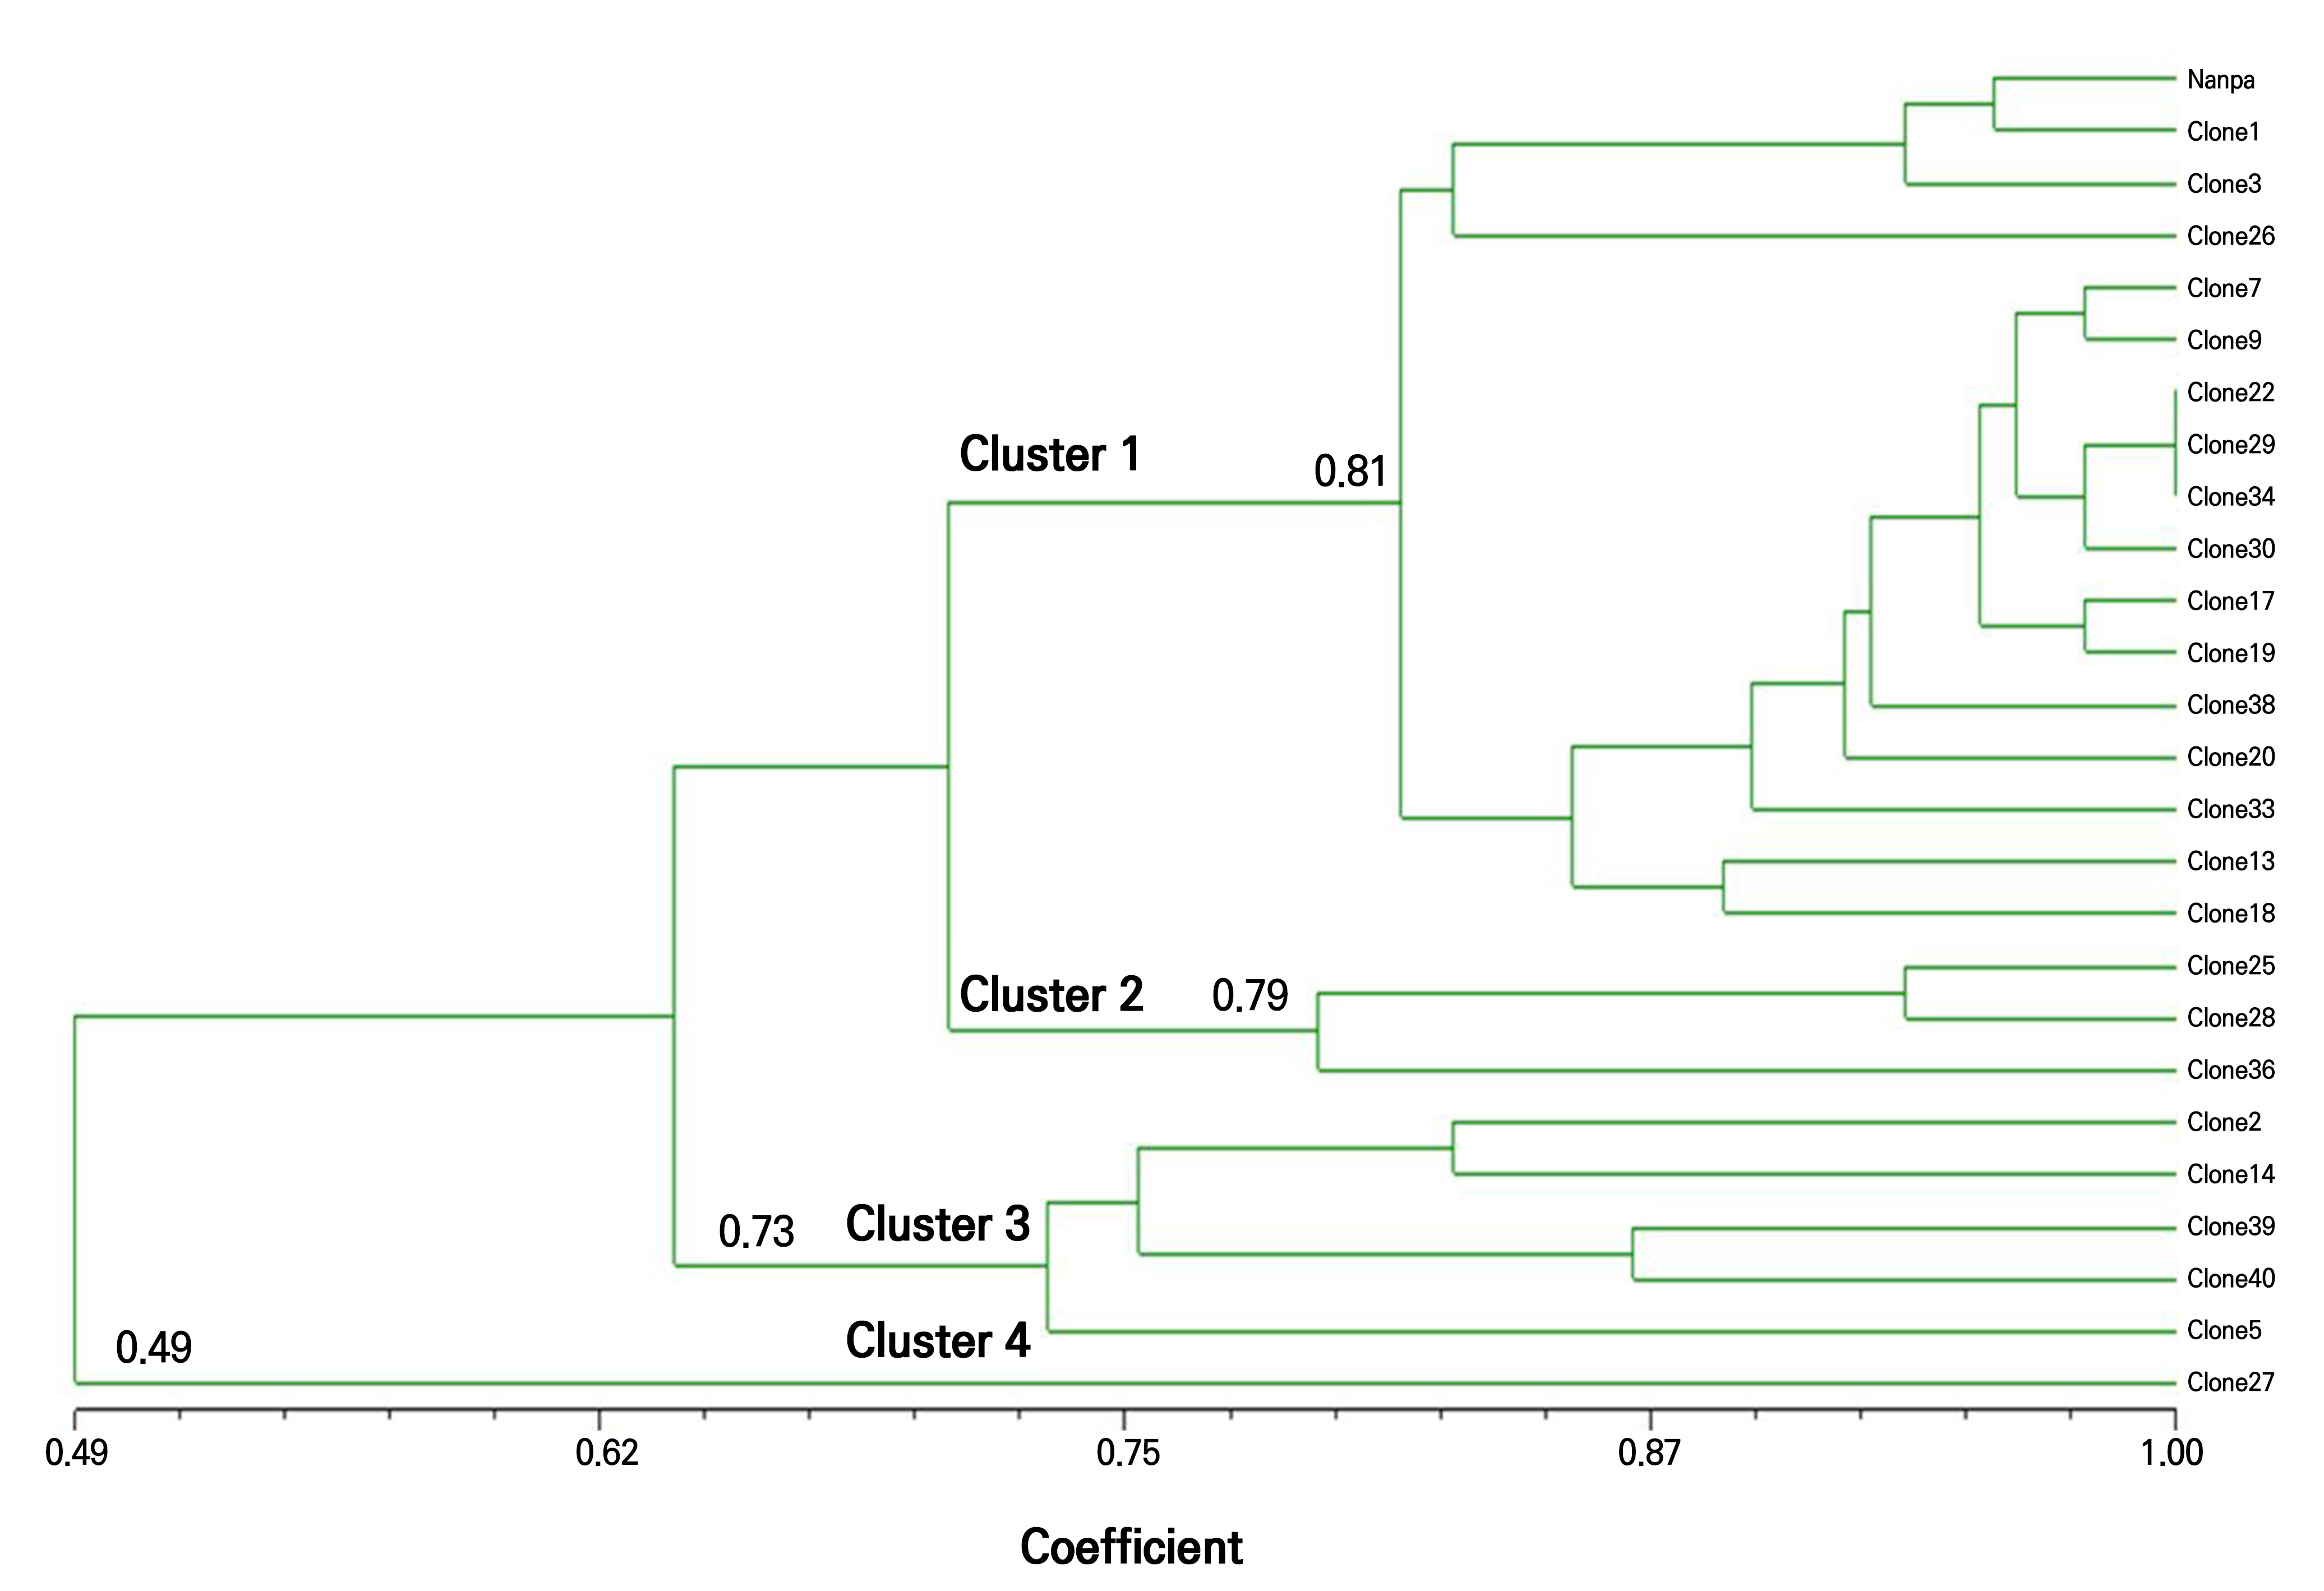
Fig. 6.
Genetic clustering of H. syriacus ‘Nanpa’ clones and the mother plant based on RAPD markers. A dendrogram was constructed using the UPGMA (unweighted pair group method with arithmetic mean) clustering method based on banding data from five RAPD primers. The scale bar indicates genetic similarity coefficients calculated using the Jaccard index.
Discussion
PCA is a dimensionality reduction technique that extracts PCs representing the greatest sources of variance in multivariate datasets. This enables both visual and statistical interpretations of trait contributions and sample distributions (Khan et al. 2017). Although PCA was previously used to classify H. syriacus cultivars based on leaf morphology (Cho 2006), integrated approaches that combine morphological and molecular data remain limited. PCA demonstrated five key floral traits—petal width, petal length, floral diameter, petal index, and SPI count—as the variables having the strongest effects in the present study, collectively explaining 78.5% of the total phenotypic variation (PC1 = 31.2%, PC2 = 22.7%, PC3 = 12.9%, and PC4 = 11.7%) in callus-derived clonal plants. These five major traits exhibited high communality, supporting their inclusion in the subsequent cluster analysis. These findings are consistent with those of previous reports (Sharifi et al. 2018) that highlighted the utility of high-communality traits in cluster formation. Taken together, these results suggest that the flower size and petal ratio are the central determinants of phenotypic clusters in callus-derived clonal populations.
Phenotypic uniformity is an important consideration in callus-derived clonal propagation; it refers to the consistent expression of traits under controlled conditions (Swartz et al. 1983). PCA-based PAM clustering classified the leaf-callus-derived clones into three groups: Clusters 1 (n = 18), 2 (n = 4), and 3 (n = 13). Most clones were grouped into Clusters 1 and 3. These clones exhibited floral traits largely similar to those of the donor plant 'Nanpa,' indicating that morphological uniformity was generally maintained. This contrasts with previous findings in which some callus-derived clones were assigned to clusters different from their donor plants (Khan et al. 2017). Cluster 1 closely resembled the donor in terms of the floral characteristics, whereas Cluster 3 showed slightly smaller flowers with narrower petals but remained relatively consistent. In contrast, Cluster 2 showed significant differences in the floral diameter, petal length, and petal width, particularly in Clones 28 and 36, suggesting their potential as novel breeding materials. Some Cluster 2 clones exhibited distinct purple petal coloration. In this study, uniformity was assessed based solely on the floral morphology, excluding petal color variations, as flower color variations within callus-derived ‘Nanpa’ clonal plants were documented in earlier work by the authors (Son et al. 2025) and were therefore not the primary focus of the present analysis.
Cluster separation was further validated by a silhouette analysis. The average silhouette coefficients for Clusters 1, 2, and 3 were 0.41, 0.47, and 0.37, respectively, indicating relatively low cohesion and separation among the groups. Although Cluster 2 exhibited the highest value, none of the clusters exceeded the widely used threshold (s > 0.5) for a well-defined grouping. In particular, the relatively low coefficients in Clusters 1 and 3 suggest that the morphological traits of the tissue-culture-derived H. syriacus clones were highly similar. These similarities likely resulted in reduced separation between the clusters, leading to lower silhouette values. The low silhouette scores could be interpreted as overlapping trait distributions or intermediate phenotypes rather than misclassification errors (Batool and Hennig 2021). Although Duncan’s test revealed significant differences between Clusters 1 and 3 for certain traits, the PCA results indicated similarity in the overall phenotypic patterns owing to differing contributions from each PC. These findings highlight the limitations of relying on single-trait comparisons or visual assessments to evaluate uniformity (Thieme et al. 2005) and demonstrate the value of PCA in capturing broader phenotypic structures.
Botstein et al. (1980) classified markers as highly (PIC > 0.5), moderately (0.25 < PIC < 0.5), or slightly (PIC < 0.25) informative. As marker informativeness increases with higher PIC values (Muthusamy et al. 2008), the primers used in this study, with an average PIC value of 0.38, were considered appropriate for detecting genetic diversity in the callus-derived population. The mean Jaccard similarity coefficient among the clones was 0.739, and the similarity between each clone and the donor plant ranged from 0.61 to 1.00, with an average of 0.78. The mean similarity coefficient among callus-derived clones was higher than the genetic similarity observed between different cultivars (Zhang et al. 2012). Similarly, the average similarity between callus-derived clones and donors was slightly higher than the mean similarity between the clones. This suggests that clones derived from the donor 'Nanpa' share a more consistent genetic background with the donor than with other leaf-tissue-cultured clones in the population. This genetic consistency can be attributed to selective pressures during propagation, such as grafting or cutting, in which cultivars with desirable traits are preferentially maintained. Similar phenomena have been observed in which artificial selection in clonal seed orchards led to increased genetic uniformity (Torres-Dini et al. 2024).
The RAPD amplification of H. syriacus ‘Nanpa’ and its 25 callus-derived clones demonstrated high genetic uniformity, with minor divergence. In the dendrogram constructed from RAPD data, the donor plant ‘Nanpa’ and most clones clustered together with similarity coefficients of > 0.813, indicating high genetic resemblance. When interpreting clonal fidelity based on a RAPD analysis, however, several considerations should be taken into account regarding the meaning of the similarity coefficients. Genetic similarity values are influenced by multiple factors, including the plant species, marker systems, and marker informativeness (polymorphic information content, PIC); accordingly, direct comparisons of absolute similarity values across different studies are not appropriate. In this study, the five RAPD primers exhibited an average PIC value of 0.38, corresponding to a moderately informative marker system suitable for detecting genetic variation. Markers with this level of informativeness are capable of revealing subtle genetic differences arising from leaf-callus–mediated somaclonal variations, which may result in relatively low similarity estimates even among genetically closely related clonal individuals. In light of these considerations, although the observed similarity values appear lower than those commonly reported, the average similarity coefficient of approximately 0.78 observed between the callus-derived clones and the donor plant does not indicate complete genetic uniformity but can be interpreted as reflecting a substantial degree of genetic fidelity at the clonal population level.
Morphological and molecular clustering analyses confirmed that the tissue-culture-derived clones maintained genetic stability, although certain clones exhibited detectable variations. The observed genetic variation suggests the occurrence of somaclonal variations during tissue culture. These findings indicate the feasibility of using leaf callus culture as a practical means of generating genetically stable clones, while also enabling the emergence of novel genetic variants that are valuable for breeding. Continuous clonal propagation through tissue culturing can increase the risk of unintended variations. Therefore, for the industrial application of tissue-culture-derived clones, continuous evaluations of both morphological and genetic fidelity are essential; however, such assessments are often difficult to implement in practice. As an alternative strategy, rather than repeatedly using leaf materials derived from clones originating from calli, selected elite mother plants can be maintained and propagated over the long term through vegetative cuttings, with leaf tissues continuously obtained from these stabilized donor plants. This approach may reduce the accumulation of unexpected somaclonal variation. In addition, when evaluation results from clonal populations regenerated under standardized culture conditions are systematically compiled into a database, the need for repeated morphological and genetic fidelity assessments of leaf-callus–derived clonal populations can be minimized. Collectively, such strategies may enhance the practical feasibility and reliability of tissue-culture-derived clones for industrial propagation and breeding applications.
Most of the callus-derived clonal plants showed strong morphological similarities to the donor plant Nanpa, supporting a high degree of phenotypic uniformity. However, Clone 27 showed the greatest genetic divergence among all clones, despite exhibiting floral traits similar to those of the donor. Clone 27 exhibited a low similarity coefficient (0.565) in the similarity matrix, one of the lowest values detected among the clones analyzed in this study. Furthermore, this clone showed relatively low genetic similarity values in comparisons with other clonal individuals, indicating that it is genetically separate from both the donor and other clones within the population. This finding indicates that genetic distance does not always correlate with morphological similarity, demonstrating the limitations of assessing the uniformity of tissue-culture-derived plants based solely on phenotypic traits. Although tissue-cultured clones are typically considered genetically and morphologically identical, this may not always hold true (Torres-Silva et al. 2018). Previous studies have highlighted the importance of molecular validation for confirming clonal fidelity in micropropagated plants (Bhattacharyya et al. 2017). Therefore, a comprehensive evaluation of the uniformity and stability of tissue-culture-derived plants should include both morphological and molecular assessments (Yu and Chung 2021; Duta-Cornescu et al. 2023; Dorani et al. 2024). The results of this study provide valuable insights into the potential for industrial applications of callus-derived clonal plants of H. syriacus, demonstrating that both phenotypic and molecular uniformities are largely maintained compared to the donor plant. Furthermore, the identification of somaclonal variants highlights their potential use for genetic improvements in breeding programs.
Conclusion
This study demonstrated that leaf-callus–derived clones of H. syriacus ‘Nanpa’ generally maintain high morphological and genetic uniformity, as confirmed by two independent clustering approaches: a PCA-based cluster analysis of floral morphological traits and dendrogram-based clustering derived from RAPD marker profiling. Most clones showed floral characteristics and genetic profiles highly similar to those of the donor plant. Nevertheless, a subset of clones displayed detectable variations in both the floral morphology, particularly in flower-size–related traits, and genomic profiles, reflecting somaclonal variation arising during callus-mediated regeneration. This dual nature may have significant implications not only for breeding programs—especially for key ornamental traits of H. syriacus such as the flower size and petal morphology—but also for large-scale propagation and industrial applications.
Supplementary Material
Supplementary materials are available at Horticultural Science and Technology website (https://www.hst-j.org).
- HORT_20260004_Fig_S1.pdf
Supplementary Fig. 1. Donor plant and acclimatized clonal plants of H. syriacus ‘Nanpa’ derived from leaf calli; (A) Donor plant (H. syriacus ‘Nanpa’) grown under field conditions, showing the characteristic morphological features of the cultivar, and (B) acclimatized clonal plants derived from leaf tissue, maintained in a growth chamber
- HORT_20260004_Table_S1.pdf
Supplementary Table 1. Eigenvalues, Percentages of Variance Explained, and Loadings of the First Four Principal Components
- HORT_20260004_Table_S2.pdf
Supplementary Table 2. Mean values (± SE) of floral traits for clones grouped into three morphology-based clusters
