

Introduction
Materials and Methods
Plant materials and population development
Phenotypic evaluation and calculation of the FFI
Genomic DNA extraction, library construction, and sequencing
BSA-seq analysis and QTL mapping
Results
Phenotypic variation and genetic inheritance of female flowering frequency
Genome-wide identification of a major locus via BSA-seq
Construction of the genetic linkage map and QTL detection
Validation and characterization of the qFFI5.1 locus using HRM markers
Identification of candidate genes within the qFFI5.1 genomic region
Discussion
Conclusion
Introduction
Watermelon (Citrullus lanatus L.) is a widely cultivated cucurbit crop of significant economic and nutritional value. It is a rich source of phytochemicals, including lycopene, citrulline, and vitamins, contributing to its popularity as a quintessential summer fruit (Mashilo et al. 2022). To meet diverse consumer demands and ensure market competitiveness, breeding programs have focused on improving fruit quality traits such as flesh color, sugar content, and rind patterns (Wang et al. 2019; Luo et al. 2023). However, traits that determine yield potential and earliness, particularly flowering characteristics, are fundamental for stable production (Katuuramu et al. 2023). In monoecious crops such as watermelon, where male and female flowers develop separately on the same plant, the timing and frequency of female flower initiation are direct determinants of the fruit yield and harvest timing (Martínez and Jamilena 2021).
The transition from the vegetative to reproductive phase is a critical developmental switch regulated by the complex interplay of environmental and endogenous cues. In model plants, such as Arabidopsis, flowering is orchestrated through diverse pathways, including photoperiod, vernalization, gibberellin (GA), and autonomous pathways, which integrate signals to activate floral meristem identity genes (Quiroz et al. 2021). Physiological factors, particularly carbohydrate availability and more specifically the accumulation of sugars such as trehalose-6-phosphate, also serve as vital signals related to flowering competence (Quiroz et al. 2021). Furthermore, the spatial arrangement and sex differentiation of flowers in cucurbits are strongly heavily influenced by hormonal crosstalk. Ethylene is the primary sex-determining hormone, and its interactions with auxins and GAs plays a pivotal role in modulating the male-to-female flowers ratios (Aamir et al. 2021). For instance, auxin generally promotes femaleness by upregulating ethylene biosynthesis, whereas GAs often antagonize this effect, promoting maleness in many cucurbits (Manzano et al. 2016; Boualem et al. 2022).
Interestingly, the physiological response of watermelons to these hormonal signals differ from those of other model cucurbits. Although ethylene promotes female flower development in cucumber and melons, it has also been reported to inhibit the transition from male to female flowering and reduce the number of pistillate flowers in watermelon (Manzano et al. 2016; Aguado et al. 2018). This unique physiological characteristic suggests that the regulatory network governing female flowering in watermelons may possess distinct features that are not found in related species. Despite these findings, most previous studies concerning watermelon have been limited to qualitative traits, such as the presence or absence of female flowers (monoecy vs. andromonoecy) controlled by specific loci such as CitACS4 (Manzano et al. 2016), or general flowering times measured simply by days to anthesis (McGregor et al. 2014).
However, there is a significant absence of research regarding on the quantitative frequency of female flowering, specifically the architectural distribution of female flowers along the vine. The female flowering index (FFI), which quantifies the ratio of nodes to female flowers, serves as a precise morphological indicator of the "flowering tendency" and yield potential. Unlike cucumber, in which quantitative trait loci (QTLs) for gynoecy and subgynoecy have been extensively mapped (Win et al. 2019), the genetic basis and physiological regulation of high-frequency female flowering in watermelon remain largely unexplored. Understanding the genetic architecture of the FFI is essential for breeding cultivars with concentrated fruit sets and early maturity.
Next-generation sequencing -based approaches, such as bulk segregant analysis sequencing (BSA-seq) and genotyping-by-sequencing (GBS), have revolutionized trait mapping by enabling the rapid identification of genomic regions associated with complex traits (Elshire et al. 2011; Takagi et al. 2013). These methods have successfully identified QTLs for fruit traits, disease resistance, and plant architecture in watermelon (Cho et al. 2021; Liang et al. 2022). However, the specific genomic regions and candidate genes governing quantitative variation in FFI have not been fully elucidated using these high-resolution techniques.
In this study, we aimed to dissect the genetic basis of female flowering tendency in watermelon using an F2 population derived from a cross between a high-female-flowering line (DAPFF01) and a low-female-flowering line (A0228). By combining BSA-seq and GBS-based high-density linkage mapping, we identified a major reliable QTL on chromosome 5 associated with FFI. Furthermore, we developed molecular markers based on single-nucleotide polymorphisms (SNPs) within the candidate region. These findings provide novel insights into the genetic and physiological regulation of female flowering patterns and offer practical tools for marker-assisted selection (MAS) to those seeking to breed early-maturing and high-yielding watermelon cultivars.
Materials and Methods
Plant materials and population development
The mapping population was developed from a cross between the maternal line ‘DAPFF01’ (P1), which exhibits a high female flowering frequency (HFFF), and the paternal line ‘A0228’ (P2), characterized by a low female flowering frequency (LFFF). An F2 segregating population consisting of 178 individuals was generated by self-pollination of a single plant. To analyze genetic effects, backcross populations were developed by crossing the hybrid to each recurrent parent (BC1P1, n = 50; BC1P2, n = 50). All plant materials, including the parental lines, F1, F2, and backcross populations, were cultivated in a greenhouse at Chung-Ang University, Ansung, Korea, during the spring season of 2023. The plants were grown using standard agronomic practices for watermelon, with drip irrigation and regular fertilization.
Phenotypic evaluation and calculation of the FFI
Phenotypic traits related to female flowering were monitored weekly, from the emergence of the first female flower until the plants reached the 40th node. To assess flowering habits quantitatively, the FFI was defined and calculated as the ratio of the total number of nodes to the number of female flowers observed up to the n-th node (total nodes/number of female flowers). A lower FFI value indicated a higher frequency and earlier onset of female flowering. For bulked segregant analysis (BSA), individuals were classified into two distinct phenotypic groups: HFFF (FFI < 4.0) and LFFF (FFI ≥ 4.0), based on the phenotypic distribution observed in the population.
Genomic DNA extraction, library construction, and sequencing
Genomic DNA was extracted from young leaf tissues of parental lines and individuals using the GeneAll® Exgene™ Plant SV Mini Kit (GeneAll Biotechnology, Korea) following the manufacturer’s protocol. The DNA concentration and quality were assessed using a NanoDrop spectrophotometer (DeNovix, Wilmington, DE, USA) and 1% agarose gel electrophoresis, respectively. DNA was quantified using the Qubit™ dsDNA HS assay kit (Invitrogen, Carlsbad, CA, USA) and diluted to 20 ng/µL for sequencing and downstream analysis.
For BSA-seq, two DNA bulks were constructed by pooling equal amounts of DNA from 25 individuals exhibiting extreme HFFF and 25 individuals exhibiting extreme LFFF phenotype. Whole-genome resequencing libraries for the parents and the two bulks were constructed and sequenced on the Illumina NovaSeq 6000 platform (Illumina, San Diego, CA, USA), generating 150-bp paired-end reads with minimum coverage of approximately 30×.
For GBS, DNA from 178 individuals and their parents was digested with the restriction enzyme ApeKI (New England Biolabs, Ipswich, USA). The GBS libraries were constructed according to the protocol described by Elshire et al. (2011) and sequenced using an Illumina NextSeq 500 platform.
BSA-seq analysis and QTL mapping
Raw sequencing reads were trimmed and aligned to the C. lanatus reference genome ‘97103’ v2.0 (Guo et al. 2019) using the Burrows-Wheeler Aligner (BWA-MEM) algorithm (v0.7.17) (Li and Durbin 2010). SNP calling was performed using the Genome Analysis Toolkit (GATK) Unified Genotyper (Van der Auwera et al. 2013). Low-quality SNPs were filtered based on the read depth (>10) and mapping quality (>30). To identify candidate genomic regions, the SNP-index for each bulk sample was calculated as described by Takagi et al. (2013). Statistical confidence intervals of the SNP-indices were determined to identify genomic regions that were significantly associated with the FFI trait (Wu et al. 2019).
Linkage map construction and QTL analysis
To construct a high-resolution genetic map of watermelon, GBSwas conducted following a modified protocol originally proposed by Elshire et al. (2011). The mapping population included eight individuals from the DAPFF01 parental line (P1), eight from the A0228 parental line (P2), and 178 F2 progeny. Genomic DNA from each sample was digested with the restriction enzyme ApeKI (New England Biolabs). Adapter-ligated fragments, each tagged with a unique barcode, were pooled across samples and subsequently purified using a QIAquick PCR Purification Kit (Qiagen, Valencia, USA). Ligated DNA was amplified using adaptor-specific primers and Takara Ex Taq polymerase (Takara Bio Inc., Japan). Amplified fragments were resolved on a 2% agarose gel (Agarose SFR™, Amresco, USA) to confirm successful library generation.
The pooled libraries were sequenced using an Illumina NovaSeq 6000 system. Raw FASTQ sequences were trimmed and aligned to the watermelon reference genome (C. lanatus cv. 97103 v2.0) (Guo et al. 2019) using the BWA-MEM algorithm (Li and Durbin 2010). SNPs were identified using the TASSEL-GBS v2.0 (Glaubitz et al. 2014; An et al. 2025), and subsequent filtering steps retained polymorphic sites segregating between the parental lines. Variant calling results were stored in the VCF format and further processed using BCFtools (Lefouili and Nam 2022) for downstream genetic map development. SNPs identified from the GBS data were filtered for missing data (<30%) and the minor allele frequencies (MAF > 0.05).
A genetic linkage map was constructed using JoinMap v5.0 (Van 2018) with a logarithm of the odds (LOD) score threshold of 4.1 for grouping. Recombination frequencies were converted to centiMorgans (cM) using the Kosambi mapping function (Kosambi 1943). A QTL analysis was conducted using the composite interval mapping (CIM) method in Windows QTL Cartographer v2.5. The significance threshold for QTL detection was determined using a 1,000-permutation test (p < 0.05).
Marker development and high-resolution melting (HRM) analysis
Thirteen SNPs within the candidate QTL interval were selected for HRM marker development. Primers were designed using Primer3 (https://bioinfo.ut.ee/primer3-0.4.0/) (Supplementary Table 1), and HRM genotyping was performed on a LightCycler® 96 platform (Roche Diagnostics, Germany) to generate the melting curves of the PCR amplicons. Each 10 µL reaction mixture contained 2 ng of purified genomic DNA, 1× LightCycler® 480 High-Resolution Melting Master mix (Roche Diagnostics), 0.5 µM of each forward and reverse primer, and 3 mM MgCl2. The melting curves were analyzed using LightCycler® 96 SW 1.1 software (Roche Diagnostics) to determine the genotypes. The co-segregation ratio was calculated as the percentage of individuals for which the genotype at the marker locus matched the corresponding phenotypic classes.
Results
Phenotypic variation and genetic inheritance of female flowering frequency
The female flowering habits of the parental lines, F1, and segregating populations were systematically evaluated using the FFI, a quantitative metric representing the node frequency of female flower initiation. The parental lines exhibited distinct and stable phenotypic differences (Table 1). The maternal parent ‘DAPFF01’ exhibited an HFFF phenotype with a mean FFI of 3.02 ± 1.45 (coefficient of variance (CV) = 14.82%), whereas the paternal parent ‘A0228’ displayed a LFFF phenotype with a mean FFI of 5.10 ± 1.62 (CV = 12.06%). The F1 hybrids displayed an intermediate phenotype (mean FFI = 4.13 ± 1.38) and exhibited the lowest CV (9.30%), indicating high phenotypic uniformity and stability in the heterozygous state.
Table 1.
Phenotypic variation and frequency distribution of the female flowering index (FFI) in the parental lines and segregating population
| Population | No. of Plants | Mean ± SD | Range | Skewness | Kurtosis | CV (%)z |
| P1 | 30 | 3.02 ± 0.45 | 2.15–3.89 | 0.12 | ‒0.35 | 14.82 |
| P2 | 30 | 5.10 ± 0.62 | 3.98–6.45 | ‒0.08 | ‒0.22 | 12.06 |
| F1 | 50 | 4.13 ± 0.38 | 3.25–4.95 | 0.05 | ‒0.18 | 9.30 |
| BC1P1 | 50 | 3.27 ± 0.58 | 2.05–4.78 | 0.24 | ‒0.15 | 17.54 |
| BC1P2 | 50 | 4.31 ± 0.71 | 2.95–6.22 | 0.18 | ‒0.28 | 16.27 |
| F2 | 178 | 3.89 ± 0.95 | 1.85–6.58 | 0.31 | ‒0.42 | 24.22 |
zCV, coefficient of variation
P1, maternal parent with a high female flowering frequency; P2, paternal parent with a high female flowering frequency; F1, first filial generation; BC1P1, backcross to P1; BC1P2, backcross to P2; F2, second filial generation. The female flowering index was calculated as the total number of nodes divided by the number of female flowers observed up to the n-th node.
In the F2 population (n = 178), the FFI values showed a broad range of 1.85 to 6.58, with a mean of 3.89 ± 1.95. Notably, the F2 population displayed the highest CV (= 24.22%) among all populations, reflecting extensive genetic segregation and phenotypic diversity resulting from crossing. The phenotypic distribution in the F2 population followed a continuous, near-normal distribution (skewness = 0.31, kurtosis = ‒0.42), commonly found when quantitative traits are controlled by multiple loci (Fig. 1). Furthermore, transgressive segregation was observed, with some F2 individuals exhibiting FFI values lower than the HFFF parent or higher than the LFFF parent. These results indicate that the female flowering frequency in watermelon is a quantitative trait influenced by polygenic inheritance. The backcross populations (BC1P1 and BC1P2) also exhibited distributions skewed toward their respective recurrent parents, with CV values of 17.54% and 16.27%, respectively (Table 1).
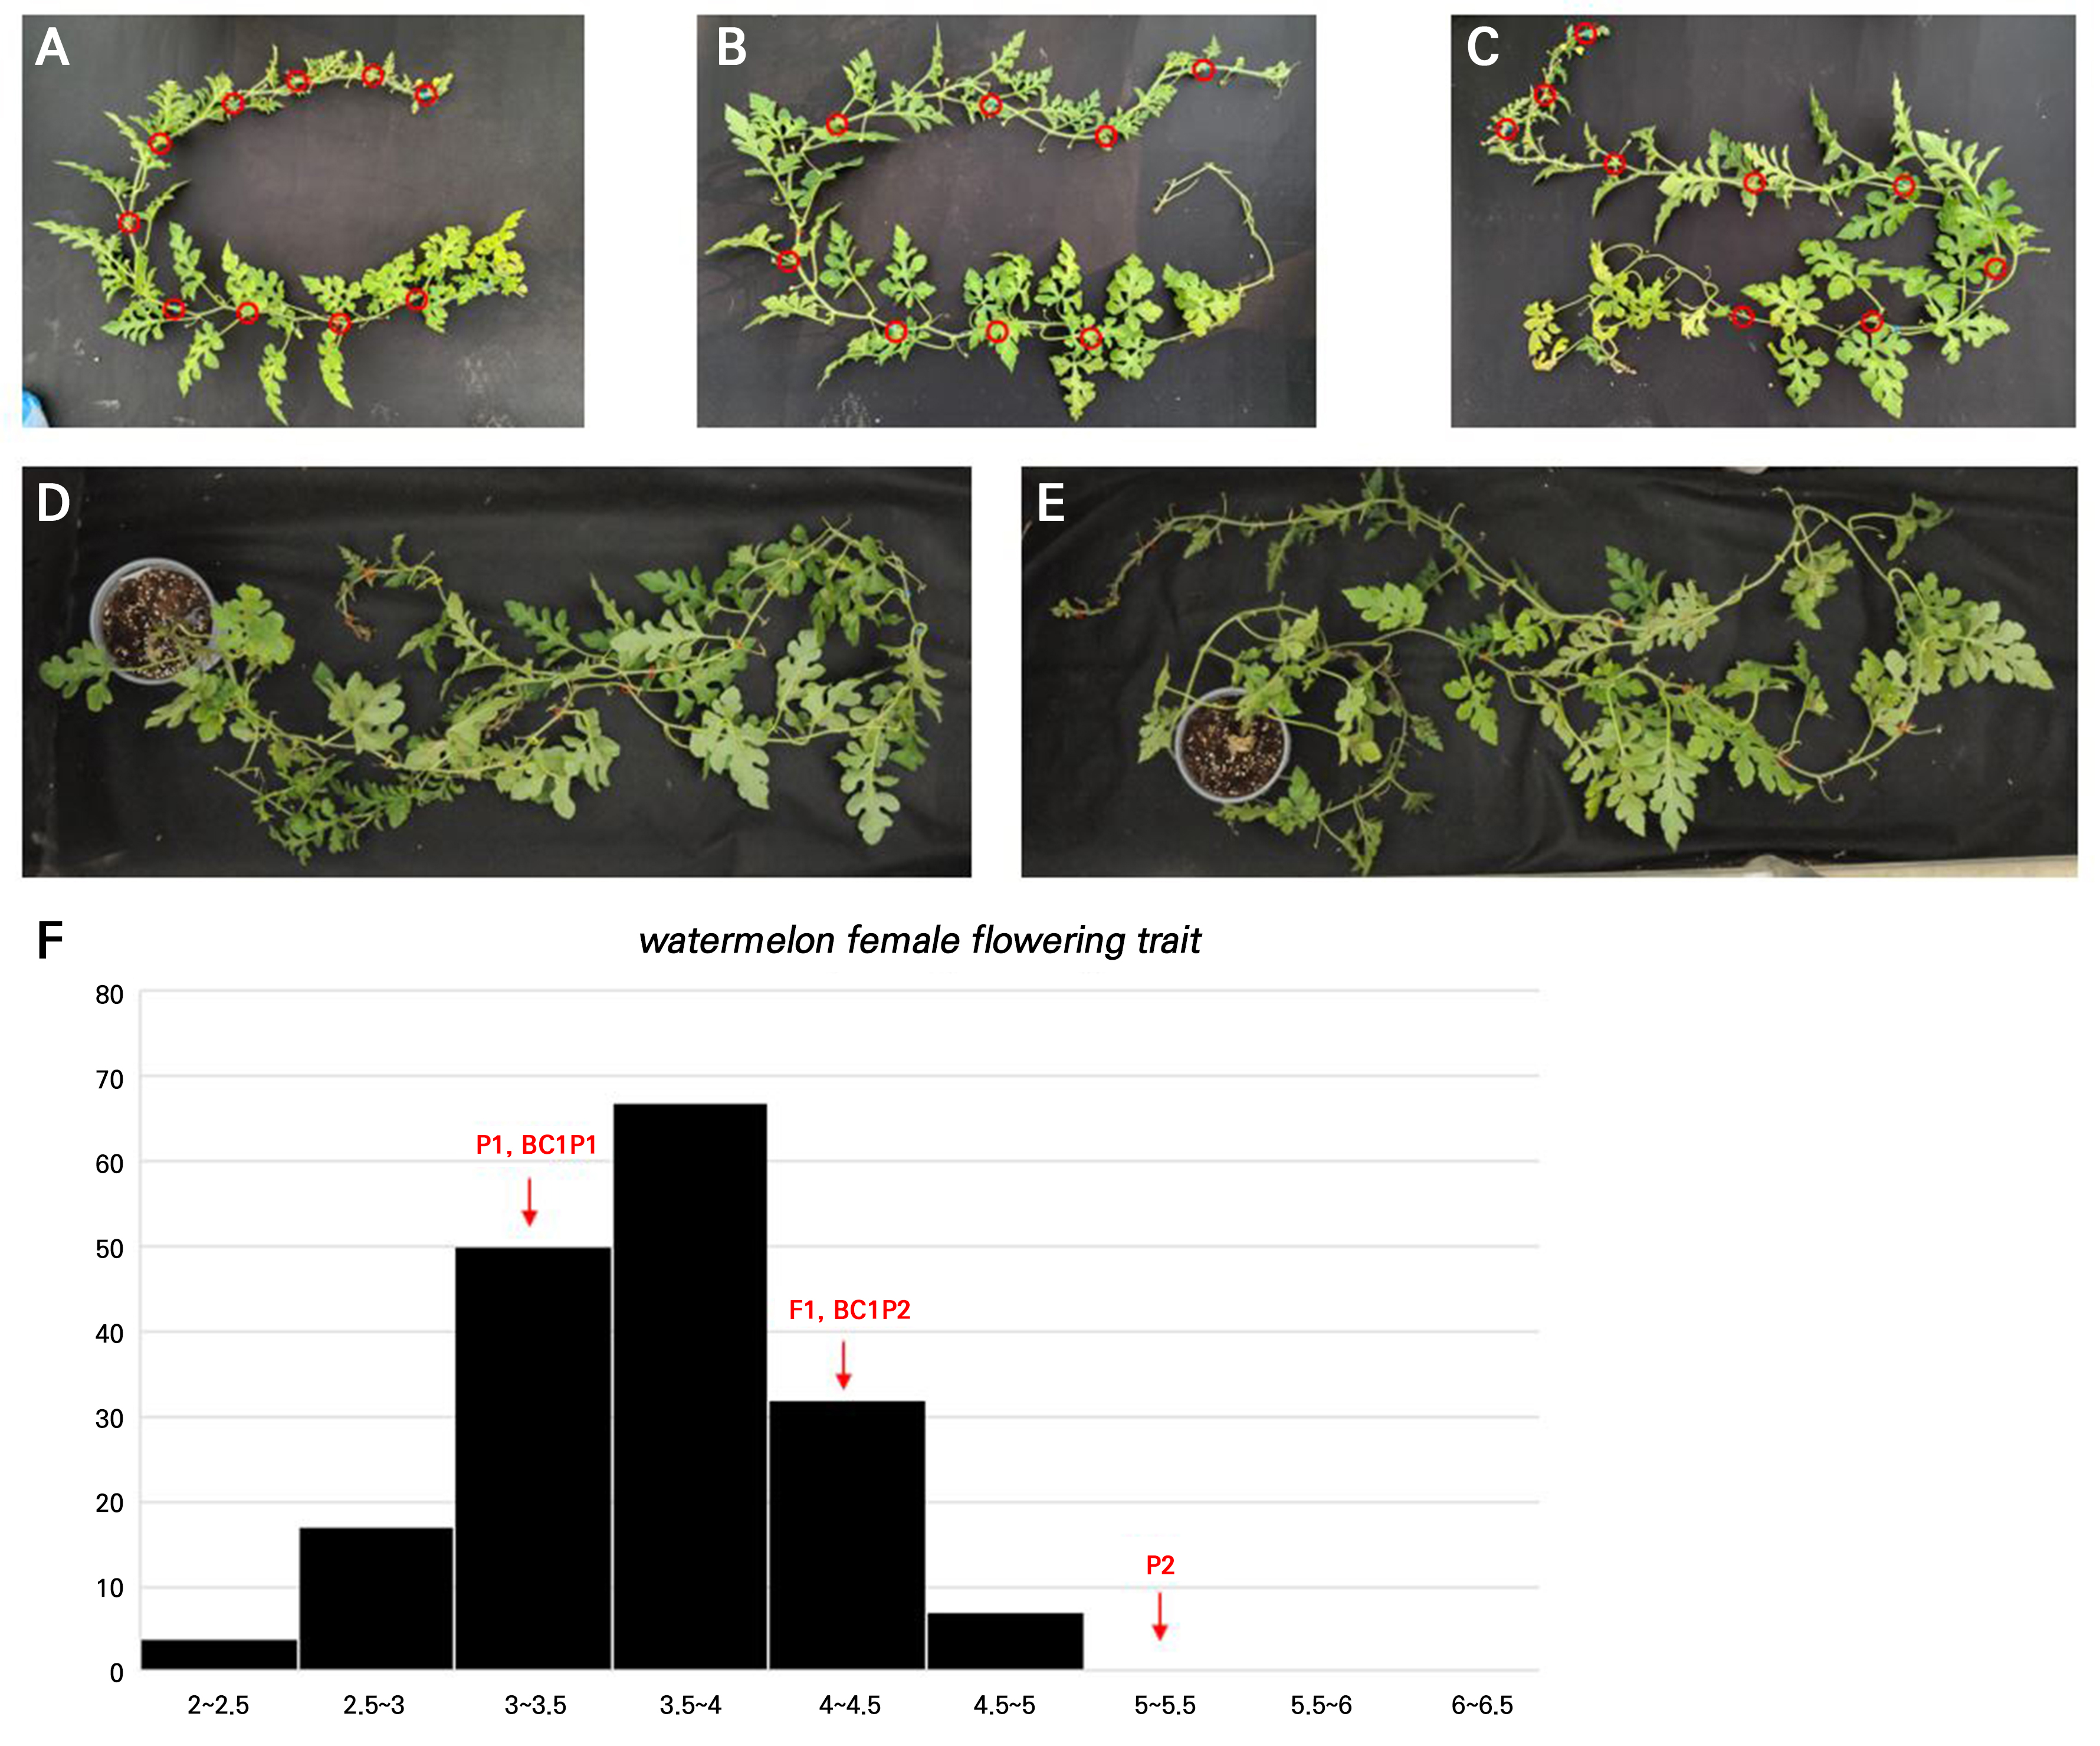
Fig. 1.
Phenotype of plants and histogram in F2 progeny. A~E: Phenotype of DAPFF01, A0228 and the corresponding F1, and F2 progeny. The red circles of A, B, C, D, and E represent female flowers (A: DAPFF01, P1; B: A0228, P2; C: F1 progeny; D: F2 progeny-8; E: F2 progeny-93). F is a histogram of the F2 phenotype.
Genome-wide identification of a major locus via BSA-seq
For the rapid identification of genomic regions associated with FFI, we employed BSA-seq. By pooling DNA from individuals with extreme phenotypes (25 HFFF vs. 25 LFFF individuals), we effectively filtered out background noise and identified significant differences in allele frequencies. We calculated the ΔSNP-index across the entire genome to screen for candidate loci. As shown in Supplementary Fig. 1, the ΔSNP-index values across most chromosomes fluctuated around zero, indicating no significant association with the trait involving these regions. However, a highly significant peak deviating from the null hypothesis was detected on chromosome 5 (Fig. 2). The ΔSNP-index values in this region significantly exceeded the 99% confidence interval, suggesting that a major QTL governing the female flowering frequency resides on chromosome 5.
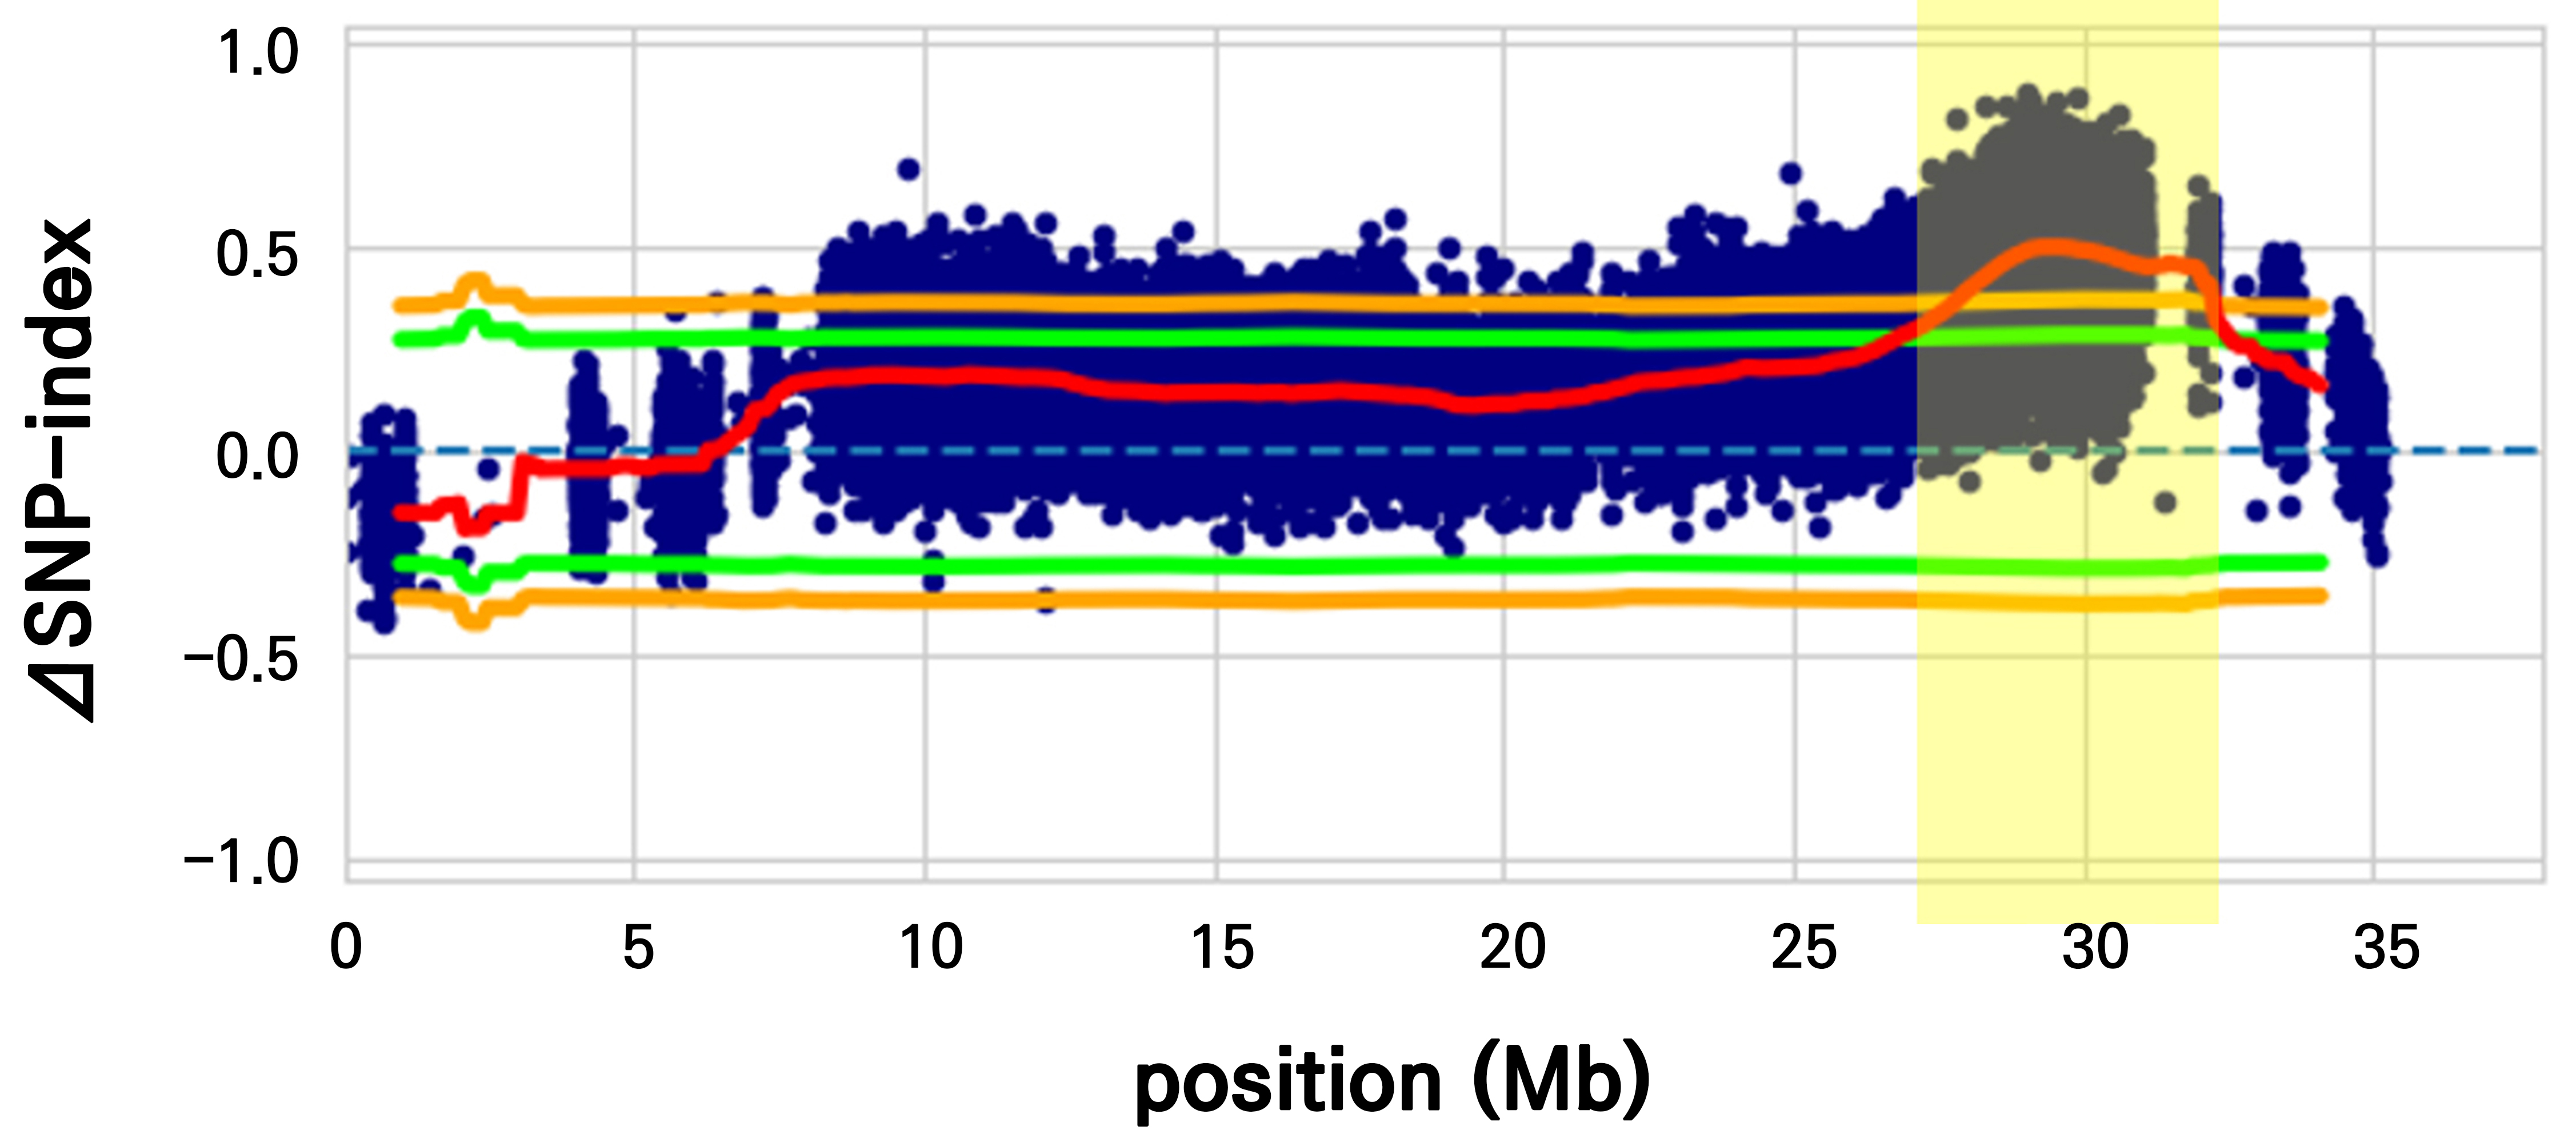
Fig. 2.
Identification of genomic regions associated with the female flowering index (FFI) on chromosome 5 via a BSA-seq analysis. The ΔSNP-index represents the difference in the SNP index between the high and low female flowering bulks. The red line indicates the ΔSNP-index, while the green and orange lines denote the significance thresholds at p < 0.05 and p < 0.01, respectively. Highlighted regions indicate candidate genomic intervals exceeding the significance thresholds.
Construction of the genetic linkage map and QTL detection
To delineate the chromosomal location of the major QTL more precisely, we constructed a high-density genetic linkage map using GBS-derived SNPs from the 178 F2 individuals. The high-density genetic linkage map was constructed using 266 high-quality SNP markers, which spanned a total genetic distance of 2,182.5 cM across eleven linkage groups with an average marker interval of 8.20 cM (Supplementary Table 2 and Supplementary Fig. 2). Linkage groups were assigned numbers corresponding to the physical chromosomes of the watermelon reference genome. Composite interval mapping (CIM) conducted on this map confirmed the presence of a single major QTL, designated as qFFI5.1, on chromosome 5 (Fig. 3). The qFFI5.1 locus was mapped to a physical interval of 28,661,474–28,955,946 bp. This locus exhibited a remarkably high LOD score ranging from 9.77 to 10.47, explaining a substantial proportion of the phenotypic variance (PVE). The identification of such a high-LOD QTL in a quantitative trait suggests that qFFI5.1 acts as a major genetic determinant.
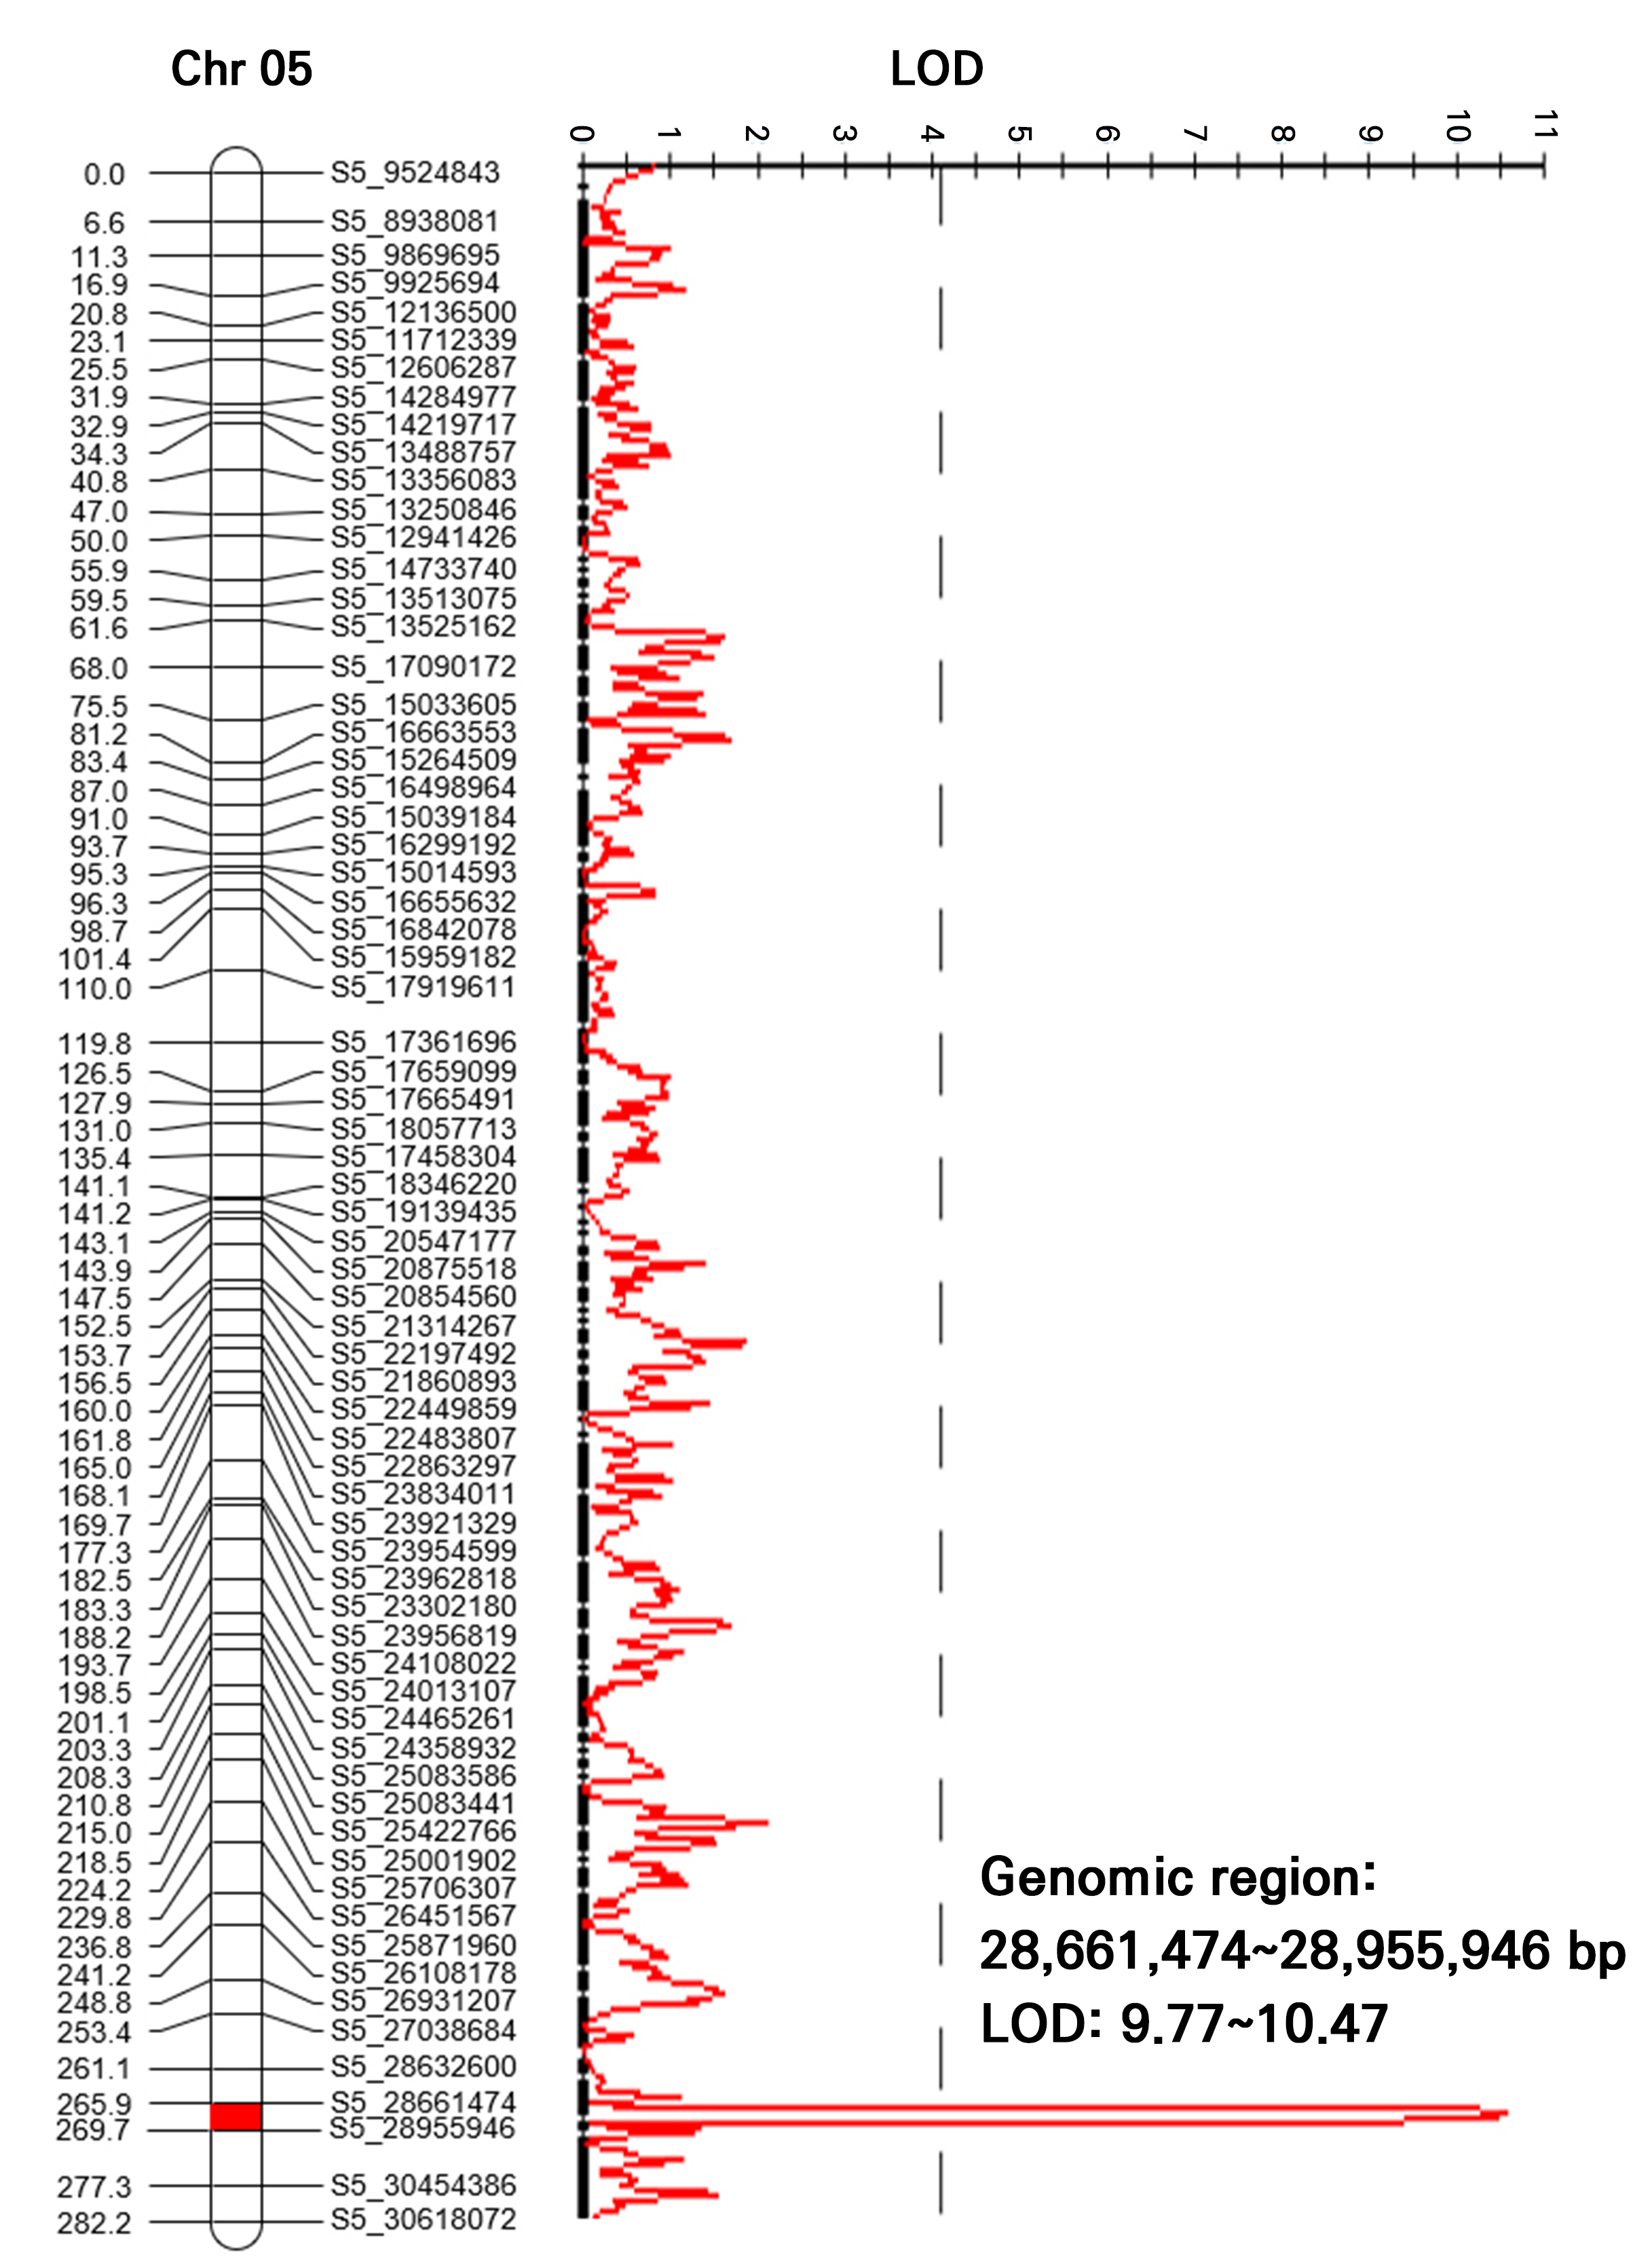
Fig. 3.
Major quantitative trait locus (QTL) for the female flowering index (FFI) identified on chromosome 5 according to GBS-based linkage mapping. A single major QTL associated with the female flowering index was detected on chromosome 5. The identified QTL has a physical interval ranging from 28,661,474 to 28,955,946 bp and exhibits LOD scores ranging from 9.77 to 10.47.
Validation and characterization of the qFFI5.1 locus using HRM markers
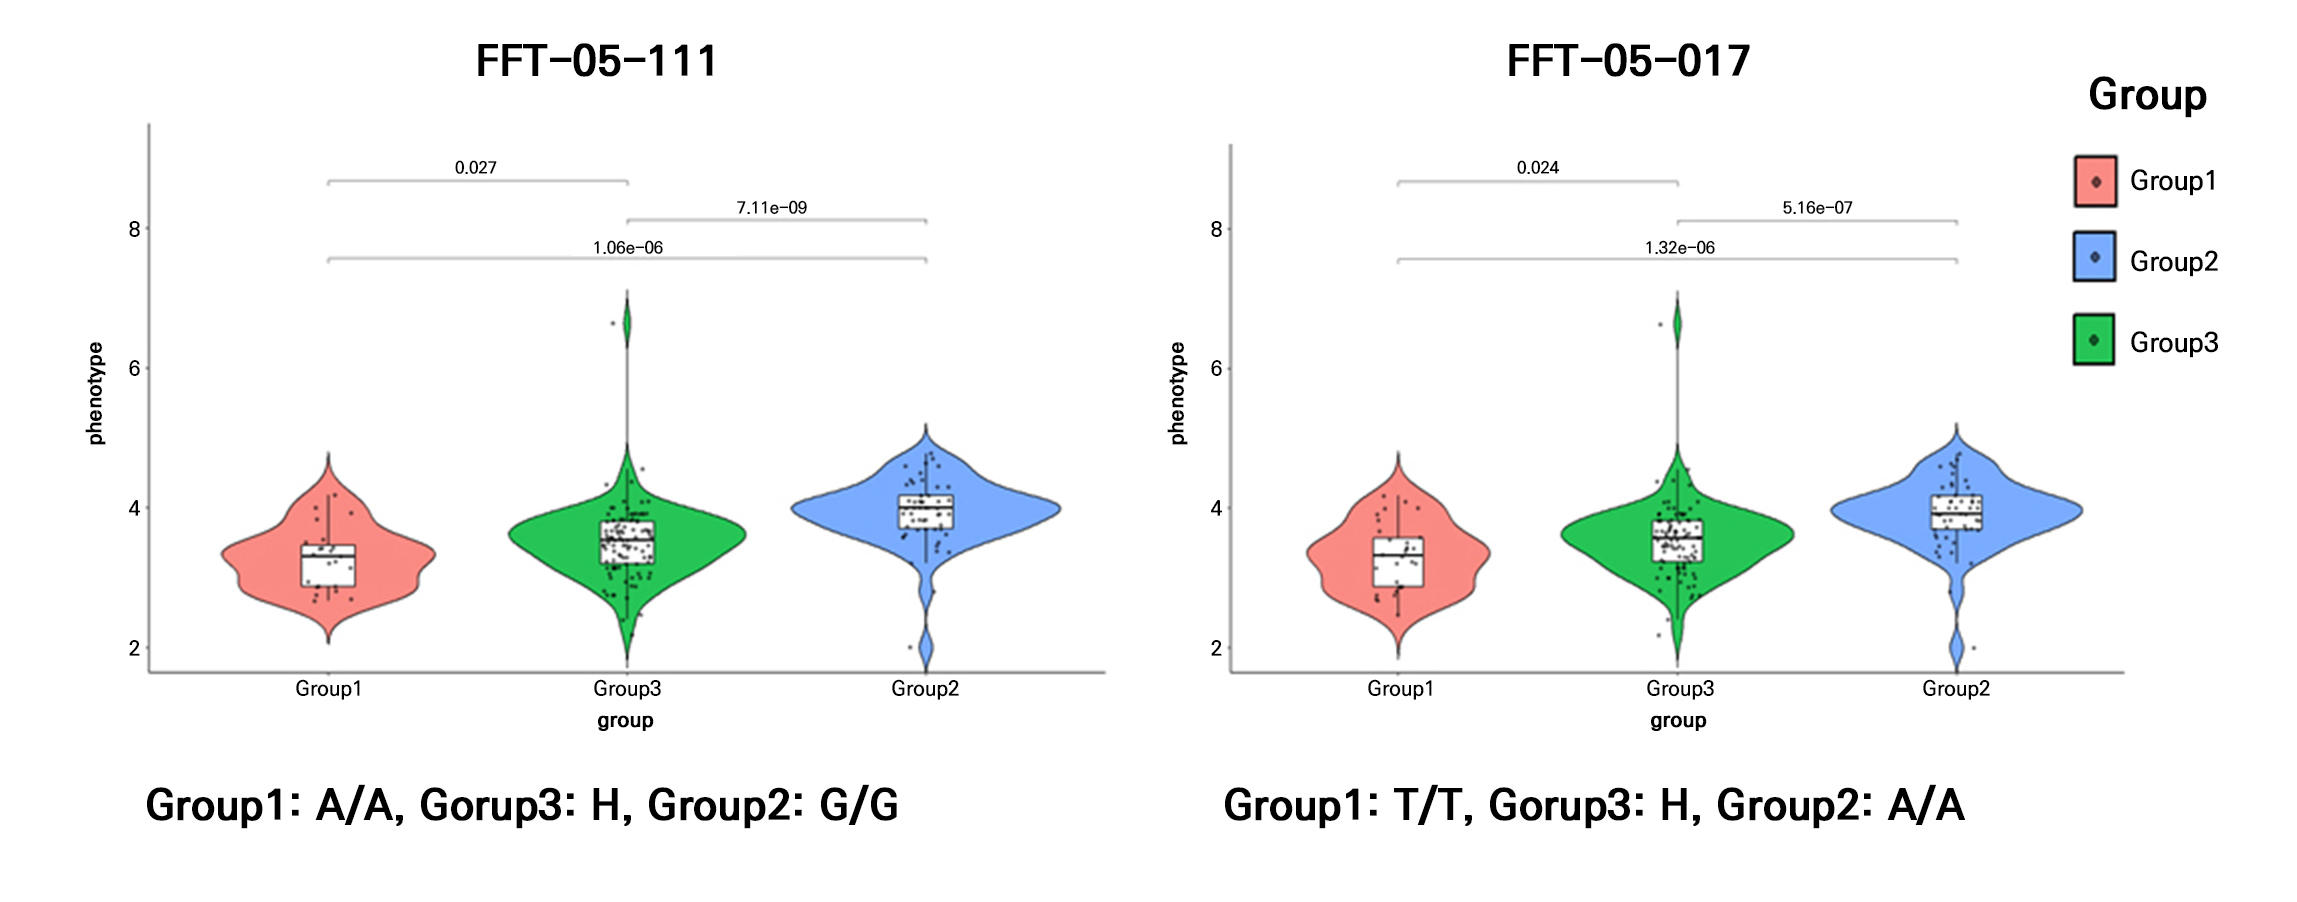
To validate the qFFI5.1 locus and develop practical breeding tools, we developed gene-based SNP markers within and around the candidate interval and genotyped the F2 population by means of a HRM analysis. The genotyping results revealed a strong correlation between the marker genotypes and FFI phenotypes (Table 2). Thirteen SNP markers located between 27.8 Mb and 30.8 Mb on chromosome 5 exhibited significant co-segregation with the phenotype (71.91–77.53%). Among them, the marker FFT-05-111 (28,386,111 bp) exhibited the highest co-segregation ratio of 77.53%, whereas marker FFT-05-017 (28,958,017 bp), located directly at the boundary of the mapped QTL peak, showed a similarly high ratio of 76.97%.
Table 2.
Co-segregation analysis of high-resolution melting (HRM) markers with the female flowering index (FFI) phenotype in the F2 population
To visualize the allelic effect of these key markers on the phenotype, we analyzed the distribution of FFI values according to the genotypes of FFT-05-111 and FFT-05-017 (Fig. 4). Violin plots demonstrated a clear separation of the FFI distributions among the three genotypic classes (Homozygous P1, Homozygous P2, and Heterozygous). Individuals homozygous for the ‘DAPFF01’ allele (HFFF genotype) consistently exhibited significantly lower FFI values compared to those homozygous for the ‘A0228’ allele (LFFF genotype) (p < 0.001, one-way ANOVA). The heterozygous class displayed intermediate FFI values, further supporting the additive inheritance pattern observed in the F1 generation. The distinct phenotypic clustering provided by these markers confirmed that the qFFI5.1 region on chromosome 5 contains the functional genetic element responsible for regulating the female flowering frequency in watermelon. Moreover, the high predictive accuracy of markers FFT-05-111 and FFT-05-017 suggests their immediate utility for MAS in breeding programs aimed at enhancing the yield potential.
Identification of candidate genes within the qFFI5.1 genomic region
Based on the physical position of the major QTL qFFI5.1 and the flanking HRM markers, we screened the genomic interval from 28.0 to 30.6 Mb on chromosome 5 for putative candidate genes using the watermelon reference genome annotation (Table 3). Within this region, we identified eleven candidate genes with functional annotations relevant to floral development, sex determination, and hormone signaling. Notably, two genes involved in the auxin signaling pathway, Cla97C05G099810 (encoding an auxin-responsive SAUR protein) and Cla97C05G099830 (encoding an auxin response factor), were located between 28.79 Mb and 28.83 Mb, directly corresponding to the peak LOD region of qFFI5.1. Additionally, the candidate interval harbored genes encoding transcription factors that have been previously implicated in flowering regulation in cucurbits. These included four MYB (Cla97C05G098900, Cla97C05G099690, Cla97C05G101190, and Cla97C05G101970), two MADS-box (Cla97C05G099940 and Cla97C05G102080), and three bHLH transcription factors (Cla97C05G100100, Cla97C05G101640, and Cla97C05G102260). Among these, Cla97C05G099690 (MYB) and Cla97C05G099940 (MADS-box) were positioned close to highly significant SNP markers, suggesting they are strong candidates regulating the female flowering frequency in watermelon.
Table 3.
List of putative candidate genes located within the qFFI5.1 target region (28.0–30.6 Mb) on Chromosome 5
| Location | Gene code | Gene name | Crop | Reference |
| Chr5: 28,068,180 ‒ 28,069,210 | Cla97C05G098900 | Transcription factor MYB36-like | Cucurbita pepo | Segura et al. 2024 |
| Chr5: 28,688,638 ‒ 28,693,115 | Cla97C05G099690 | Myb_DNA-bind_3 domain-containing protein | Cucurbita pepo | Segura et al. 2024 |
| Chr5: 28,796,828 ‒ 28,797,730 | Cla97C05G099810 | Auxin responsive SAUR protein | Cucumis Sativus | Martínez and Jamilena 2021 |
| Chr5: 28,824,303 ‒ 28,829,866 | Cla97C05G099830 | Auxin response factor | Cucumis Sativus | Martínez and Jamilena 2021 |
| Chr5: 28,895,423 ‒ 28,899,267 | Cla97C05G099940 | MADS box transcription factor | Cucumis Sativus | Ando et al. 2001 |
| Chr5: 29,043,105 ‒ 29,046,041 | Cla97C05G100100 | Transcription factor bHLH110-like isoform X1 | Cucumis Sativus | Pawełkowicz et al. 2019 |
| Chr5: 29,824,110 ‒ 29,824,781 | Cla97C05G101190 | Transcription factor MYB44-like | Cucumis Sativus | Segura et al. 2024 |
| Chr5: 30,194,774 ‒ 30,195,448 | Cla97C05G101640 | BHLH transcription factor | Cucumis Sativus | Pawełkowicz et al. 2019 |
| Chr5: 30,426,409 ‒ 30,427,239 | Cla97C05G101970 | MYB transcription factor | Cucurbita pepo | Martínez and Jamilena 2021 |
| Chr5: 30,471,445 ‒ 30,472,271 | Cla97C05G102080 | Agamous-like MADS-box protein | Cucumis Sativus | Ando et al. 2001 |
| Chr5: 30,575,728 ‒ 30,577,555 | Cla97C05G102260 | Transcription factor bHLH139-like | Cucumis Sativus | Pawełkowicz et al. 2019 |
Discussion
Watermelon (C. lanatus L.) is among the most widely consumed and economically significant crops globally. Female flowering capacity is a key trait that directly influences crop yields. Plant reproductive systems are categorized based on the spatial distribution of sexual organs; species bearing separate pistillate (female) and staminate (male) flowers on the same individual are classified as monoecious, whereas those exclusively producing female or male flowers are defined as gynoecious or androecious, respectively (Martínez and Jamilena 2021). As members of the Cucurbitaceae family, watermelon exhibits a typical monoecious sexual system in which male and female flowers develop independently on the same plant (Anankul et al. 2024). Although flowering-related traits are subject to environmental influences, their determination is fundamentally governed by intricate interactions among multiple genes.
In the present study, we characterized the genetic basis of the FFI using an F2 population derived from a cross between HFFF and LFFF parental lines. The phenotypic distribution of FFI followed a normal curve with transgressive segregation, confirming that the female flowering frequency is a quantitative trait controlled by multiple genetic factors. Despite this polygenic trait, the combination of BSA-seq and GBS-based linkage mapping allowed us to identify a single major QTL, qFFI5.1, located on chromosome 5 (28.6–28.9 Mb). This locus exhibited a high LOD score (9.77–10.47), suggesting that while FFI is quantitative, qFFI5.1 acts as a major genetic determinant explaining a substantial proportion of the phenotypic variance. These findings align with general quantitative genetics principles, according to which major effect loci often orchestrate complex traits alongside minor modifiers, a phenomenon frequently observed in relation to agronomic traits such as flowering times and fruit yields (Katuuramu et al. 2023).
Notably, the genomic location of qFFI5.1 is distinct from the previously identified major sex determination loci in watermelon and other cucurbits. The andromonoecious (a) gene, CitACS4, which controls the presence of a stamen in female flowers, is located on chromosome 3 (Manzano et al. 2016). Similarly, the gynoecious (gy) gene, ClWIP1, which represses carpel development, is located on chromosome 6 (Zhang et al. 2020). Furthermore, QTLs associated with flowering time are typically mapped to chromosomes 2 and 3 (McGregor et al. 2014). The identification of qFFI5.1 on chromosome 5, suggests the existence of a novel regulatory pathway that specifically modulates the frequency or periodicity of female flower initiation nodes, distinct from the primary sex determination mechanisms that define the mere presence or absence of female organs. This implies that qFFI5.1 may be involved in the regulation of floral meristem identity or the sensitivity of meristem to hormonal signals that trigger female differentiation along the vine.
Annotation of the qFFI5.1 interval revealed several putative candidate genes relevant to floral development and hormonal signaling. The candidate region contained clusters of genes encoding MYB transcription factors (e.g., Cla97C05G098900 and Cla97C05G101190). In cucurbits, MYB transcription factors have been implicated in the regulation of sex expression, often acting upstream or downstream of ethylene signaling pathways (Zhang et al. 2014; Segura et al. 2024). Recently, it was reported with regard to Cucurbita pepo that the transcription factor CpMYB62 acts as a master regulator upstream of ethylene production, activating ethylene biosynthetic genes, and promoting female flower development (Segura et al. 2024). The clustering of MYB genes within the qFFI5.1 interval suggests that they play a similar regulatory role in watermelon, potentially by modulating the expression of sex-determining genes in response to developmental cues. Additionally, the region harbors auxin-responsive genes, including auxin-responsive SAUR proteins and auxin response factors (ARFs). Auxin is a well-documented feminizing hormone in cucurbits and is known to promote female flower development often via cross-talk with ethylene biosynthesis. The presence of these genes supports the hypothesis that qFFI5.1 influences FFI by altering local auxin sensitivity or signal transduction efficiency in the developing floral buds. MADS-box transcription factors located in this region also remain plausible candidates given their fundamental role in floral organ specification and development (Ando et al. 2001; Li et al. 2019). However, further functional validation, such as expression profiling or gene editing, is required to identify causal genes among these candidates.
HRM analysis offers a closed-tube, post-PCR method for SNP discrimination that is both cost-effective and high-throughput (Jeong et al. 2025). The HRM markers developed in this study, specifically those targeting SNPs at 28.3 Mb (FFT-05-111) and 28.9 Mb (FFT-05-017), demonstrated a co-segregation rate of approximately 72–77% with this phenotype. Although this value is lower than that typically expected for monogenic Mendelian traits, it is significant for quantitative traits such as FFI. Sex expression in cucurbits is notoriously plastic and sensitive to environmental factors such as the temperature and photoperiod, which can modulate the expression of sex-determining genes (Papadopoulou and Grumet 2005; Martínez and Jamilena 2021). The deviation from perfect co-segregation likely reflects this environmental plasticity as well as potential recombination events between the marker SNPs and the causal mutation. Despite these limitations, these markers have a substantial practical value for MAS. Using these markers, breeders can effectively enrich breeding populations for the HFFF trait at the seedling stage, thereby reducing the time and resources required for phenotypic evaluations in the field (Wang et al. 2019). In conclusion, this study identifies a novel major QTL, qFFI5.1, on chromosome 5 that regulates the female flowering frequency in watermelon and provides molecular tools to facilitate the breeding of cultivars with optimized fruit yield potential.
Conclusion
In conclusion, this study identified a novel major QTL, qFFI5.1, within a ~294 kb interval on chromosome 5 that governs female flowering frequency in watermelon, a key trait for fruit yield potential, using BSA-seq and high-density linkage mapping. Notably, qFFI5.1 is genetically distinct from the known sex determination loci, andromonoecious (a) on chromosome 3 and gynoecious (gy) on chromosome 6, suggesting an independent regulatory pathway for flowering node frequency. Candidate gene analysis revealed MYB transcription factors and auxin-responsive proteins, implicating hormonal crosstalk potentially distinct from or synergistic with established ethylene-mediated mechanisms. The flanking HRM markers, FFT-05-111 and FFT-05-017, demonstrated high co-segregation with the phenotype, providing an efficient tool for marker-assisted selection of high female flowering frequency at the seedling stage. Future functional characterization of candidate genes within qFFI5.1 will further elucidate floral developmental plasticity in Cucurbitaceae and inform genetic improvement strategies.
Supplementary Material
Supplementary materials are available at Horticultural Science and Technology website (https://www.hst-j.org).
- HST_20260002_Table_S1.pdf
Supplementary Table 1. Sequences of primers used for the high-resolution melting (HRM) analysis
- HST_20260002_Table_S2.pdf
Supplementary Table 2. Summary statistics of the genetic linkage map constructed using GBS-derived SNP markers
- HST_20260002_Fig_S1.pdf
Supplementary Fig. 1. Genome-wide distribution of the ΔSNP-index for female flowering index (FFI) across all eleven chromosomes in watermelon.
- HST_20260002_Fig_S2.pdf
Supplementary Fig. 2 Construction of the GBS-based genetic linkage map covering eleven linkage groups.
