

Introduction
Materials and Methods
Plant Materials
DNA and RNA Extraction and cDNA Synthesis
Linkage Mapping and Cosegregation Analysis
Cloning and Sequencing of TAGL1
Expression Analysis of TAGL1
Pigment Extraction and High-Performance Liquid Chromatography (HPLC) Analysis
Results
Mapping the gs Locus Controlling the Green-Striped Phenotype
Cloning and Sequencing of TAGL1
Cosegregation Analysis for the gs Locus and the Green-Striped Phenotype
Association Analysis between Green-Striped Fruit and TAGL1
Carotenoid and Chlorophyll Analysis in Peel Tissues of LA3682 by HPLC
Expression Analysis of TAGL1 in the Peel Tissues of LA3682
Discussion
Introduction
Tomato (Solanum lycopersicum) has been extensively bred to improve productivity, resistance to biotic and abiotic stresses, and fruit quality (Kimura and Sinha, 2008). Fruit quality is determined by various characteristics such as nutritional value, taste, flavor, and fruit color (Ho, 2002). Fruit color is an important component of fruit appearance, and considerable attention has been directed toward its characterization (Koskitalo and Ormrod, 1972). Various coloration patterns, such as yellow, orange, brown, and green-striped, are preferred by consumers and attract animals, facilitating seed dispersion (Kang et al., 2017).
Fruit color is regulated by various transcription factors that are responsible for fruit ripening. Some transcription factors participate upstream of ethylene-mediated and -independent ripening regulatory pathways that directly and indirectly regulate the expression of numerous ripening-related genes (Giovannoni, 2007). Two transcription factors, RIPENING INHIBITOR (RIN) (Vrebalov et al., 2002; Fujisawa et al., 2013) and NON-RIPENING (NOR) (Wang et al., 2018) are master regulators that control fruit ripening by ethylene-dependent and -independent pathways. Mutations of NOR and RIN block ethylene perception and inhibit fruit ripening, resulting in yellow or orange fruit color (Mizrahi et al., 1975; Osorio et al., 2011; Fujisawa et al., 2012). The overexpression of TOMATO AGAMOUS-LIKE 1 (TAGL1) results in fruits with enhanced lycopene (Itkin et al., 2009). SlNAC48 and SlNAC19 belong to NAM, ATF1/2, and CUC2 (NAC) transcription factor families bind to the promoter of ethylene biosynthesis genes and influence their expression and promote fruit ripening (Kou et al., 2016). SlAP2a belongs to the APETALA 2/Ethylene Responsive Factor (AP2/ERF) transcription factor family and negatively regulates fruit ripening by modulating the climacteric ripening hormone, ethylene, and carotenoid pigmentation (Chung et al., 2010). SlERF6 negatively regulates ethylene and carotenoid accumulation during fruit ripening (Lee et al., 2012). These ripening-related transcription factors confer various patterns of fruit coloration. High expression levels of lycopene β-cyclase (CYC-B) increase the accumulation of β-carotene in tomato fruit during ripening, resulting in orange fruit color. The brown fruit color is due to the loss of function of STAY-GREEN (SGR) with concurrent high expression levels of CYC-B (Manoharan et al., 2017). The pink fruit color is due to the absence of the yellow-colored flavonoid naringenin chalcone. This is caused by deregulated expression of SlMYB12, a transcription factor gene regulating the flavonoid pathway (Ballester et al., 2010). The purple fruit color results from the combination of different alleles of Anthocyanin fruit (Aft) and atroviolacea (atv), which are responsible for anthocyanin biosynthesis. Homozygotes (AftAft/atvatv) have increased anthocyanin biosynthesis in the peel, resulting in purple colored skin (Blando et al., 2019). Various fruit coloration patterns and their associated DNA markers have been used in tomato breeding (Kang et al., 2017; Shin et al., 2019; Vu and Lee, 2019; Kang and Lee, 2020).
The striped-fruit phenotype is an attractive coloration pattern widely used in tomato breeding. Irregular and longitudinal green stripes are visible on the epidermis of immature and mature green-striped tomato fruit (Zamir et al., 1984; Farinha et al., 2009). Longitudinal stripes appear on many fruits such as watermelons, melons, pumpkins, pears, and squashes (Zhai et al., 2019). Melon fruit stripes are conferred by a single dominant gene that has not yet been accurately identified (Liu et al., 2019). In pears, demethylation of the PyMYB10 promoter induces anthocyanin accumulation resulting in red-striped pigmentation (Qian et al., 2014). In apples, methylation of the MdMYB10 promoter induces differential accumulation of anthocyanins, resulting in red and yellow stripes (Telias et al., 2011). However, the molecular mechanisms underlying stripe formation in tomato has not been fully elucidated.
The green-striped phenotype in tomato is controlled by the green stripe (gs) locus. gs was described as a single recessive gene (Rick and Butler, 1956) and was localized to the short arm of chromosome 7 (Rick and Yoder, 1988). Recently, the gs candidate gene was identified as TAGL1 and the green-striped phenotype was found to be regulated by hypermethylation at the TAGL1 promoter (Liu et al., 2020). Identification of the gs candidate gene is crucial to the application of marker-assisted selection for breeding for the green-striped phenotype. We mapped the gs candidate gene and developed a molecular marker for marker-assisted selection for tracing green-striped fruits in tomato.
Materials and Methods
Plant Materials
S. lycopersicum ‘LA3682’ and S. lycopersicum ‘Miniheuksu’ produce green-striped fruits. S. pimpinellifolium ‘LA1589’, S. lycopersicum ‘IL7-2’ and S. lycopersicum ‘M82’ produce non-green-striped fruits. LA3682 was crossed with LA1589 and Miniheuksu was crossed with IL7-2 to produce F2 populations for linkage and cosegregation analysis. A total of 118 non-green-striped lines and 11 green-striped lines were used for the association study between the DNA marker and the striped-fruit phenotype. These tomato seeds were obtained from the Tomato Genetic Resource Center (UC Davis, CA, USA) and the National Agro Biodiversity Center (Rural Development Administration, Jeonju, Korea). Seeds of ‘Kaedilrak’ and Miniheuksu were obtained from Asia Seed Co., Ltd., Seoul, Korea. Seeds of ‘Tiger’ were obtained from Samsung Seed Co., Ltd., Pyeongtaek, Korea. All plants were grown in the greenhouse at Kyungpook National University, Daegu, Korea.
DNA and RNA Extraction and cDNA Synthesis
The genomic DNA was extracted from leaves of all plants using the cetyltrimethylammonium bromide method (Murray and Thompson, 1980). The fruit peels of mature green (MG) or red ripe (RR) stages were isolated and immediately frozen with liquid nitrogen and ground to a fine powder for carotenoid and RNA extractions. Green-striped peels (GSP) and light-green peels (LGP) in the MG fruit of LA3682, and yellow-striped peels (YSP) and red peels (RP) in the RR fruit of LA3682 were sampled for RNA extraction. Total RNA was extracted using a Ribospin Seed/Fruit Kit (GeneAll Biotechnology Co., Ltd., Seoul, Korea) from the peel of M82 and LA3682. cDNA was synthesized with DiaStar RT Kit (SolGent Co., Ltd., Daejeon, Korea) following the manufacturer’s instructions.
Linkage Mapping and Cosegregation Analysis
The linkage map of the green-striped phenotype was constructed with eight insertion/deletion (InDel) markers and one derived cleaved amplified polymorphic sequences (dCAPS) marker (m021) on chromosome 7 (Suppl. Table 1s). The dCAPS marker was developed in reference to the recently described study (Liu et al., 2020). The green-striped phenotype and genotypes of the F2 population were compared to construct the linkage map using MAPMAKER/EXP 3.0 (Lander et al., 1987). A total of 351 F2 individuals from the cross between LA3682 and LA1589, and a total of 97 F2 individuals from the cross between Miniheuksu and IL7-2, were used for cosegregation analysis of the green-striped phenotype. PCR was conducted using a T100 Thermal Cycler (Bio-Rad Laboratories, Inc., Hercules, CA, USA.) with 150 ng of each DNA template and 10 pmol of forward and reverse primers. PCR conditions were 95°C for 3 min, followed by 35 cycles of 95°C for 30 s, the respective annealing temperature for 30 s, and 72°C for 5 min. For the association analysis, we used two dCAPS markers, m021 and m022. PCR products of m021 and m022 were digested with EcoRI (New England Biolabs, Ltd., Ipswich, MA, USA) for 3 h, and SspI (New England Biolabs, Ltd., Ipswich, MA, USA) for 16 h, respectively, at 37°C in 10 µL reactions containing 5 µL of the PCR product, 1 µL of the buffer, 0.3 µL of the enzyme (10 units/mL), and 4.7 µL of distilled water. Digested DNA products were electrophoresed in a 2% agarose gel.
Cloning and Sequencing of TAGL1
The promoter, introns, and coding region of TAGL1 in LA3682 and M82 were cloned and sequenced. The primers used for cloning are described in Suppl. Table 1s. The amplified fragments were cloned with T-blunt vector (T-Blunt PCR Cloning Kit, SolGent Co., Ltd.) following the manufacturer’s instructions, and transformed into Escherichia coli (DH5α). Plasmid DNA was isolated using an MG Plasmid DNA MiNi Kit (MGmed Co., Ltd., Seoul, Korea.), and three clones each were sequenced at Solgent Co., Ltd., Daejeon, Korea.
Expression Analysis of TAGL1
qRT-PCR was conducted with 100 ng of the cDNA and specific primers for TAGL1 (Suppl. Table 1s) using the Power SYBR Green PCR Master Mix (Applied Biosystems, Waltham, MA, USA), following the manufacturer’s instructions. qRT-PCR was conducted with three biological and two technical replicates. ACTIN was used to normalize the relative expression of TAGL1. qRT-PCR was conducted using a CFX Connect Real-Time PCR Detection System (Bio-Rad Laboratories, Inc., Hercules, CA, USA). The reaction conditions were as follows: 95°C for 10 min, 40 cycles of 95°C for 15 s and 60°C for 1 min, followed by the melting curve of 95°C for 10 s, 60°C for 5 s, 95°C for 5 s, and 22°C for 5 s.
Pigment Extraction and High-Performance Liquid Chromatography (HPLC) Analysis
Pigments were extracted from 100 mg of frozen powder from GSP, LGP, YSP, and RP tissues of LA3682 as previously described (Yoo et al., 2017).
Results
Mapping the gs Locus Controlling the Green-Striped Phenotype
The peel tissue of LA3682 fruit is distinguished by GSPs and LGPs before maturity, and becomes YSPs and RPs, respectively, during ripening (Fig. 1A). The green-striped phenotype in LA3682 is only observed in the peel tissue, not in the endocarp (Fig. 1B) (Rick and Butler, 1956). We used 351 F2 individuals derived from a cross between LA3682 and LA1589 to map the gs locus (Fig. 2A). Eight InDel markers (Suppl. Table 1s) were developed based on the genome sequence of LA1589 (Tomato Genome Consortium, 2012). gs was localized between the m009 and m016 markers (Fig. 2C).
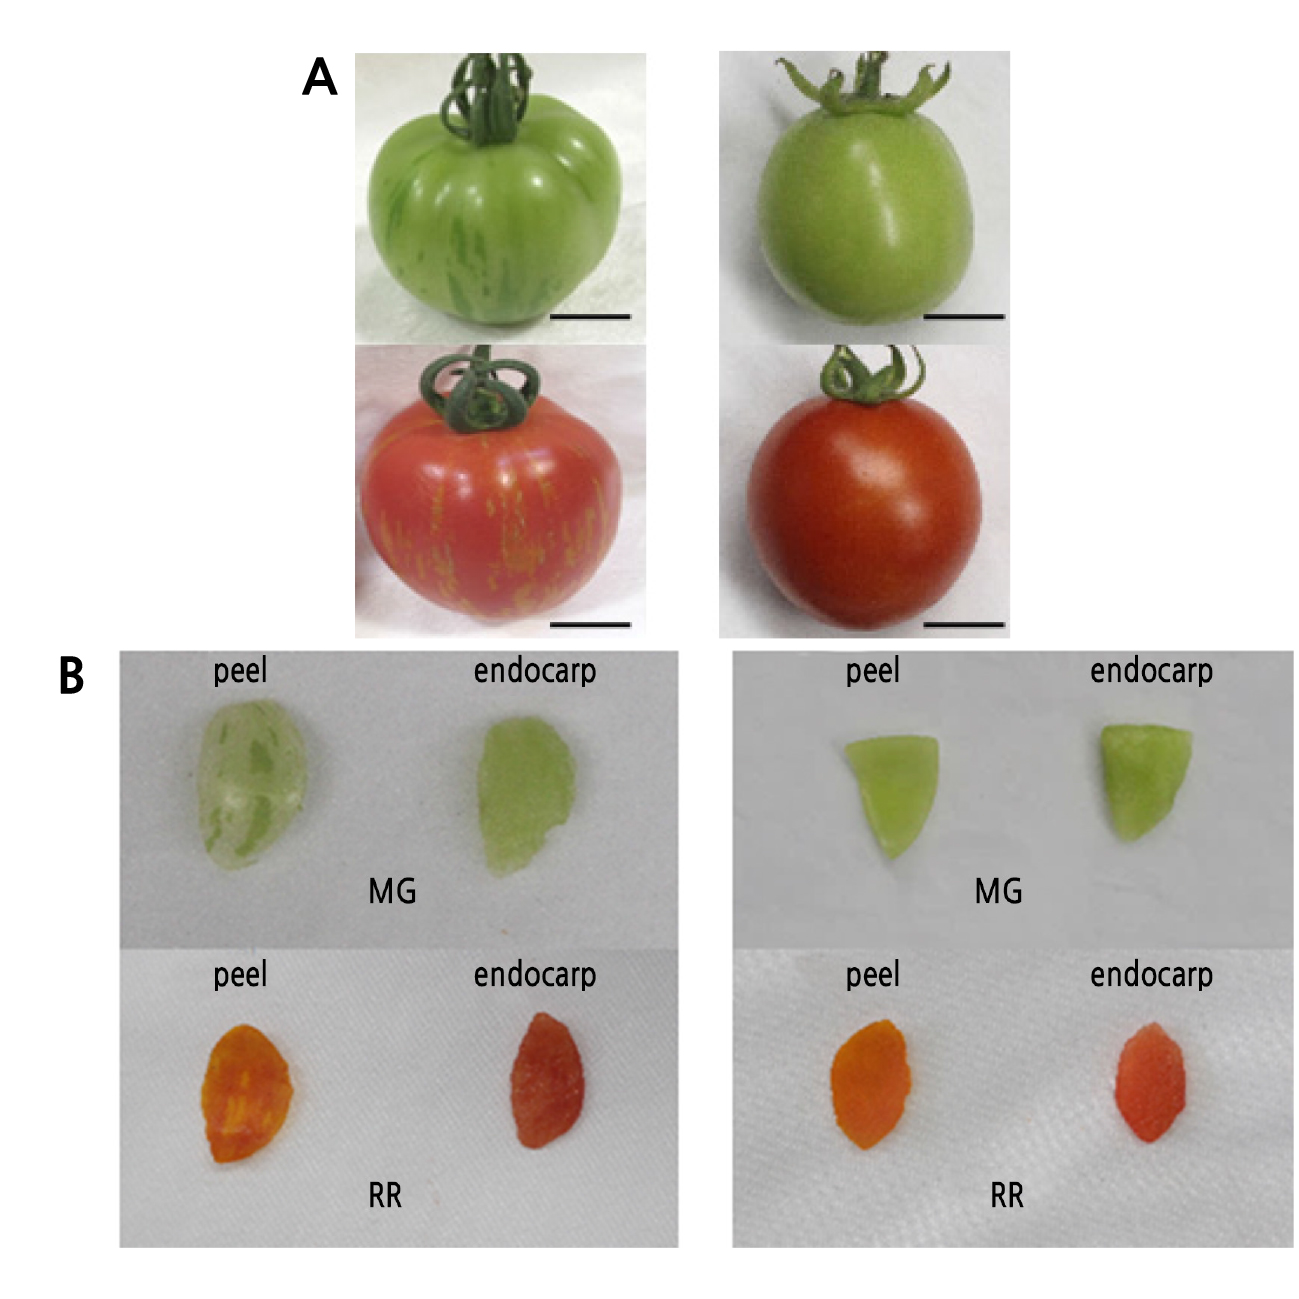
Fig. 1.
Phenotypes of the green-striped fruit. (A) S. lycopersicum ‘LA3682’ (left) and S. lycopersicum ‘M82’ (right) fruits of mature green (MG, top) and red ripe (RR, bottom) stages. Ripe fruits were harvested 15 days after the breaker stage. The scale bars indicate 1 cm. (B) Isolated peels and endocarps of LA3682 (left) and M82 (right) fruits of mature green (top) and red ripe (bottom) stages.
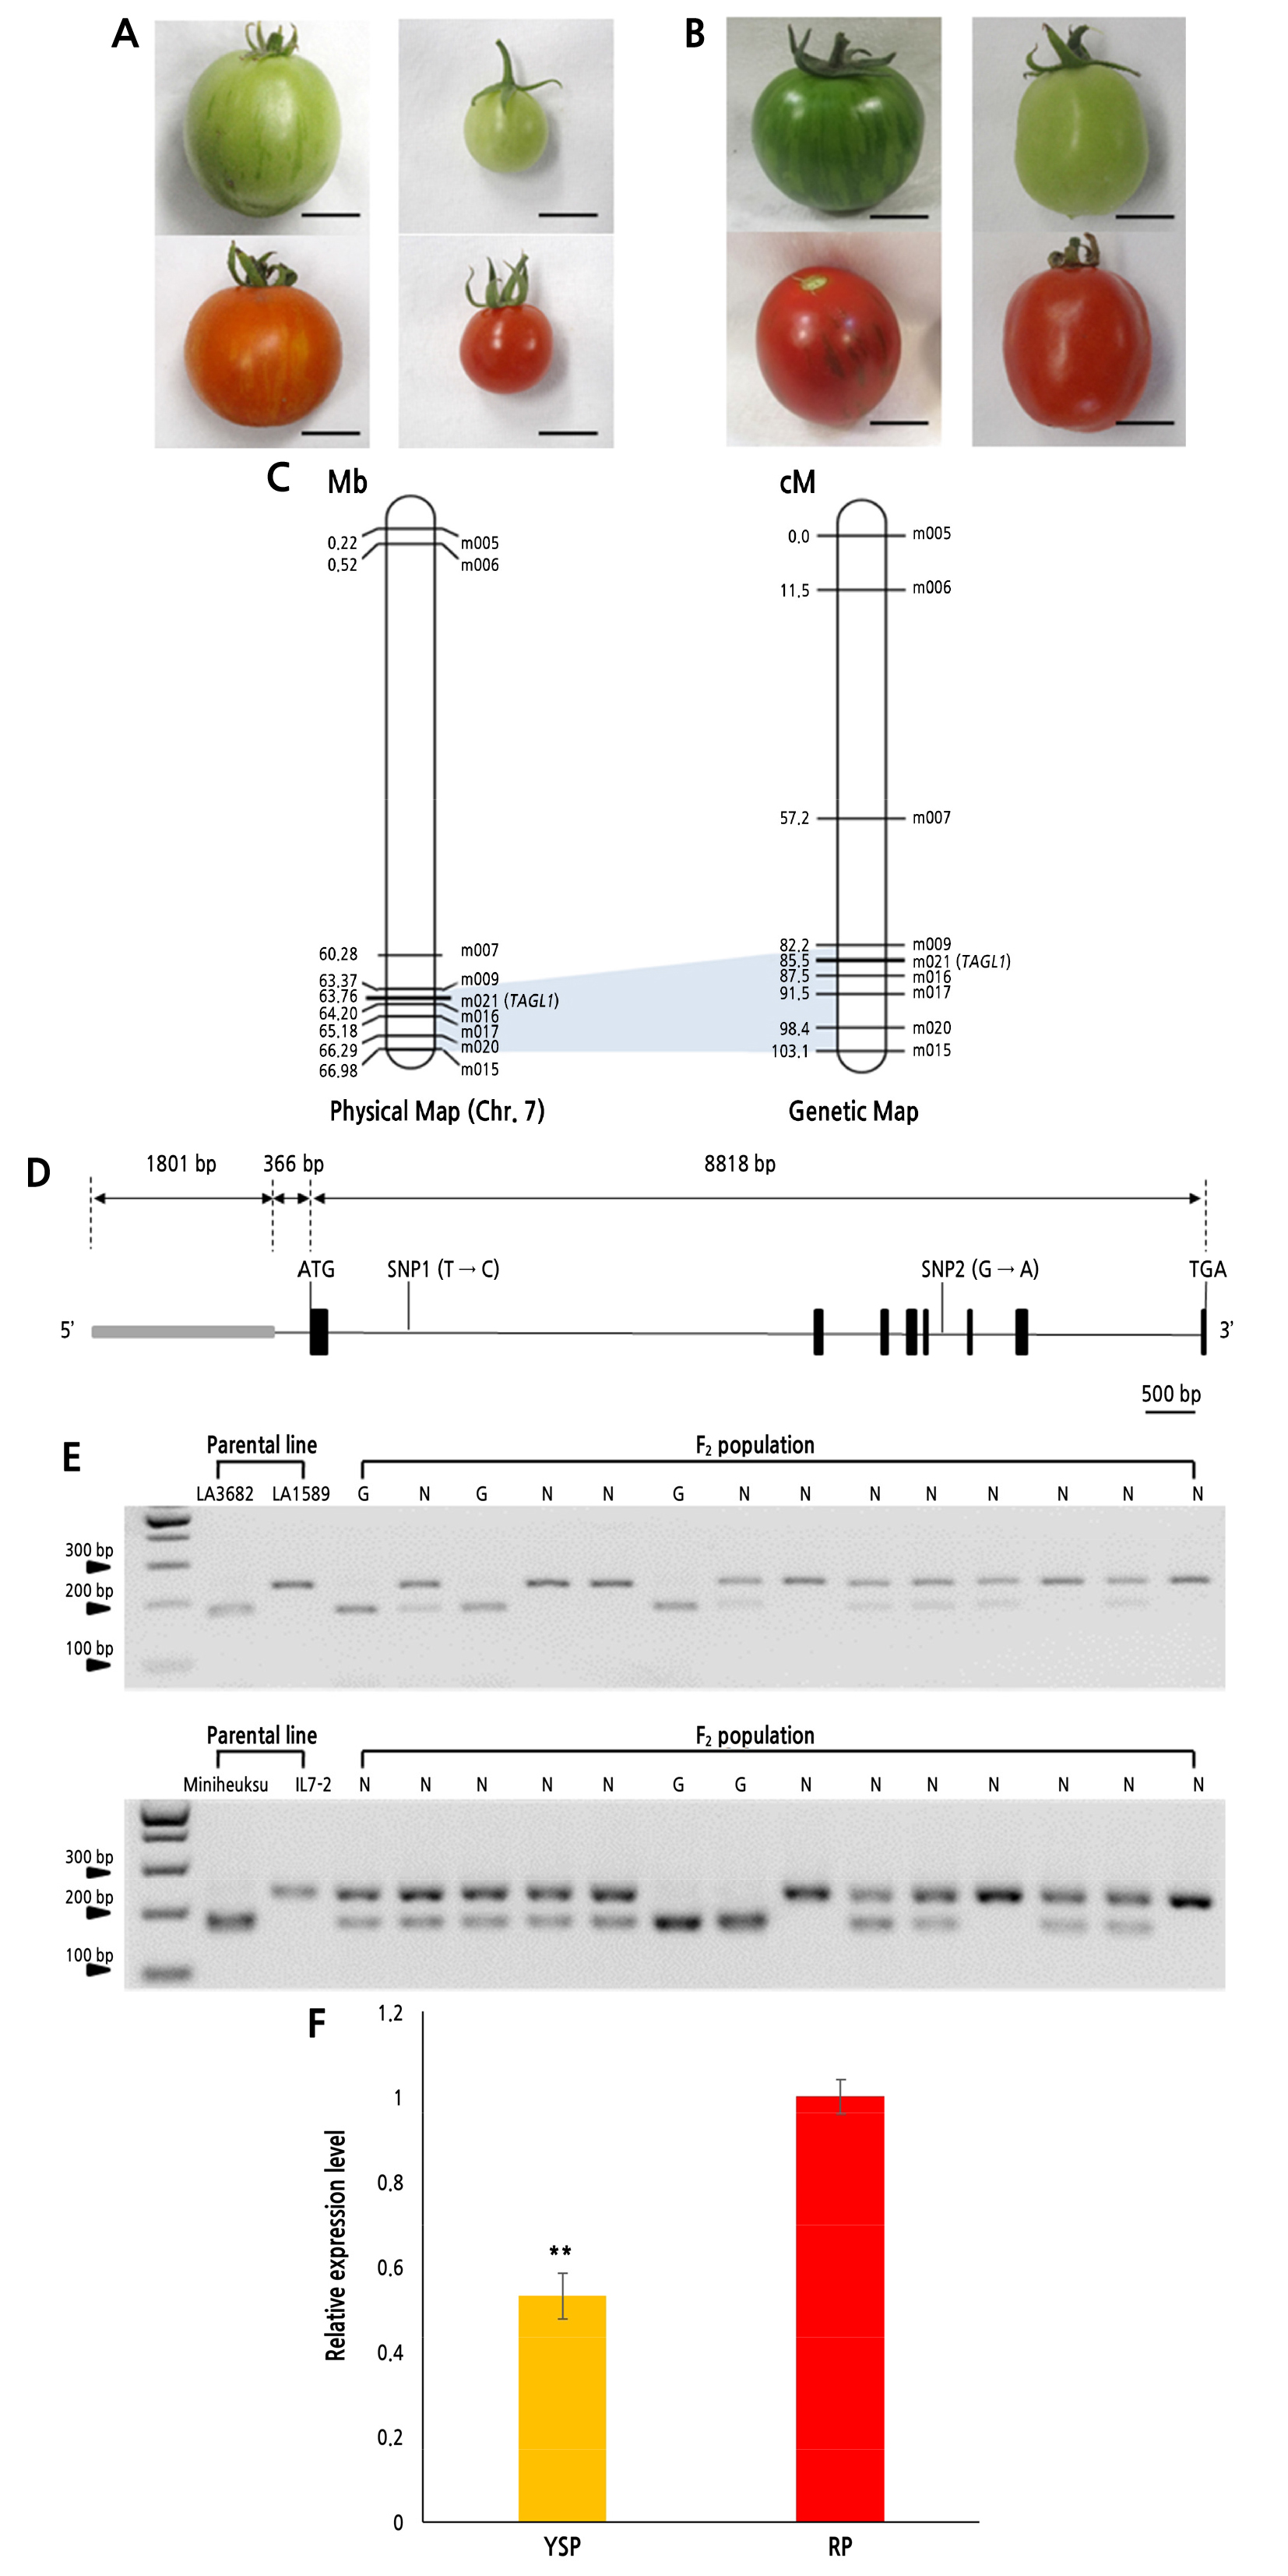
Fig. 2.
Genetic mapping and cosegregation analysis of the gs locus. (A) Fruits of S. lycopersicum ‘LA3682’ (left) and S. pimpinellifolium ‘LA1589’ (right) in mature green (upper) and red ripe (lower) stages. (B) Fruits of S. lycopersicum ‘Miniheuksu’ (left) and S. lycopersicum ‘IL7-2’ (right) in mature green (upper) and red ripe (lower) stages. (C) Physical map (left) and genetic map (right) of the gs locus on chromosome 7. The LA3682 × LA1589 F2 population was used to construct the map. (D) Schematic representation of the genomic structure of TAGL1. A gray box indicates the promoter (1,801 bp) and black boxes indicate the coding region (8,818 bp). Thin lines indicate introns. The SNPs are located on the first and fifth intron. The scale bar indicates 500 bp. (E) Cosegregation analysis of TAGL1 using 351 F2 individuals from the cross between LA3682 and LA1589 (upper), and 97 F2 individuals from the cross between Miniheuksu and IL7-2 (lower). G: green stripe, N: non-green stripe. (F) Relative expression levels of TAGL1 in YSP and RP tissues of LA3682 (15 days after the breaker stage) using qRT-PCR (n=3). ACTIN was used for normalizing the expression level. The expression level of TAGL1 in RPs was approximately 2-fold higher than that in YSPs. Double asterisks indicate a significant difference at p < 0.01 by t-test (n=3).
Cloning and Sequencing of TAGL1
TAGL1 was recently identified as the candidate gene of the gs locus (Liu et al., 2020). To identify genetic variations associated with the green-striped phenotype, we cloned and sequenced the gDNA and cDNA of TAGL1 in two S. lycopersicum lines, LA3682 and M82. The coding region sequences of the two lines were identical in the promoter, whereas two single nucleotide polymorphisms (SNPs), SNP1 (T to C) and SNP2 (G to A), were observed in the first and fifth introns, respectively, in the gDNA (Fig. 2D). These SNPs were further used for marker development (Fig. 2E).
Cosegregation Analysis for the gs Locus and the Green-Striped Phenotype
A dCAPS marker, m021, based on SNP1, was used in the cosegregation analysis. A total of 351 F2 individuals from the cross between LA3682 and LA1589 segregated into 92 homozygotes (-/-) and 174 heterozygotes (-/gs) that produced non-green-striped fruit, and 85 homozygotes (gs/gs) with green-striped fruit (Fig. 2E). For the F2 population from the cross between Miniheuksu and IL7-2 (Fig. 2B), 107 F2 individuals segregated into 19 homozygotes (-/-) and 54 heterozygotes (-/gs) that produced non-green-striped fruit, and 34 homozygotes (gs/gs) with green-striped fruit (Fig. 2E). A total of 97 fruit (63 non-green-striped and 34 green-striped individuals) in the F2 population derived from a cross between Miniheuksu and IL7-2 were used to evaluate the segregation ratio for the phenotype. The green-striped phenotype segregated in the F2 population with a Mendelian ratio of 3:1 (Table 1). These results reconfirmed that the gs candidate gene is a single recessive gene. In addition, we demonstrated the high gene specificity of the m021 marker through a perfect match between the phenotype and genotype in all individuals.
Table 1.
Segregation of the gs genotype and the green-striped phenotype from two F2 populations. A total of 351 F2 individuals were derived from a cross between Solanum lycopersicum ‘LA3682’ and S. pimpinellifolium ‘LA1589’. A total of 97 F2 individuals were derived from a cross between S. lycopersicum ‘Miniheuksu’ and S. lycopersicum ‘IL7-2’
Association Analysis between Green-Striped Fruit and TAGL1
We conducted an association analysis between green-striped fruit and the gs candidate gene, TAGL1, with various tomato lines (Fig. 3A). Two dCAPS markers, m021 and m022, based on SNP1 and SNP2, respectively (Fig. 2D), were used to genotype 11 green-striped lines and 118 non-green-striped lines (Table 2). Only m021 was completely associated with the fruit phenotype and able to distinguish all the tomato lines (Fig. 3).
Table 2.
Various tomato lines used in this study
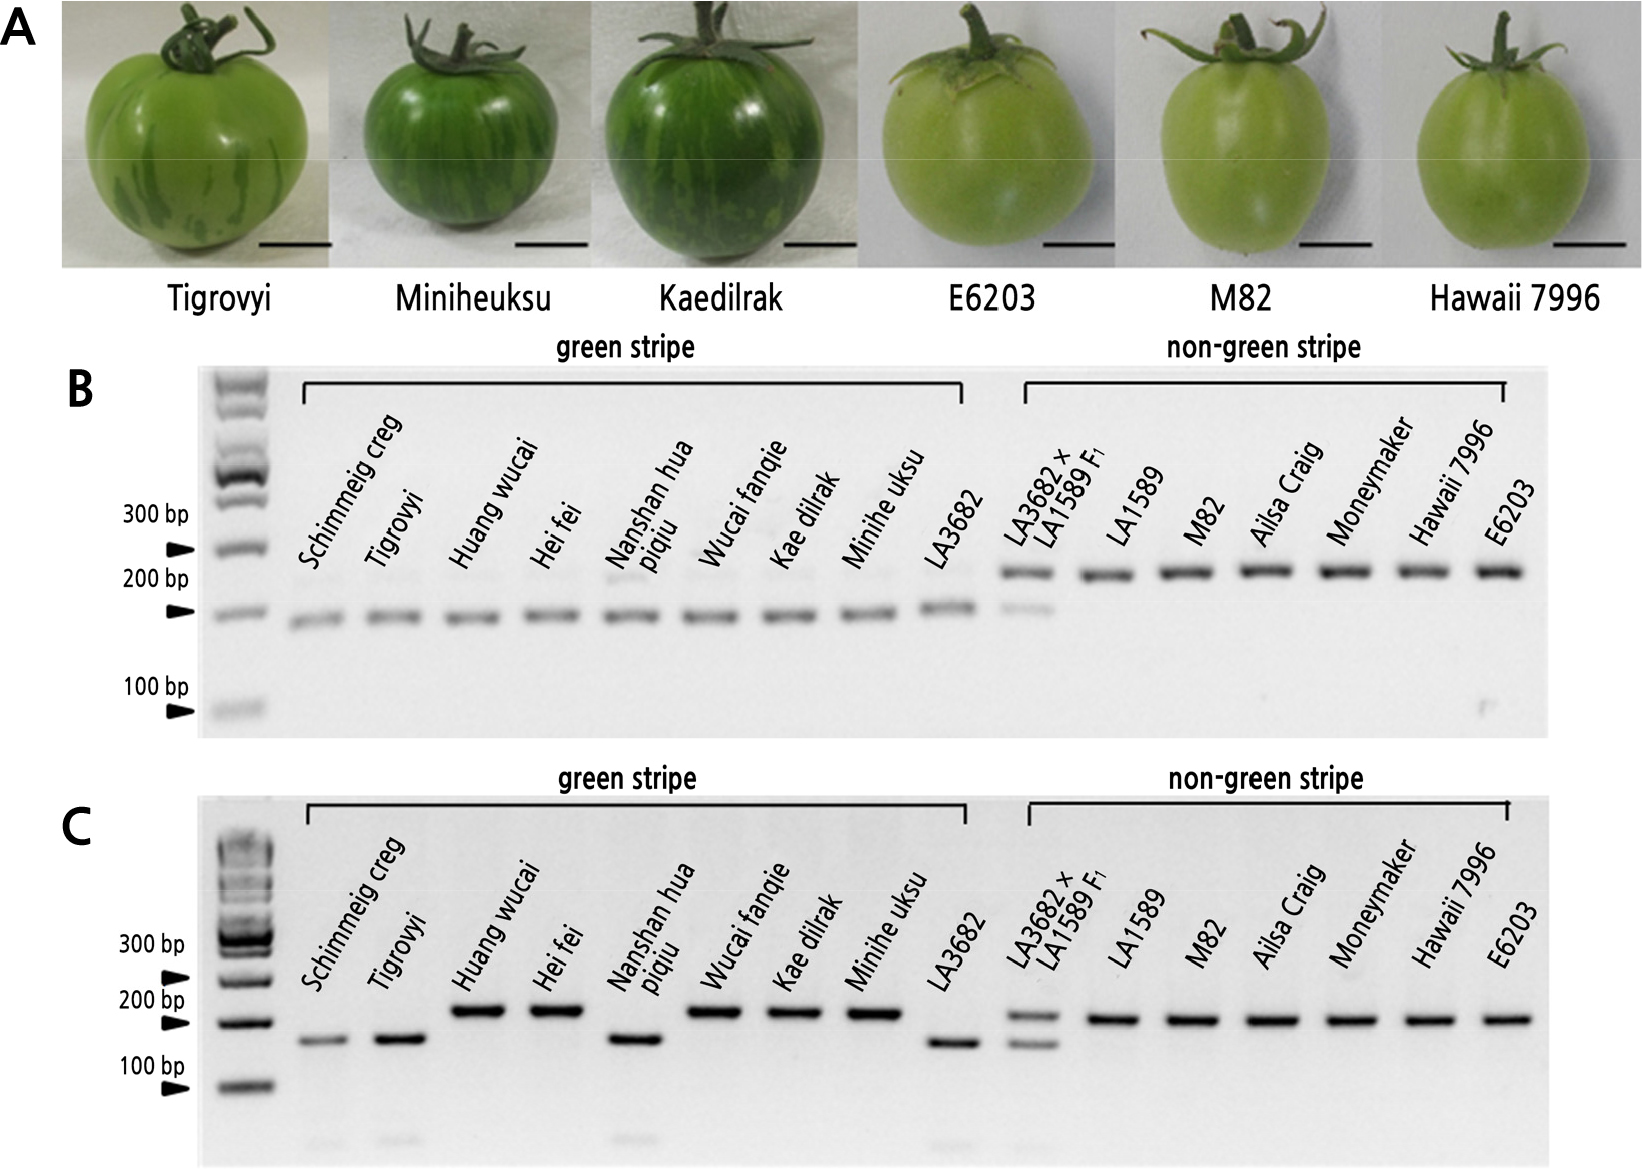
Fig. 3.
TAGL1 was associated with the green-stripe phenotype in various tomato lines. (A) Lines with green-striped fruit (Tigrovyi, Miniheuksu, and Kaedilrak) and non-green-striped fruit (E6203, M82, and Hawaii 7996). (B) The association analysis between the gs candidate gene and green-striped fruit utilizing the TAGL1-specific dCAPS marker ‘m021’ based on SNP1 at the first intron of TAGL1. (C) The association analysis between the gs candidate gene and green-striped fruit utilizing a dCAPS marker ‘m022’ based on SNP2 at the fifth intron of TAGL1. Only the m021 marker was able to distinguish the phenotype in all lines.
Carotenoid and Chlorophyll Analysis in Peel Tissues of LA3682 by HPLC
We analyzed the carotenoid and chlorophyll contents in the peel tissues of LA3682 using HPLC (Table 3). GSPs and LGPs were isolated from MG fruit and YSPs and RPs were isolated from RR fruit. The levels of chlorophyll a and chlorophyll b were higher in GSPs compared to LGPs. The levels of lutein and β-carotene were higher in GSPs compared to LGPs. Phytoene, phytofluene, and trans-lycopene were not detected in the green tissues. Except for lutein, the levels of all detected carotenoids were higher in RPs compared to YSPs. The levels of phytoene and phytofluene were approximately two-fold higher in RPs than in YSPs. The level of trans-lycopene was approximately three-fold higher in RPs than in YSPs. The level of β-carotene was slightly higher in RPs than in YSPs. The level of lutein was two-fold lower in RPs than in YSPs.
Table 3.
Quantification of carotenoids and chlorophyll (µg/g fresh weight) in the green-striped fruit (LA3682) by HPLC analysis. The amounts of carotenoids and chlorophylls are averages of three biological replicates ± standard error
| Phytoene | Phytofluene | Lutein | β-carotene | trans-lycopene | Chlorophyll b | Chlorophyll a | |
| GSP | 0.3 ± 0.15 | ND | 14.79 ± 1.40** | 16.59 ± 0.94** | ND | 10.67 ± 0.52** | 10.99 ± 2.79* |
| LGP | ND | ND | 4.28 ± 0.21 | 6.43 ± 0.26 | ND | 5.58 ± 0.47 | 2.08 ± 1.43 |
| YSP | 47.72 ± 2.36 | 23.99 ± 1.16 | 7.00 ± 0.38** | 51.65 ± 2.14 | 25.45 ± 0.35 | ND | ND |
| RP | 98.25 ± 14.06*z | 48.71 ± 6.73* | 3.19 ± 0.15 | 65.97 ± 3.45* | 72.49 ± 8.81* | ND | ND |
Expression Analysis of TAGL1 in the Peel Tissues of LA3682
We analyzed the expression of TAGL1 in the YSPs and RPs of LA3682 (Fig. 2F) and found that TAGL1 expression was significantly reduced in YSPs compared to RPs.
Discussion
The gs locus was previously localized to the short arm of chromosome 7 of the tomato genome (Rick and Yoder, 1988). However, our mapping result showed that gs is located on the long arm of chromosome 7 between markers m009 and m016 (Fig. 2C). We applied an additional dCAPS marker (m021) (Liu et al., 2020) to our mapping analysis. m021 was located on the physical map at SL4.0ch07_63760487, based on the tomato reference genome (Tomato Genome Consortium, 2012), at the same location as TAGL1.
TAGL1, a MADS-box transcription factor, is responsible for various functions in fruit development and ripening (Vrebalov et al., 2009). In particular, TAGL1 functions as a negative regulator of chlorophyll accumulation in immature fruit and a positive regulator of carotenoid biosynthesis in ripe fruit (Itkin et al., 2009). Based on these functions, TAGL1 was predicted to be the candidate gene of the gs locus.
We analyzed the TAGL1 sequences in LA3682 and M82 and did not find any mutations in the promoter and coding regions of either line. However, SNP1 and SNP2 were found in the first and fifth intron sequences, respectively. Two dCAPS markers based on these SNPs were used for the association analysis between TAGL1 and the green-striped fruits. The green-striped phenotype did not entirely match with the SNP2 genotype while SNP1 was completely associated with the phenotype in all lines (Fig. 3). Therefore, SNP1 can be utilized in marker-assisted selection for the green-striped trait. Our cosegregation analysis for TAGL1 and the green-striped phenotype using two different F2 populations further demonstrated the efficacy of our SNP1 marker (Fig. 2E).
We measured the carotenoid and chlorophyll contents in the GSP, LGP, YSP, and RP tissues of LA3682 fruit (Table 3). As expected, chlorophyll accumulation was promoted in the GSP, and the carotenoid level was downregulated in the YSP compared to the RP. We also conducted expression analysis of TAGL1 using qRT-PCR (Fig. 2F). YSP and RP tissues of LA3682 exhibited a clear distinction in TAGL1 expression, with significantly reduced expression in the YSP and an approximately two-fold higher expression level in the RP. These results corresponded with the pigment analysis results. Hypermethylation of the TAGL1 promoter was recently reported as the major determinant of TAGL1 downregulation (Liu et al., 2020). Here, we highlighted the relationship between TAGL1 expression (Fig. 2F) and carotenoid contents (Table 3) in ripening fruits, and improved marker-assisted selection for tomato cultivars using the TAGL1-specific marker (Fig. 3 and Table 2).
In summary, we identified the location of the gs candidate gene, TAGL1, which controls the development of green stripes in the peels of tomato, through linkage mapping. The chlorophyll contents were higher in GSPs, and carotenoid contents were lower in YSPs. These results corresponded with the low expression level of TAGL1 in YSPs and the high expression level of TAGL1 in the RPs. This may explain the underlying genetic mechanism of green stripes in tomato fruit peels, which turn to yellow stripes during ripening. Although marker-assisted selection is used extensively in tomato breeding for disease resistance (Lee et al., 2015), the use of DNA markers to improve fruit quality is limited. The TAGL1-specific marker will be useful for selection of the fruit stripe trait in tomato breeding.
Supplementary Material
Supplementary materials are available at Horticultural Science and Technology website (https://www.hst-j.org).
- HORT_20210036_Table_1s.pdf
Sequences of primers used in all experiments
