

Introduction
Materials and Methods
Plant Material
Genetic Analysis
DNA Isolation
BSA-seq Analysis
HRM Analysis
Allele-specific PCR
Linkage Analysis and Fine Mapping
Search for Genomic Sequences and Transcript Numbers
Results and Discussion
Phenotypic Observation and Inheritance of Genic Male Sterility
Whole-genome Resequencing and Mapping
Identification of a Candidate Male Sterility-Related Genomic Region
Development of Male Sterility-Related SNP Markers and Fine Mapping
Putative Male Sterility Locus, Cla97C06G117840
Introduction
Watermelon (Citrullus lanatus, 2n=2x=22) is an economically important species of the Cucurbitaceae family with a yearly production of more than 100 million tons worldwide (http://faostat. fao.org). It is a popular summer fruit owing to its physical (i.e., sweet taste, high water content) and chemical (i.e., lycopene and beta-carotene content) properties (Maoto et al., 2019).
Most watermelon cultivars are F1 hybrids that are produced via emasculation and hand pollination. Male sterility is a useful trait for plant breeding programs because it accelerates hybrid breeding and production by skipping the emasculation step (Zhang et al., 1996; Hexun et al., 1998; Zhang et al., 2012; Wei et al., 2021). Male sterility can be distinguished as genic or nuclear male sterility (GMS), cytoplasmic male sterility (CMS), and cytoplasmic-genic male sterility (Kumar et al., 2000; Mohammad and Ali, 2009; Wang et al., 2020). Of these, GMS is controlled by abnormal nuclear gene expression in the male organ at the developmental stage and is inherited by a recessive gene; however, it is hard to maintain pure male sterile lines using self-pollination. The pollination of sterile male lines (msms) and heterozygous male fertile lines (Msms) can only lead to 1:1 male-sterile: male-fertile mixed populations (Horner and Palmer, 1995; Wan et al., 2019). Several male sterility systems have been developed in vegetable crops related to staminal, functional, and positional sterility (Mishra and Kumari, 2018). Previous studies have investigated various male-sterile mutants in watermelon such as the glabrous male sterile (gms) line (Watts, 1962, 1967; Ray and Sherman, 1988), spontaneous male-sterile lines (ms-1, ms-2, and ms-3) (Dyutin and Sokolov, 1990; Zhang and Wang, 1990; Bang et al., 2005), line DAH3615-MS (ms-1) (Rhee et al., 2015), the male-sterile dwarf (ms-dw) line (Hexun et al., 1998), and the spontaneous mutant Se18 (Wei et al., 2021); however, the underlying mechanisms of male sterility remain unclear.
Next-generation sequencing (NGS) is a rapid and valuable sequencing method that provides genomic information (Ruangrak et al., 2018). In addition, to elucidate genetic loci linked to a specific trait, NGS-based bulked segregant analysis (BSA) approaches, such as BSA-seq methods; QTL-seq (Takagi et al., 2013), MutMap (Abe et al., 2012), and progressed high-performance MutMap and QTL-seq (Sugihara et al., 2020), are useful for accurately mapping genes in plant species (Jang et al., 2019; Wen et al., 2019; Jang et al., 2020; Vogel et al., 2021; Wang et al., 2021).
In this study, we aimed to identify candidate genomic regions for male sterility in watermelon using BSA-seq and develop a single nucleotide polymorphism (SNP)-based marker linked to GMS using high-resolution melting (HRM) analysis.
Materials and Methods
Plant Material
We developed two populations: 1) an F2 population (F2, n = 81) from the male-sterile line CAUms-1 (msms) and the male-fertile line IT190143 (MsMs) that was used for BSA-seq, testing SNP markers, and linkage mapping, and 2) a near-isogenic line (NIL) population (n = 86) from a BC6F1 between lines DAH (Msms) and DAH3615-MS (msms) for validating SNP marker applicability. Both CAUms-1 and DAH3615-MS lines were derived from the Chinsese male-sterile line (ms-1) (Zhang and Wang, 1990). IT190143 line was obtained from the gene bank of the National Agrobiodiversity Center (NAC), Rural Development Administration (RDA), Jeonju, South Korea. The F2 and NIL populations were planted in the greenhouse of Chung-Ang University (Anseong, S. Korea), for phenotypic evaluation of all nodes with male flowers.
Genetic Analysis
Inheritance analysis for male sterility and fertility was performed in the two populations. The goodness-of-fit between the expected and the observed segregation ratio was tested using the chi-square test.
DNA Isolation
Genomic DNA was isolated from leaf tissues of the four parental lines and each plant of the two populations using a modified sodium dodecyl sulfate method (Kim et al., 1997). DNA quality and quantity were confirmed by 1.2% agarose gel electrophoresis and the 260/280 and 260/230 ratios using the DeNovix DS-11 spectrophotometer (DeNovix, Wilmington, DE, USA). The amount of double-stranded DNA was detected using the Quant-iT™ kit, according to the manufacturer’s instructions (Thermo Fisher Scientific, Waltham, MA, USA).
BSA-seq Analysis
We selected 20 plants with the male fertility (MF) phenotype and 20 with the male sterility (MS) phenotype from the F2 population and pooled 5 µg DNA from each individual to create MF bulk and MS bulk, respectively. The two bulks and parental lines were sequenced using the Nextseq 500 System (Illumina, San Diego, CA, USA). The sequencing depths were estimated at 30×. The resulting ‘fastq’ files were processed using FastQC (Wingett and Andrews, 2018), and sequencing adapter sequences were removed using Trimmomatic ver. 0.39. (Bolger et al., 2014). The trimmed and filtered high-quality paired reads were aligned with the Watermelon (97103) v2 Genome (Guo et al., 2019) using the Burrows-Wheeler Alignment (BWA ver.0.7.17-r1188) with the mem option (Li and Durbin, 2009). Inaccurate paired reads were filtered, sorted, and indexed using ‘samtools’ (Li et al., 2009). BCFtools was used to generate variant call format (VCF) with the ‘mpileup’ command (Li, 2011). The VCF was filtered for sequencing depth > 30×, minor allele frequency > 0.01, and sequencing missing rate < 10%. The accuracy and proportion of filtered SNPs were implemented based on the parental genomes using the SNP index, which is the ratio of alternative sequence to read depth (Takagi et al., 2013). The ΔSNP index was calculated as the genomic difference between MS bulk and MF bulk and filtered by homo-SNPs in the fertile parent IT190143. A plot was created using the QTL-seq package of R (Core Team, 2020) with a 2.0-Mb window size and 10-kb step size. Positive, high ΔSNP index values were assumed to represent the MS-related regions (Sugihara et al., 2020). The parental lines were sequenced using the same platform to avoid interference in ascertaining the SNP index and to accurately design PCR primers for the detection of SNPs and indels analysis (Jang et al., 2020). For visualization of the genomic sequences, Tablet software (ver. 1.12) (Milne et al., 2013) was used.
HRM Analysis
A genomic region with a high-value ΔSNP index was considered to include a significant QTL for which SNP-based primer sets were designed using Primer3 (Rozen and Skaletsky, 2000). HRM analysis was performed using the LightCycler 96 platform (Roche, Mannheim, Germany). The reaction volume of 10 µl contained 2 ng dsDNA, 1× LightCycler 480 High-Resolution Melting master (Roche), 0.5 µM of each primer, and 3 mM MgCl2. The thermal conditions were as follows: 55 cycles at 94°C for 30 sec, 60°C for 30 sec, and 72°C for 30 sec. The final melting condition followed the high-resolution melting default setting condition.
Allele-specific PCR
An allele-specific PCR (AS-PCR) was used to detect a small deletion of 10 bp. The reaction volume of 20 µl contained 2 ng dsDNA, 5× PhireTM reaction buffer, 125 µM of each dNTP, 200 nM of each primer, and 0.5 µl PhireTM Hot Start DNA polymerase (Thermo ScientificTM). The thermal conditions were as follows: 94°C for 3 min, then 38 cycles of: 94°C for 15 sec, 72°C for 30 sec, and final extension at 72°C for 3 min. A total of 10 µl of PCR products were loaded on a 2.0% agarose gel for electrophoresis imaged on BiO-Rad ChemiDoc imaging system.
Linkage Analysis and Fine Mapping
Based on molecular marker genotyping results analyzed by HRM and AS-PCR analysis, the variant for each individual was assigned to two alleles such as the AA (MF) /Aa (MF, but hemizygote) /aa (MS) genotypes by comparing to the male-flower phenotypes of the F2 populations. The genotyping data of the F2 population from 8.9 to 13.0 Mbp of chromosome (Chr.) 6 were generated using seven HRM markers for detecting SNPs (HRM6-1 to -7) and one AC-PCR marker for deletion (AS6-1), which were used for linkage analysis using JoinMap v5.0 software (https://www.kyazma.nl/ index.php/JoinMap). Linkage map distance was analyzed by the Kosambi mapping function (Kosambi, 2016), represented as centimorgans (cM) and the physical distance. Cosegregation of each marker with phenotype was presented as a discrepancy for 81 F2 individuals. In addition, a newly designed HRM marker instead of the AS6-1 marker for detecting the genomic deletion was used for validation of the MS phenotype of the 86 individuals in the NIL population.
Search for Genomic Sequences and Transcript Numbers
Based on the information of the candidate genomic region postulated by evaluation of SNP and AS-PCR markers, the corresponding transcript was determined on the reference watermelon genome (97103 v2) of Cucurbit Genomes Database (CuGenDB; http://cucurbitgenomics.org/).
Results and Discussion
Phenotypic Observation and Inheritance of Genic Male Sterility
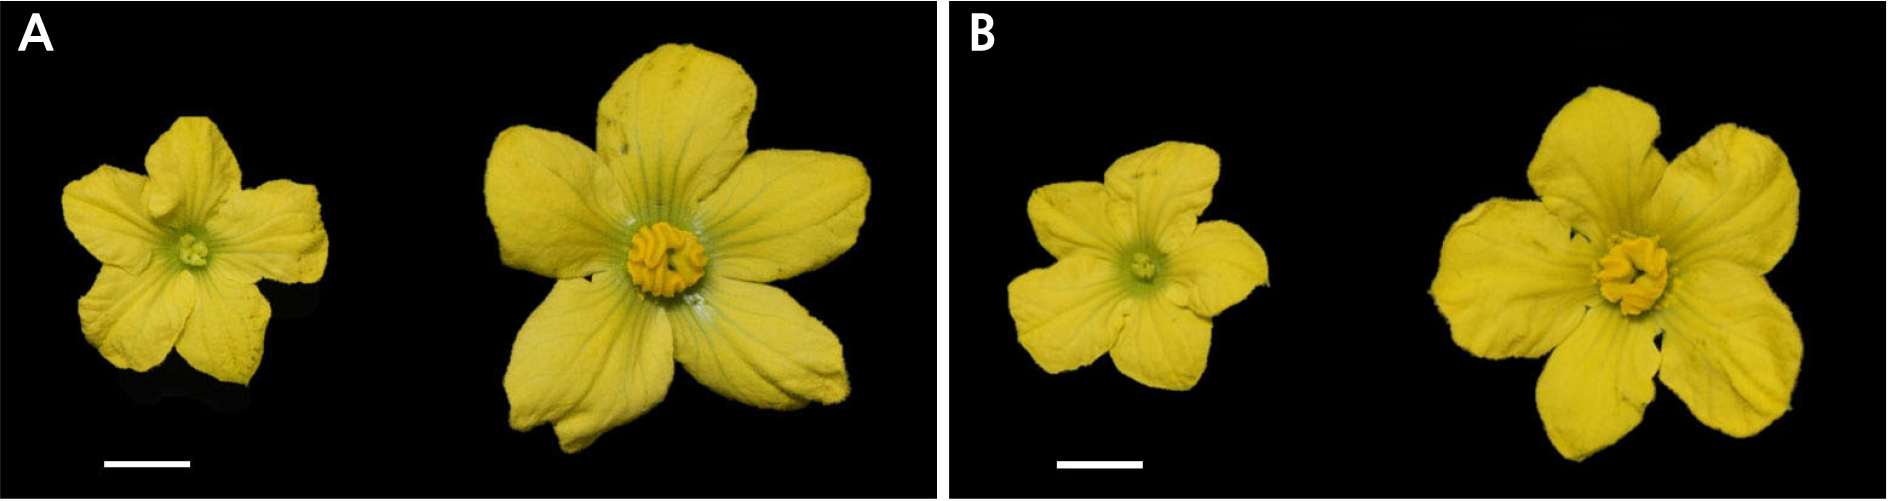
Phenotypic data for male flower traits were collected from parental lines, and the F2 and NIL populations. DAH3615-MS (Fig. 1A left) and CAUms-1 (Fig. 1B left) had a male sterility phenotype, which showed immature stamens, non-viable pollen, and smaller flowers compared to those of wild types, similar as previously reported for the ms-1 mutant (Zhang and Wang, 1990; Rhee et al., 2015, 2017). In contrast, DAH and IT190143 had a male fertility phenotype. No significant differences were identified in female flowers among the progeny from the two populations.
The Mendelian inheritance of male sterility was evaluated using a chi-square test (α = 0.05). It showed that the ratio of male fertility (MsMs and Msms): sterility (msms) was 3:1 in the F2 population (p = 0.2511). In the NIL population, the segregation ratio of male fertility (Msms): sterility (msms) was 1:1 (p = 0.2059). Thus, we assumed that male sterility was controlled by a single recessive gene in CAUms-1 and DAH3615-MS (Table 1).
Table 1.
Flower phenotyping and chi-square test results of the F2 population (CAUms-1 × IT190143, n = 82) and backcross population (DAH × DAH3615-MS, n = 90) for male sterility
| Population information | Flower phenotype | Observed (o) | Expected (e) | X2 | p-valuez |
|
F2 population (CAUms-1 × IT190143) MF:MS = 3:1 | MF | 57 | 61.5 | 1.3 | 0.2511 |
| MS | 25 | 20.5 | |||
|
Backcross population (DAH × DAH3615-MS) MF:MS = 1:1 | MF | 51 | 45 | 1.6 | 0.2059 |
| MS | 39 | 45 |
Whole-genome Resequencing and Mapping
The whole-genome resequencing and mapping statistics are presented in Table 2. The number of generated total reads was > 80 million each for MS bulk and MF bulk, and the properly paired-mapping rate was > 84% when aligned to the reference watermelon genome (Guo et al., 2019). The mean depth for all covered regions with high-quality reads was > 20×, which is considered sufficient for comparing BSA bulks at the genome level (Abe et al., 2012; Park et al., 2018; Jang et al., 2020).
Table 2.
Whole-genome resequencing and mapping statistics of parental lines and the two bulks of male-sterile (MS) and male-fertile (MF) plants
Identification of a Candidate Male Sterility-Related Genomic Region
The resulting number of genomic variants between MS bulk and MF bulk from the F2 population were 377,332, and were subsequently filtered using IT190143 as a reference to calculate the SNP index (Takagi et al., 2013; Itoh et al., 2019). When we simulated an average ΔSNP index in a 2.0-Mb interval using a 10-kb increment sliding window, we could determine a detailed genomic region for male sterility, which is located at 8.9–13.0 Mb on Chr. 6 (ΔSNP index = 0.75–0.92; p < 0.01) (Fig. 2 and Suppl. Fig. 1s). Since this BSA-seq approach includes the parental line as a reference, it was very helpful to identify significant genomic regions harboring hetero-SNPs that produced relatively low ΔSNP index values compared with those of homo-SNPs (data not shown).
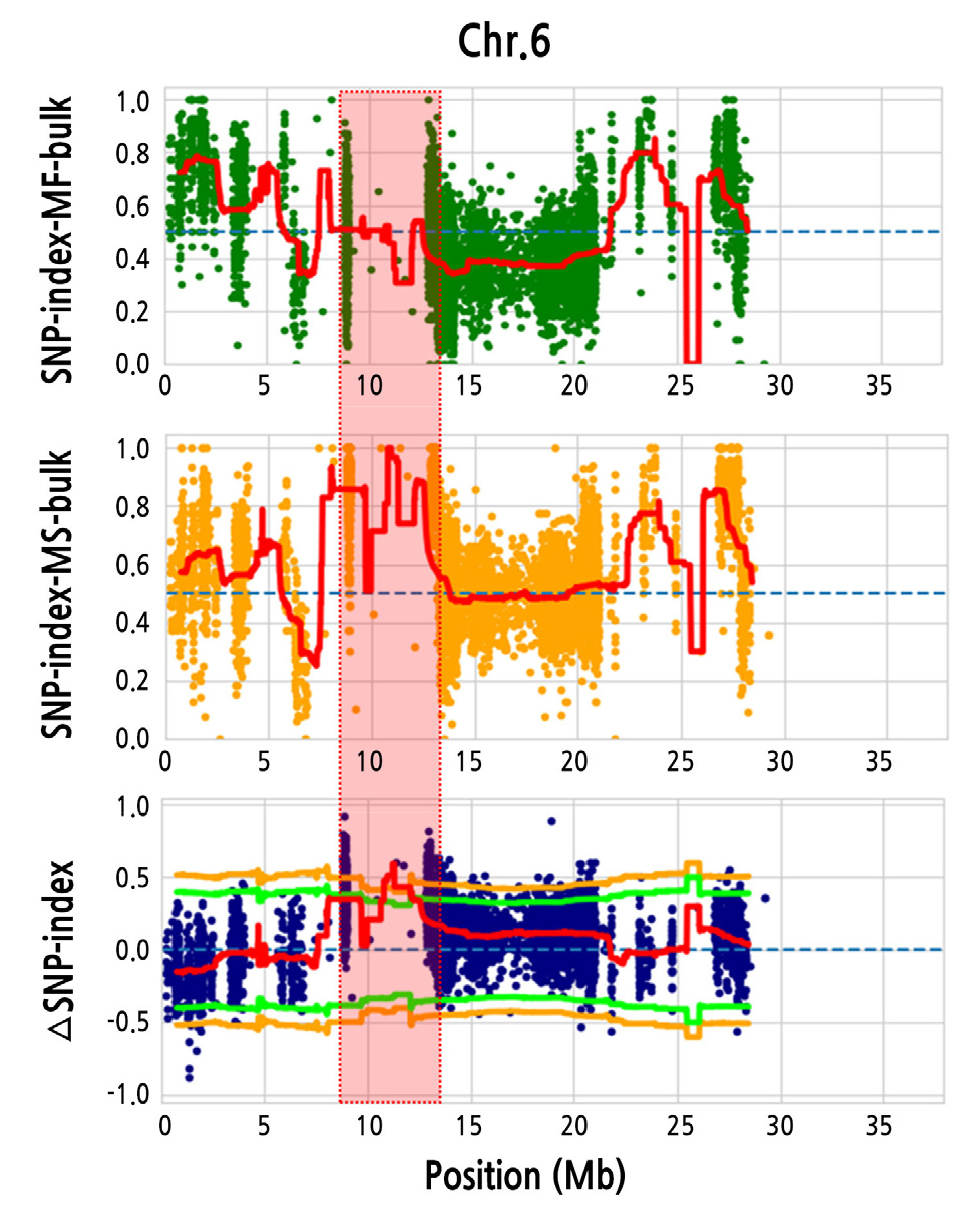
Fig. 2.
Mapping of candidate genomic regions for male sterility on chromosome (Chr.) 6. (A) Graph of the single nucleotide polymorphism (SNP) index plot of the male-fertile (MF) bulk, (B) the male-sterile (MS) bulk, and (C) the ΔSNP index (difference between the SNP index of MS bulk and MF bulk). Significant candidate genomic regions are surrounded by a dotted box and highlighted in red (8.9–13 Mb). Red line, ΔSNP index; Orange line, p < 0.01; Green line, p < 0.05.
Development of Male Sterility-Related SNP Markers and Fine Mapping
We focused on the candidate genomic region that showed a significant ΔSNP index value in BSA-seq results and developed HRM markers around this region by retrieving ca. 1-Mb genomic sequences around SNPs located at 8.9–13 Mb on Chr. 6. After identifying the discriminated polymorphic SNPs in each parental line, we genotyped the F2 plants (n = 81) using a total of seven HRM markers (Table 3). As we already knew that the MS genotype is recessive (aa) through the genetic study, the AA or Aa genotype of the F2 population was supposed to confer the MF phenotype. When we counted the number of discrepant individuals not having an expected genotype for each locus, we could map down to a 298.3-kb interval (10,166,048 – 10, 464,363 bp) as tightly linked to the locus responsible for the MS phenotype (Table 3).
Table 3.
Candidate single nucleotide polymorphism (SNP)-based high-resolution melting (HRM) markers linked to male sterility on chromosome 6
| SNP position | SNPs | Primer | F2 genotype |
Discrepancy of F2 | Primer sequence (5'→3') | |||
| MF | MS | AA | Aa | aa | ||||
| 9,329,023 | C | G | HRM6-1-F | 18 | 45 | 18 | 14/81 | CTTTTCTAAAAGTACAGTTGCCAAT |
| HRM6-1-R | TGCATATGGTATGTCAGTTGAGTT | |||||||
| 10,166,048 | C | A | HRM6-2-F | 18 | 38 | 25 | 4/81 | AAAAATGGGATTTGAATTGGTAAA |
| HRM6-2-R | TTTTGGTTCTTTTTGCTATATTTGA | |||||||
| 10,464,363 | G | A | HRM6-3-F | 17 | 39 | 25 | 3/81 | CAAGTATATCAGTCAAGTGCATCGT |
| HRM6-3-R | TTGATACACTATACACACTTGATACCC | |||||||
| 12,009,531 | A | G | HRM6-4-F | 18 | 39 | 22 | 5/81 | AACTAGCGGAGGATGTTCAA |
| HRM6-4-R | TTTTGATTTTTCACCAGTGATGTT | |||||||
| 12,272,775 | C | T | HRM6-5-F | 19 | 38 | 24 | 8/81 | ATGGACCTACCATCCTTGCTT |
| HRM6-5-R | TGATCACACAAATTTATCACATACA | |||||||
| 12,904,487 | A | G | HRM6-6-F | 19 | 38 | 24 | 8/81 | CCTGCAATTTAGAAGAGGGAAG |
| HRM6-6-R | ATCGGTGGCCCTCAAATTCT | |||||||
| 13,043,043 | G | A | HRM6-7-F | 20 | 38 | 23 | 9/81 | CATTTTTCTCTTTCTTCTTAGTGTGC |
| HRM6-7-R | TCAATGCCCTGTCACTACCC | |||||||
When we investigated the genomic sequences between the parental lines CAUms-1 and IT190143, we unexpectedly found only one sequence variation of a 10-bp deletion (5’- GTTCAGTTC -3’) from 10,373,352 to 10,373,361 bp (Fig. 3A). The 10-bp deletion might result in a frameshift mutation as well as a deletion of three amino acids (Glu-Leu-Lys) in the coding sequence of the Cla97C06G117840 transcript of CAUms-1 compared to that of IT190143 (wild type) (Fig. 3B and 3C).
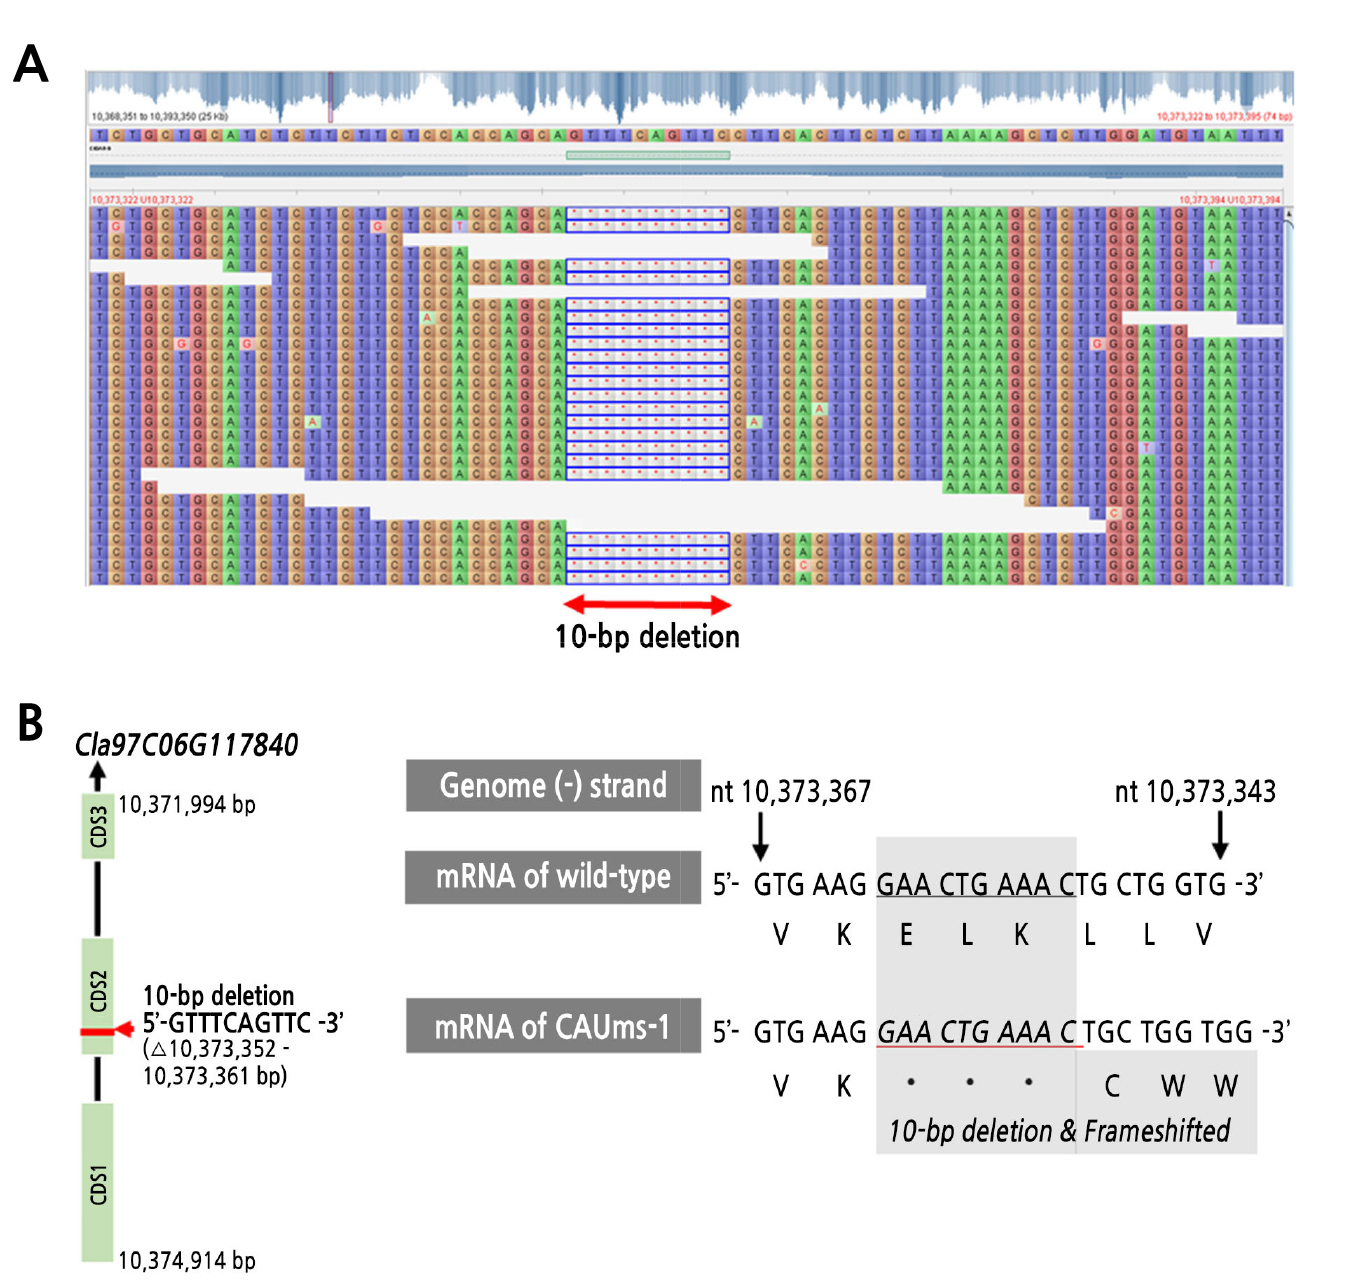
Fig. 3.
Mutation detected in the putative causal gene for male sterility. (A) Deletion of CAUms-1 sequences (Chr6: 10,373,352 – 10,373,361 bp) was visualized using Tablet software, (B) the 10-bp deletion and frameshift in the transcript Cla97C06G117840 of male-sterile CAUms-1 compared to the transcript of wild-type (IT190143) mRNA.
To test the cosegregation of the deletion region, we designed a multiplexed AS-PCR marker (Fig. 4A and Table 4) and successfully developed the marker AS6-1 and analyzed the amplification products by gel electrophoresis (Fig. 4B). The AS6-1 marker was tightly linked to the MS locus, showing no discrepancy between the genotype and phenotype in the 81 F2 individuals, and a genetic linkage map was constructed with 7 previously tested HRM markers and the AS6-1 marker (Fig. 4C). We also developed an HRM maker (HRM6-8) to replace the AS6-1 marker to speed up genotyping for cross-validation using the 86 individuals of the NIL population (Fig. 4D and Table 4). The HRM6-8 marker successfully discriminated genotypes (Aa/aa) of each individual and completely cosegregated with the MS phenotype in the NIL population.
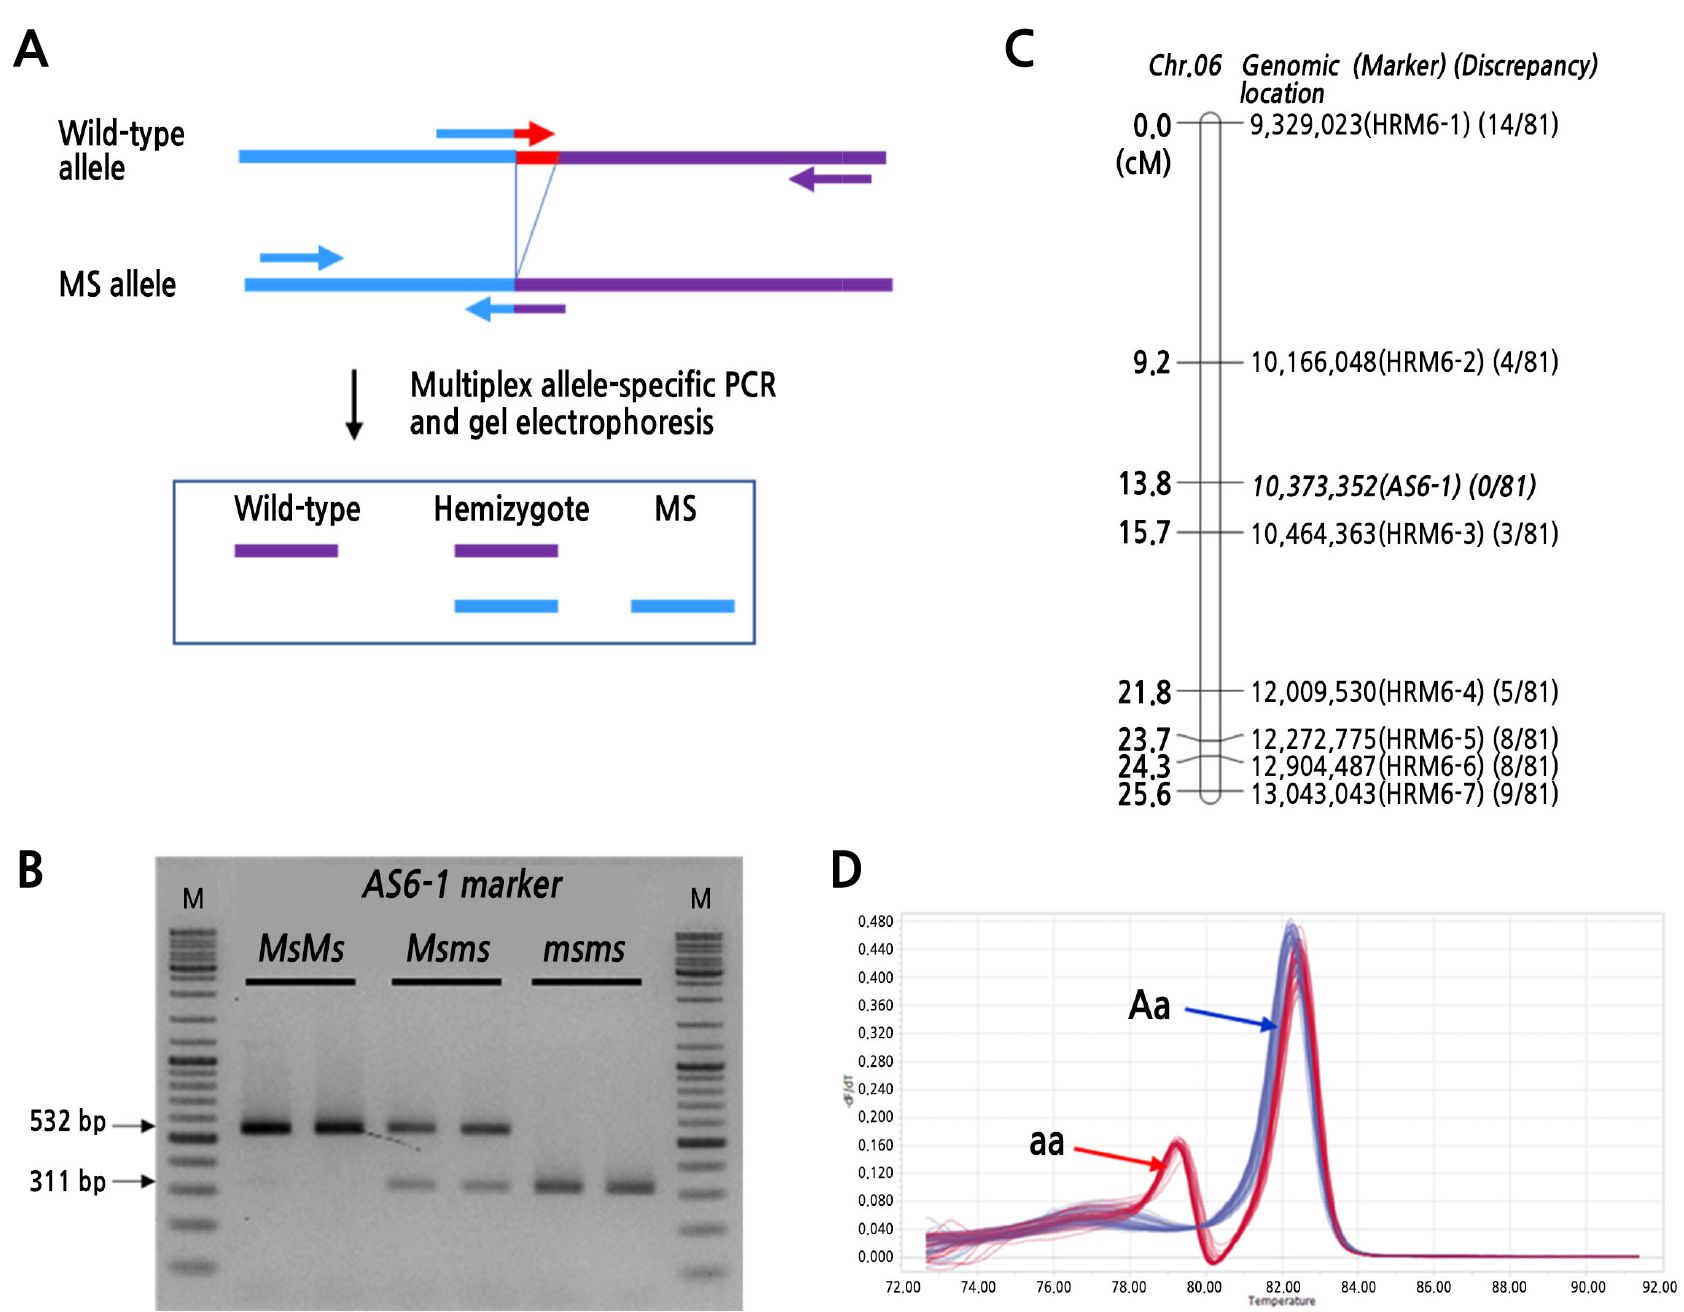
Fig. 4.
Molecular markers for the detection of the causal gene harboring a small deletion. (A) Design of a multipex allele-specific PCR (AS-PCR) marker to detect the 10-bp deletion in the genome sequences, (B) gel electrophoresis result using the AS-PCR marker to discriminate the genotypes of the F2 population, (C) A genetic linkage map of the F2 population was constructed using seven HRM markers (HRM6-1 to 6-7) and one AS-PCR marker (AS6-1). The ratio in the parentheses represents the number of individuals showing discrepant phenotypes to the total of 81 F2 individuals, (D) HRM analysis result detecting the genotypes of the 86 individuals of the NIL population.
Table 4.
Molecular markers used for the detection of the 10-bp deletion regionz of Cla97C06G117840, showing tight linkage to male sterility
| Marker Type (Name) | Primer | Sequence (5’ to 3’) | Product size (bp) |
| AS-PCRy (AS6-1) | WT-Long-F | TCTTCTTCTCCACCAGCAGTTTC | 532 |
| WT-Long-R | TGCTCTCAAGAGTTTGGTTCCTAT | ||
| MS-Short-F | TGAAGATCGTCAAGCAATTTAGAG | 311 | |
| MS-Short-R | GCTTTTAAGAGAAGTGAAGTGCTGGT | ||
| HRMx (HRM6-8) | HRM6-8-F | TGCTCCTCTCTCTGCTGCAT | 100 |
| HRM6-8-R | TTGTGGGAGACGCCATAAAT |
Putative Male Sterility Locus, Cla97C06G117840
We previously reported differentially expressed MS-related genes using transcriptomic analysis (Rhee et al., 2015) and registered a Korean patent including an MS-related region and MS-linked markers (Lee et al., 2020). In this study, we made a significant step forward in developing a perfectly cosegregated molecular marker for 81 F2 and 86 NIL population individuals and determined a putative MS locus of Cla97C06G117840 based on the 97103 watermelon genome sequence v2 (Guo et al., 2019). The candidate gene of Cla97C06G117840 is annotated as encoding the transcription factor bHLH91-like gene, which is one of the critical basic helix-loop-helix (bHLH) transcription factors related to the fertility of pollen grains in Arabidopsis (Fernandez-Calvo et al., 2011; Zhu et al., 2015; Ferguson et al., 2017), rice (Moon et al., 2020), tomato (Liu et al., 2019), Chinese cabbage (Hu et al., 2021), and several other crops. Furthermore, three representative bHLH transcription factors, bHLH10, bHLH89, and bHLH91, are known to interact with TDR Interacting Protein 2 (TIP2), Undeveloped Tapetum 1 (UDT1), Tapetum Degeneration Regulation (TDR), and Eternal Tapetum 1 (EAT1) for the normal development of pollen, tapetum, and anther (Zhu et al., 2015; Moon et al., 2020). These reports allude that the possible loss of function of bHLH91 caused by mutations such as a deletion and a frameshift might lead to the MS phenotype described in this study. However, verifying causality for the putative MS locus Cla97C06G117840 will require further study. In conclusion, we suggest that the high cosegregation of our markers (AS6-1 and HRM6-8) with the identified MS locus will be helpful to introduce MS in watermelon breeding programs and facilitate the production of F1 hybrids.
Supplementary Material
Supplementary materials are available at Horticultural Science and Technology website (https://www.hst-j.org).
- HORT_20210060_Figure_1s.pdf
Ploting result of a genome-wide BSA-seq analysis. The plot was created using the QTL-seq package of R (Core Team, 2020) with a 2.0-Mb window size and 10-kb step size. Red line, ΔSNP index; Orange line, p < 0.01; Green line, p < 0.05.
