

Introduction
Materials and Methods
Plant materials and sampling
Quantification and composition of epicuticular and intracuticular wax fractions
GC-MS analysis
Scanning electron microscopy
Statistical analysis
Results
Wax load and quantitative by compound class
Relative composition of compound classes
Carbon chain length distribution
Surface microstructure
Discussion
Conclusion
Introduction
Deterioration of indoor air quality is widely recognized as a major environmental and public health concern, and particulate matter (PM) has been identified as a key environmental factor with adverse effects on human health (WHO 2024). In this context, ornamental plants displayed indoors for extended periods are increasingly viewed not merely as decorative elements but also as horticulturally relevant research systems that warrant a mechanistic understanding of the physicochemical properties of their surfaces (Montaluisa-Mantilla et al. 2023; Lee and Kim 2025).
The outermost plant surface consists of a cuticle with an organized wax layer deposited on and within it, forming the primary interface between the plant and the external environment (Bock et al. 2021). Cuticular wax comprises very-long-chain lipids and related metabolites (Shepherd and Griffiths 2006; Buschhaus and Jetter 2011; Trivedi et al. 2019) synthesized in epidermal cells (Samuels et al. 2008; Trivedi et al. 2019) and forms spatially distinct strata commonly classified as epicuticular wax (EW) and intracuticular wax (IW) (Buschhaus and Jetter 2011). The chemical composition and structural organization of the wax layers determine the surface hydrophobicity, crystallinity, and microstructural features, thereby contributing to the reduction of non-stomatal water loss and defense against external physical and chemical forms of stress (Koch and Ensikat 2008). Furthermore, because EW and IW can differ in terms of their composition and distribution, even within the same organ, it has been suggested that surface functions may be regulated not only by the total wax load but also by layer-specific compositions (Buschhaus and Jetter 2011). Accordingly, organ- and layer-resolved wax datasets are needed to formulate and test hypotheses about surface environment interactions, including particulate deposition and retention, in subsequent functional studies.
The total cuticular wax load and the relative abundance of major compound classes, including alkanes, fatty acids, primary alcohols, and triterpenoids, vary with organ-specific functional demand levels. In general, alkane-dominated profiles in leaves have been associated with barrier properties and the formation of crystalline structures, whereas petals have been proposed to exhibit a more complex regulation of surface properties and microstructures through mixtures of fatty acids, alcohols, triterpenoids, and other compounds (Jetter et al. 2006; Kosma et al. 2009; Buschhaus and Jetter 2011; Buschhaus et al. 2015). Although these concepts provide important clues for explaining organ-specific surface functions, a proper mechanistic interpretation requires datasets that separate organs and wax layers within a given ornamental species.
Phalaenopsis is one of the most important genera in the global orchid industry with substantial commercial and indoor horticultural significance in terms of market share and mass production systems (Tiwari et al. 2024; Serafin Sevilleno et al. 2025). In particular, Phalaenopsis ‘Mantefon’ is highly valued for its ornamental quality and suitability for long-term indoor display, and petal contributions to particle capture under PM conditions have been suggested (Lim and Kim 2019). However, research on ornamental species has largely focused on leaf traits. Moreover, studies that separate EW and IW in both leaves and petals and quantitatively compare wax load, chemical composition, and carbon chain length distributions remain limited. This gap constrains mechanism-based interpretations (Buschhaus and Jetter 2011; Fernández et al. 2016). Therefore, this study aimed to separate EW and IW from the leaves and petals of P. ‘Mantefon’ and characterize the wax loads of major compound classes, the mass-based relative compositions, and the carbon chain length distributions using quantitative and qualitative approaches. In addition, the epidermal surface microstructures were examined using scanning electron microscopy (SEM) to relate the chemical composition to the surface organization. By integrating the organ- and layer-specific patterns of cuticular wax organization within a single species, this study provides foundational data for interpreting the mechanistic basis of plant surface and environmental interactions.
Materials and Methods
Plant materials and sampling
Commercially grown Phalaenopsis ‘Mantefon’ plants were obtained from a local producer (Bok Orchids, Yongin, Korea). Plants were supplied in 10 cm plastic pots (approximately 750 mL volume) filled with 100% sphagnum moss. Eight different plants were used in this study. At sampling, plants had an average of 6.5 leaves and 54.6 flowers each and were processed immediately for analysis.
For leaf samples, the second or third fully expanded mature leaves from the apex were collected from each plant. For flower samples, flowers were collected from the central portion of two inflorescences, with two flowers taken per inflorescence, yielding four flowers per plant. From each plant, leaf and petal tissues were punched into discs using a 20 mm cork borer (No. 11), producing 20 discs per organ. Each set of 20 discs per organ was collected from the same plant and then pooled and treated as a single sample for wax extraction. Therefore, the individual plant was considered the independent biological replicate, resulting in eight biological replicates in total (n = 8). The 20 discs per organ served as within-plant subsamples to obtain sufficient material and to average within-plant heterogeneity. The projected area of one disc was calculated as πr2 with r = 1 cm, resulting in 3.142 cm2 per disc. The wax load was expressed on an area basis in micrograms per square centimeter.
Quantification and composition of epicuticular and intracuticular wax fractions
The EW and IW fractions were obtained using a modified sequential solvent extraction approach based on the layer-specific cuticular wax analysis concept, in which epicuticular and intracuticular wax compartments are operationally distinguished by selective removal strategies (Buschhaus and Jetter 2012; Fernández et al. 2016). Specifically, tissues were immersed in n-hexane for 90 s to obtain an EW-enriched fraction, consistent with short-duration hexane dipping procedures used to preferentially extract surface n-hexane soluble waxes (Mohy-ud-din et al. 2010). After the complete evaporation of n-hexane, the same tissues were immersed in chloroform for 40 s to obtain a residual cuticular wax fraction, which was operationally defined as an IW-enriched fraction for comparison between the sequentially extracted fractions (Fernández et al. 2016; Park et al. 2022). Each wax extract was filtered through a 0.20 µm disposable membrane filter and transferred into a 20 mL brown glass vial (Fisher Scientific, Pittsburgh, PA, USA). Filtrates were concentrated to dryness under reduced pressure at 40°C to remove solvents. After drying, the wax extract was reconstituted in 100 µL of n-tetracosane (internal standard) dissolved in hexane. For derivatization, samples were reacted with 100 µL of N,O-bis(trimethylsilyl)trifluoroacetamide (BSTFA) containing 1% trimethylchlorosilane (TMCS; Sigma-Aldrich, St. Louis, MO, USA) and 50 µL of pyridine (Sigma-Aldrich, St. Louis, MO, USA) at 75°C for 70 min.
GC-MS analysis
Wax compositions and loads were analyzed using a gas chromatograph (Nexis GC 2030, Shimadzu, Kyoto, Japan). Compounds were separated on an Rxi-5Sil MS capillary column (Restek, USA; 30 m length, 0.25 mm inner diameter, 0.25 µm film thickness). The oven temperature program was held at 70°C for 90 s, increased at 20°C·min-1 to 200°C, increased at 30°C·min-1 to 315°C, and held at 315°C for 20 min. Injections were performed in splitless mode. The injector temperature was set to 270°C. Helium was used as the carrier gas at a constant flow rate of 1.07 mL· min-1. The mass spectrometer was operated in electron ionization mode, with a scan range of m/z 45–650. The interface temperature was set to 315°C and the ion source temperature to 250°C. Compound identification was based on the National Institute Standard and Technology (NIST) library and authentic standards, including a standard mixture of saturated alkanes (from C7–C40; Supelco, Bellefonte, PA, USA), palmitic acid, 1-octadecanol, and methyl heptadecanoate.
Scanning electron microscopy
Leaf and petal samples were air-dried at room temperature for 7 d, following Pathan et al. (2008). Dried tissues were cut into pieces approximately 5 × 5 mm in size excluding the midrib region. The samples were then sputter-coated with platinum for 90s using an ion sputter coater. Surface microstructures were observed using a field-emission scanning electron microscope (FE-SEM, SU8010, Hitachi High Tech, Tokyo, Japan) at the Instrumentation Center of the University of Seoul.
Statistical analysis
Statistical analyses were conducted using the Statistical Analysis System package (version 9.4; SAS Institute Inc., USA). Two-way analysis of variance (ANOVA) was performed and significant differences among treatments were determined using Duncan’s multiple range test (DMRT) at a 5% significance level.
Results
Wax load and quantitative by compound class
The total wax load and the wax loads of the major compound classes in EW and IW from the leaves and petals of P. ‘Mantefon’ are summarized in Fig. 1 and Table 1. The total wax load was higher in leaves (73.1 µg·cm-2) than in petals (22.5 µg·cm-2), corresponding to an approximately 3.25-fold difference (Fig. 1). This difference between the organs was largely attributable to alkane accumulation (Table 1). Leaves showed high alkane loads in both layers, with levels of 41.972 µg·cm-2 in EW and 26.501 µg·cm-2 in IW. In contrast, petals showed lower alkane loads, with levels of 3.162 µg·cm-2 in EW and 5.241 µg·cm-2 in IW.
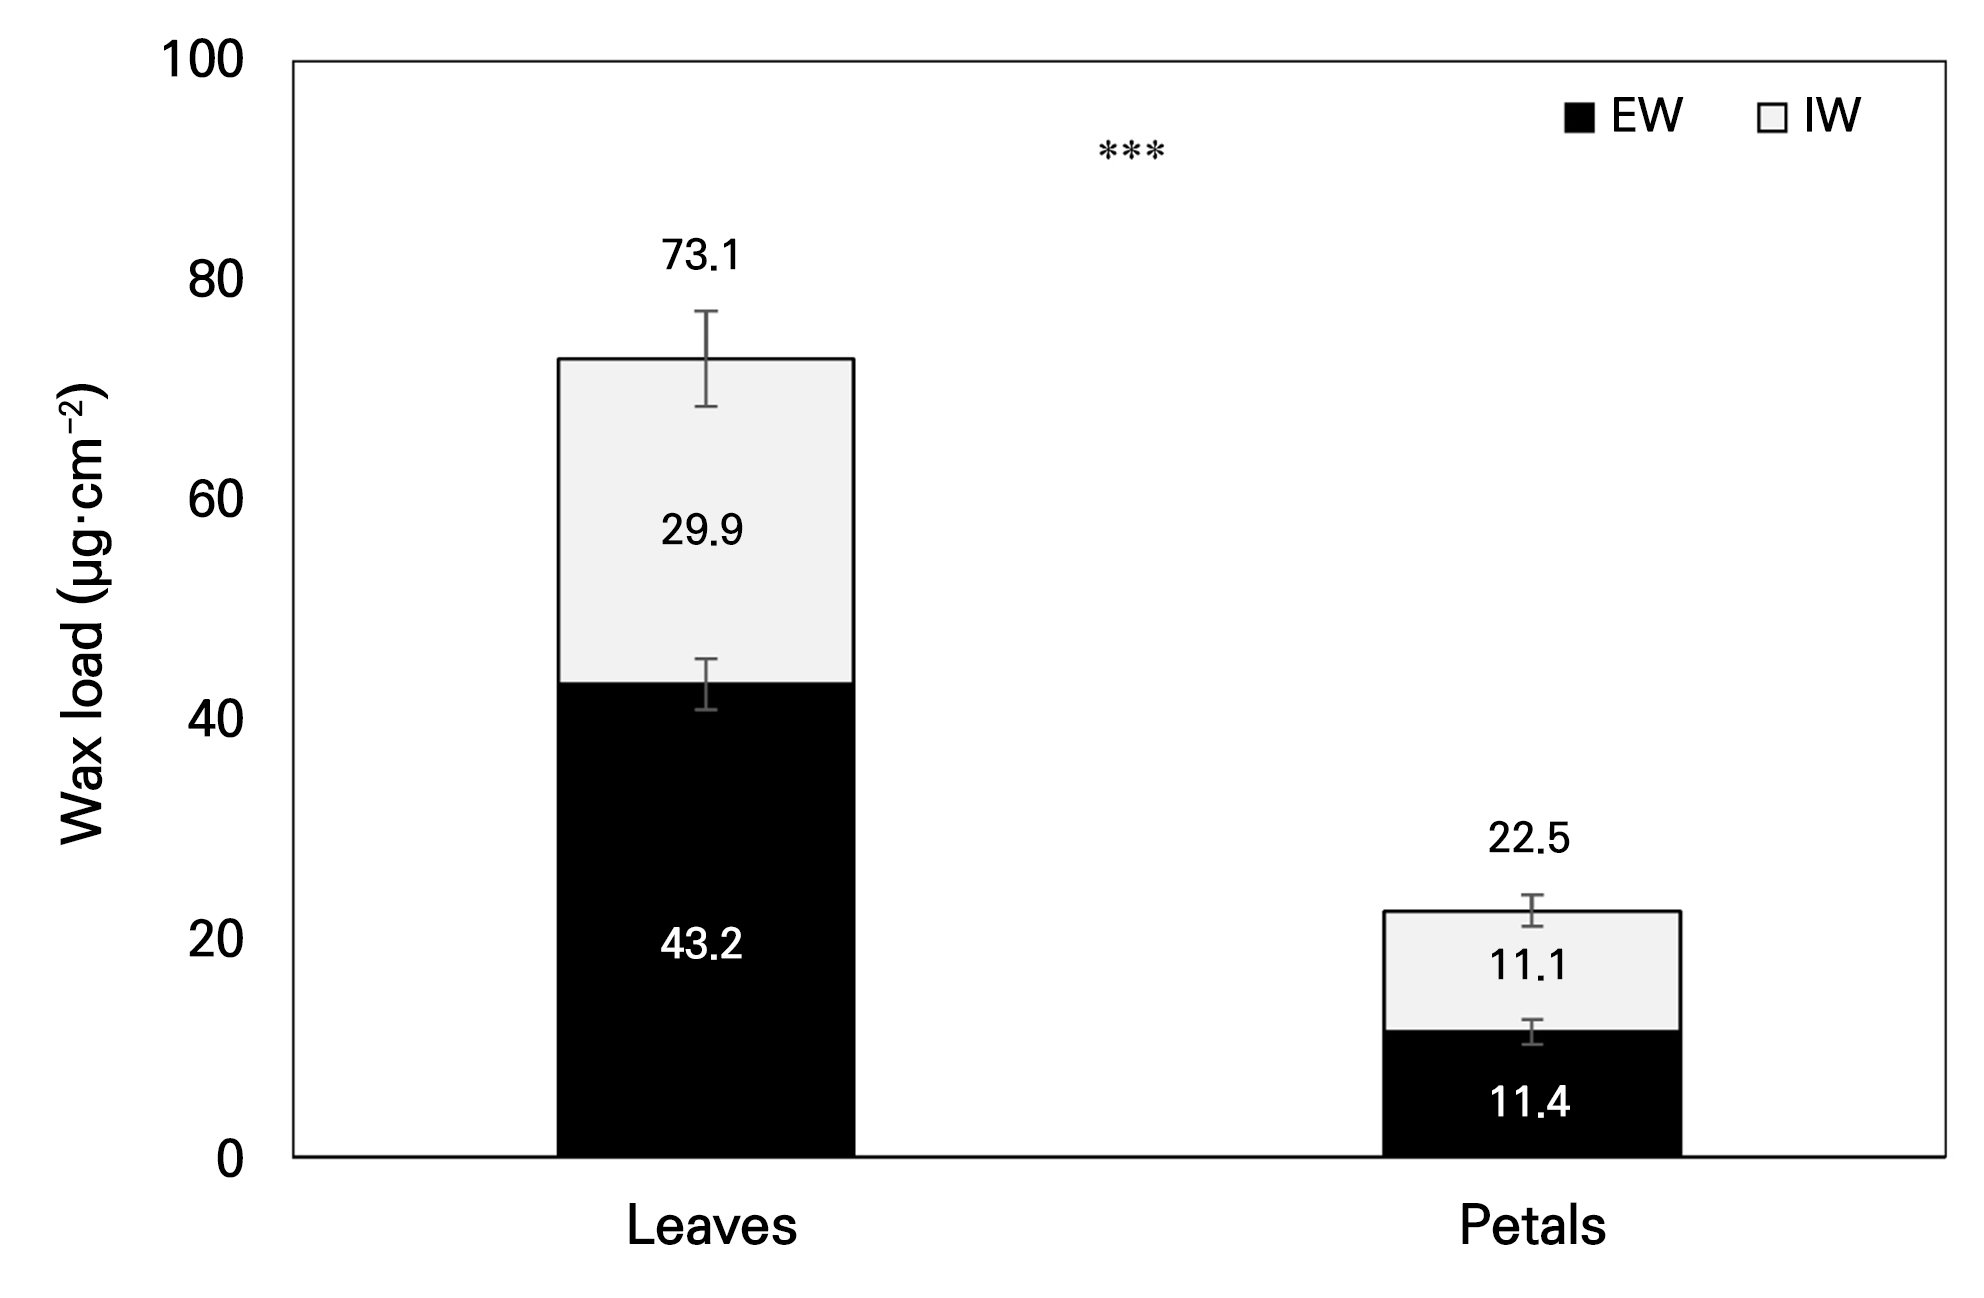
Table 1.
Chemical compositions and loads of the epicuticular and intracuticular wax layers on leaves and petals of Phalaenopsis ‘Mantefon’
Within the leaves, the total wax load in EW at 43.168 µg·cm-2 exceeded that in IW at 29.878 µg·cm-2. In the petals, the total wax loads were comparable between EW at 11.430 µg·cm-2 and IW at 11.051 µg·cm-2. Despite the similar total wax loads in the petal EW and IW, the allocation among the compound classes differed markedly between layers. Fatty acids were higher in petal EW at 6.937 µg·cm-2 than in petal IW at 3.055 µg·cm-2. In contrast, primary alcohols were higher in petal IW at 2.218 µg·cm-2 than in petal EW at 0.942 µg·cm-2. Triterpenoids were detected only in petals. This fraction was higher in IW at 0.537 µg·cm-2 than in EW at 0.390 µg·cm-2, while the corresponding fraction was below the detection limit in leaves. In the leaves, EW generally exceeded IW across the major compound classes. Fatty acids were an exception, showing higher loads in IW at 3.208 µg·cm-2 than in EW at 1.197 µg·cm-2.
Relative composition of compound classes
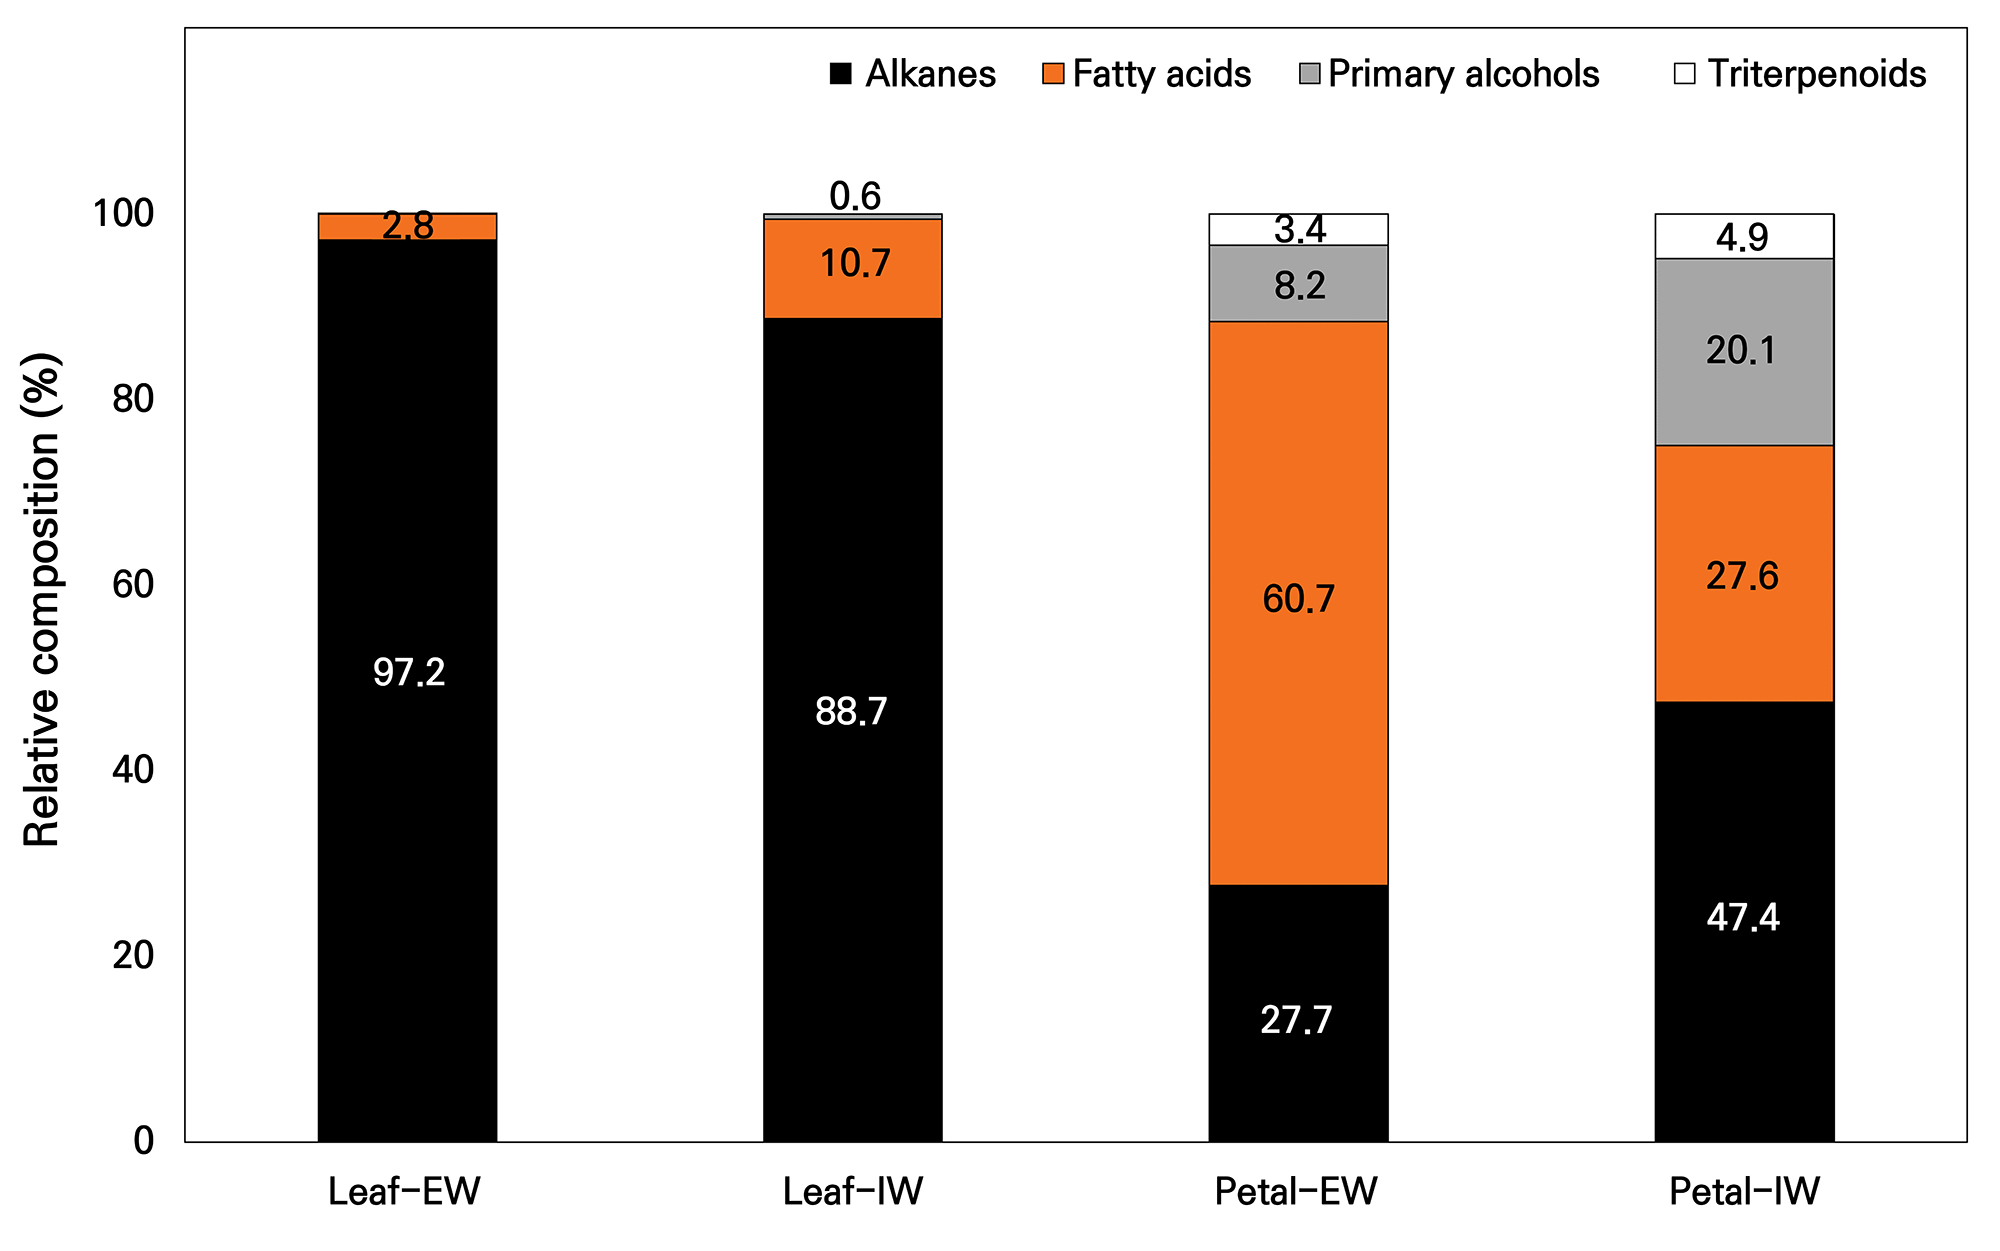
The relative compositions (%) of the major compound classes in each organ and wax layer are shown in Fig. 2. In the leaf EW case, alkanes dominated the profile at 97.2%, also remaining the most abundant class in leaf IW at 88.7%. Relative to leaf EW, leaf IW had a higher relative contribution of fatty acids at 10.7% and primary alcohols at 0.6%. In the petals, the compositional pattern differed markedly between the layers. In the petal EW case, fatty acids were predominant (60.7%), whereas alkanes accounted for 27.7%, and alcohols and the triterpenoid fraction contributed 8.2% and 3.4%, respectively. For petal IW, alkanes increased to 47.4% and fatty acids decreased to 27.6%, whereas primary alcohols and the triterpenoid fraction increased to 20.1% and 4.9%, respectively. Overall, despite the comparable total wax loads between petal EW and IW, the allocation among compound classes was clearly reorganized depending on the wax layer.
Carbon chain length distribution
The carbon chain length distributions of the major compound classes in EW and IW are shown in Fig. 3. Leaf alkanes exhibited pronounced peaks at C26, which were consistently observed in both EW and IW. In contrast, the detected alkane fraction in the petals was distributed primarily across the C17–C24 range, indicating organ-specific differences in chain length characteristics relative to the leaves.
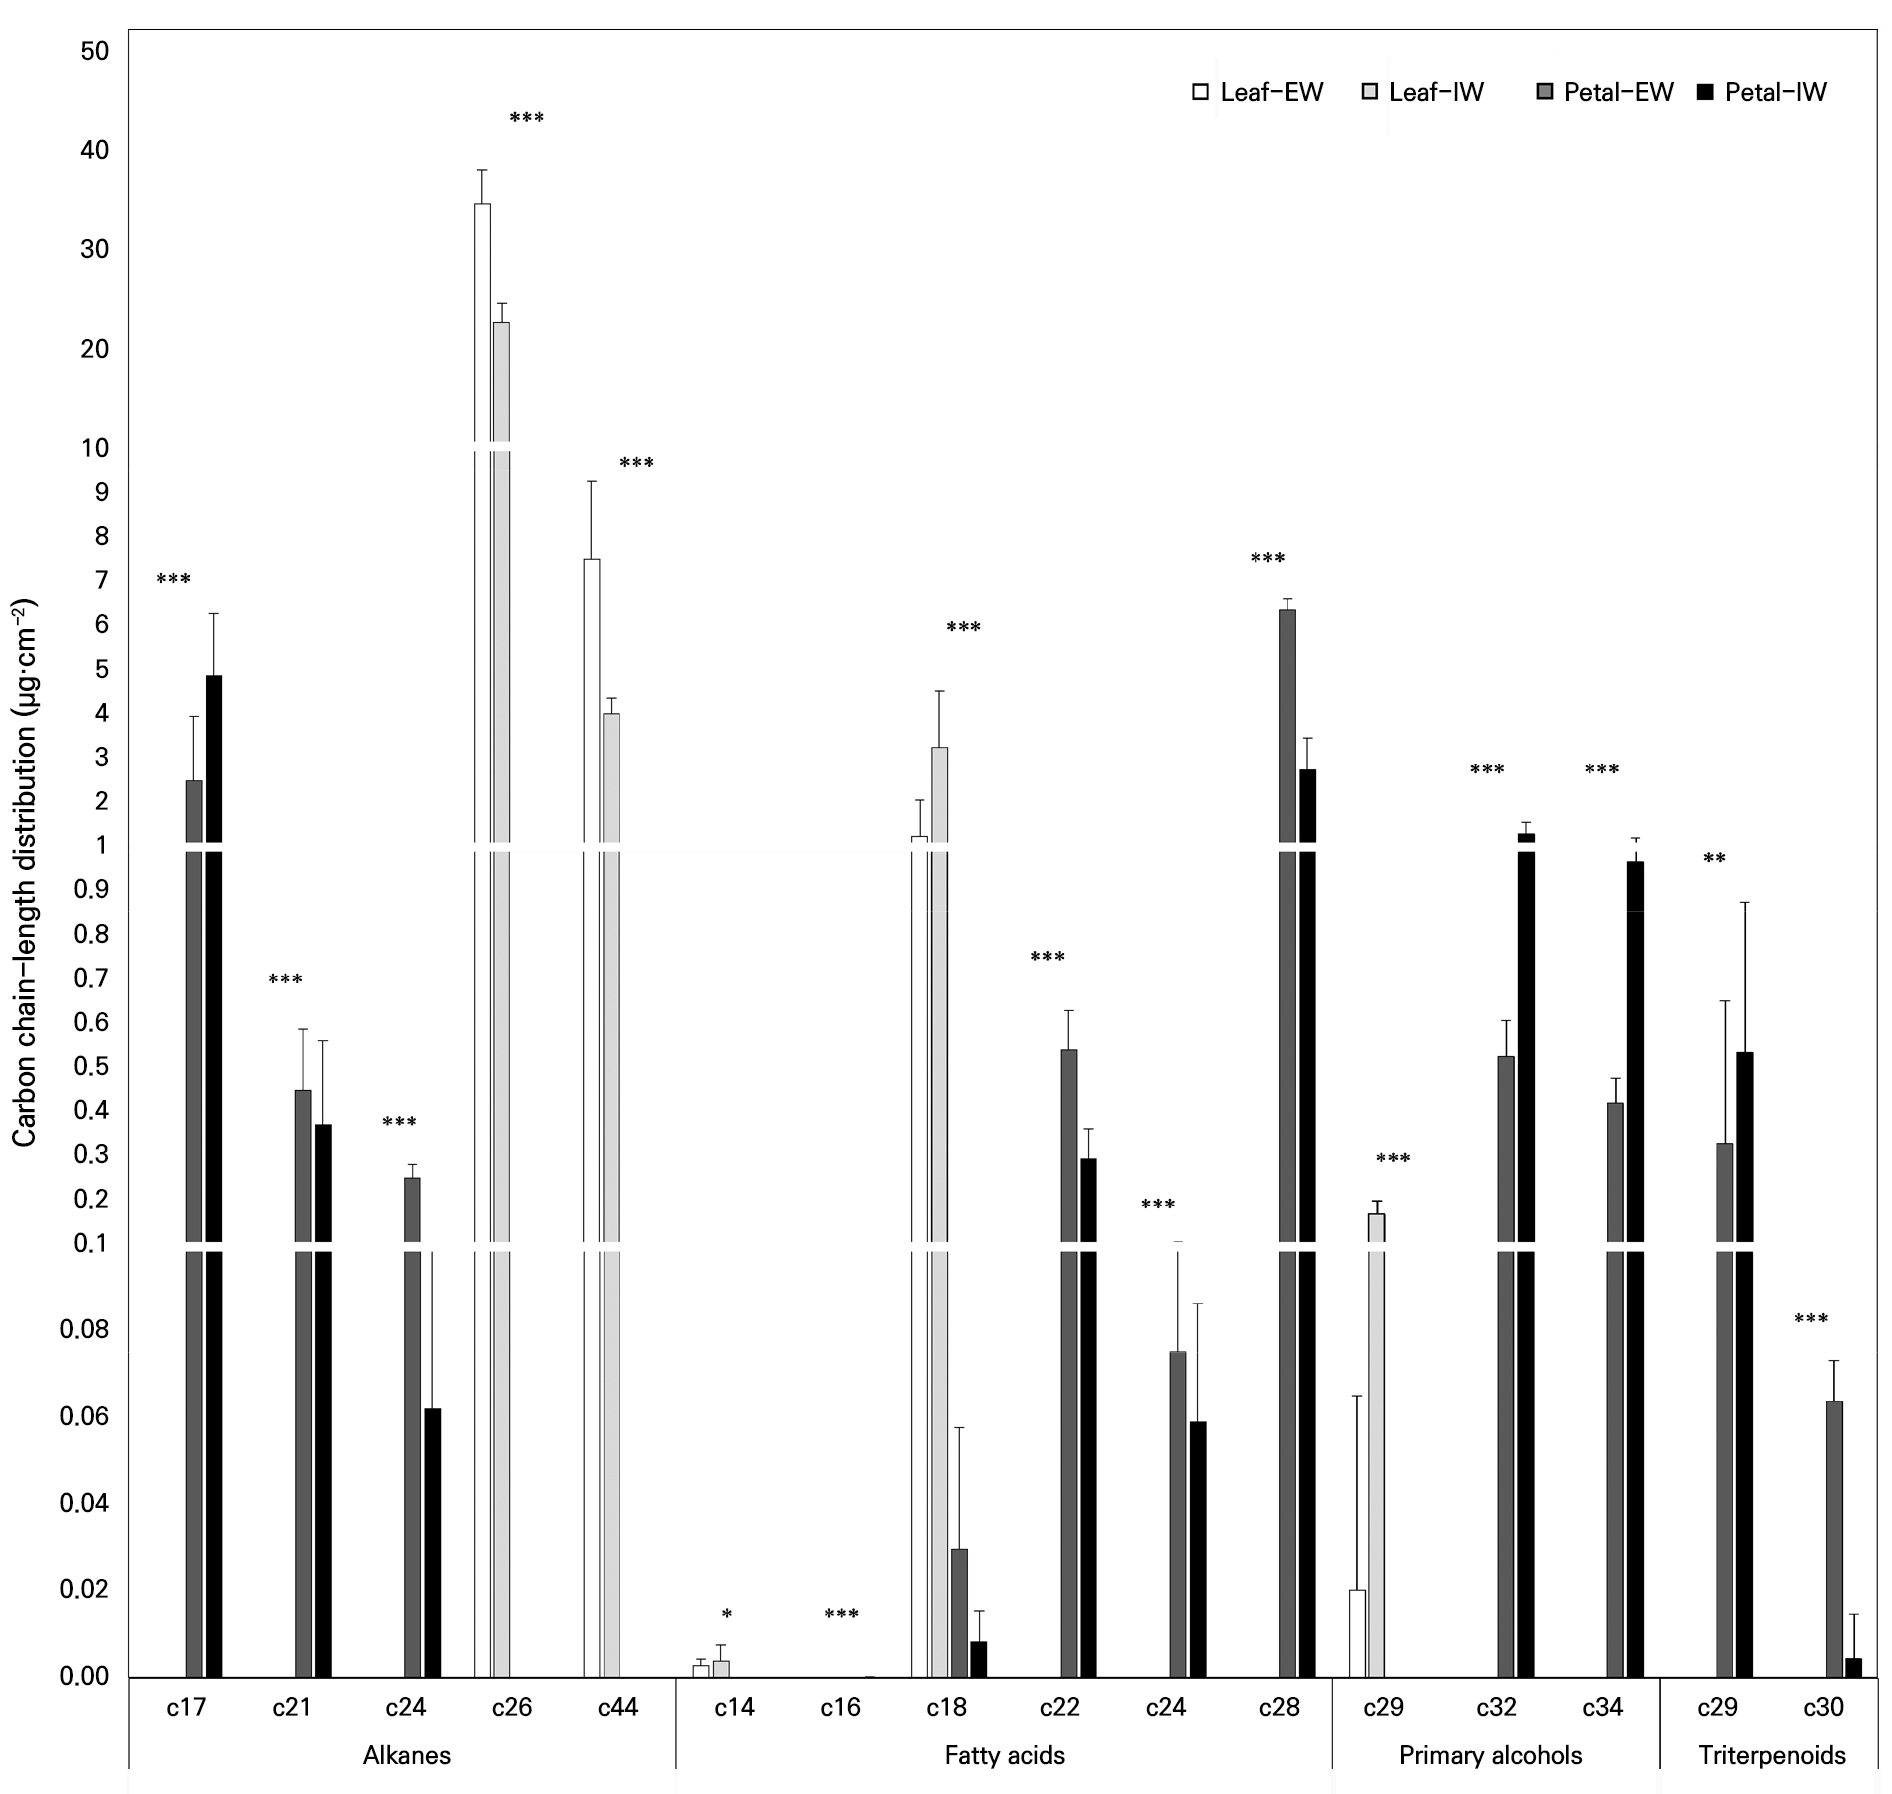
Fig. 3.
Carbon chain length distributions of epicuticular wax (EW) and intracuticular wax (IW) in leaves and petals of Phalaenopsis ‘Mantefon’. Major compound classes (alkanes, fatty acids, primary alcohols, and triterpenoids) are grouped by carbon chain length and are presented as the wax load per unit area (µg·cm-2). Bars represent the Leaf EW, Leaf IW, Petal EW, and Petal IW, and vertical bars represent the standard deviation. *, ** and *** indicate significant differences at p < 0.05, 0.01, and 0.001, respectively, as per ANOVA.
Fatty acids were dominated by C18 in the leaves, whereas C28 was predominant in the petals. In addition, fatty acids in the leaves were biased toward shorter chain lengths, whereas those in the petals were distributed more broadly from C18 to C28. Primary alcohols occurred at very low levels in the leaves but increased in the petals, particularly in IW, with major chain lengths at C32 and C34. The triterpenoid fraction was detected only in the petals, with the dominant constituents centered at C29, as assigned in the present dataset. Overall, these results indicate that the organs and wax layers differ not only in terms of the compound class composition but also in the chain-length distributions of the major wax constituents.
Surface microstructure
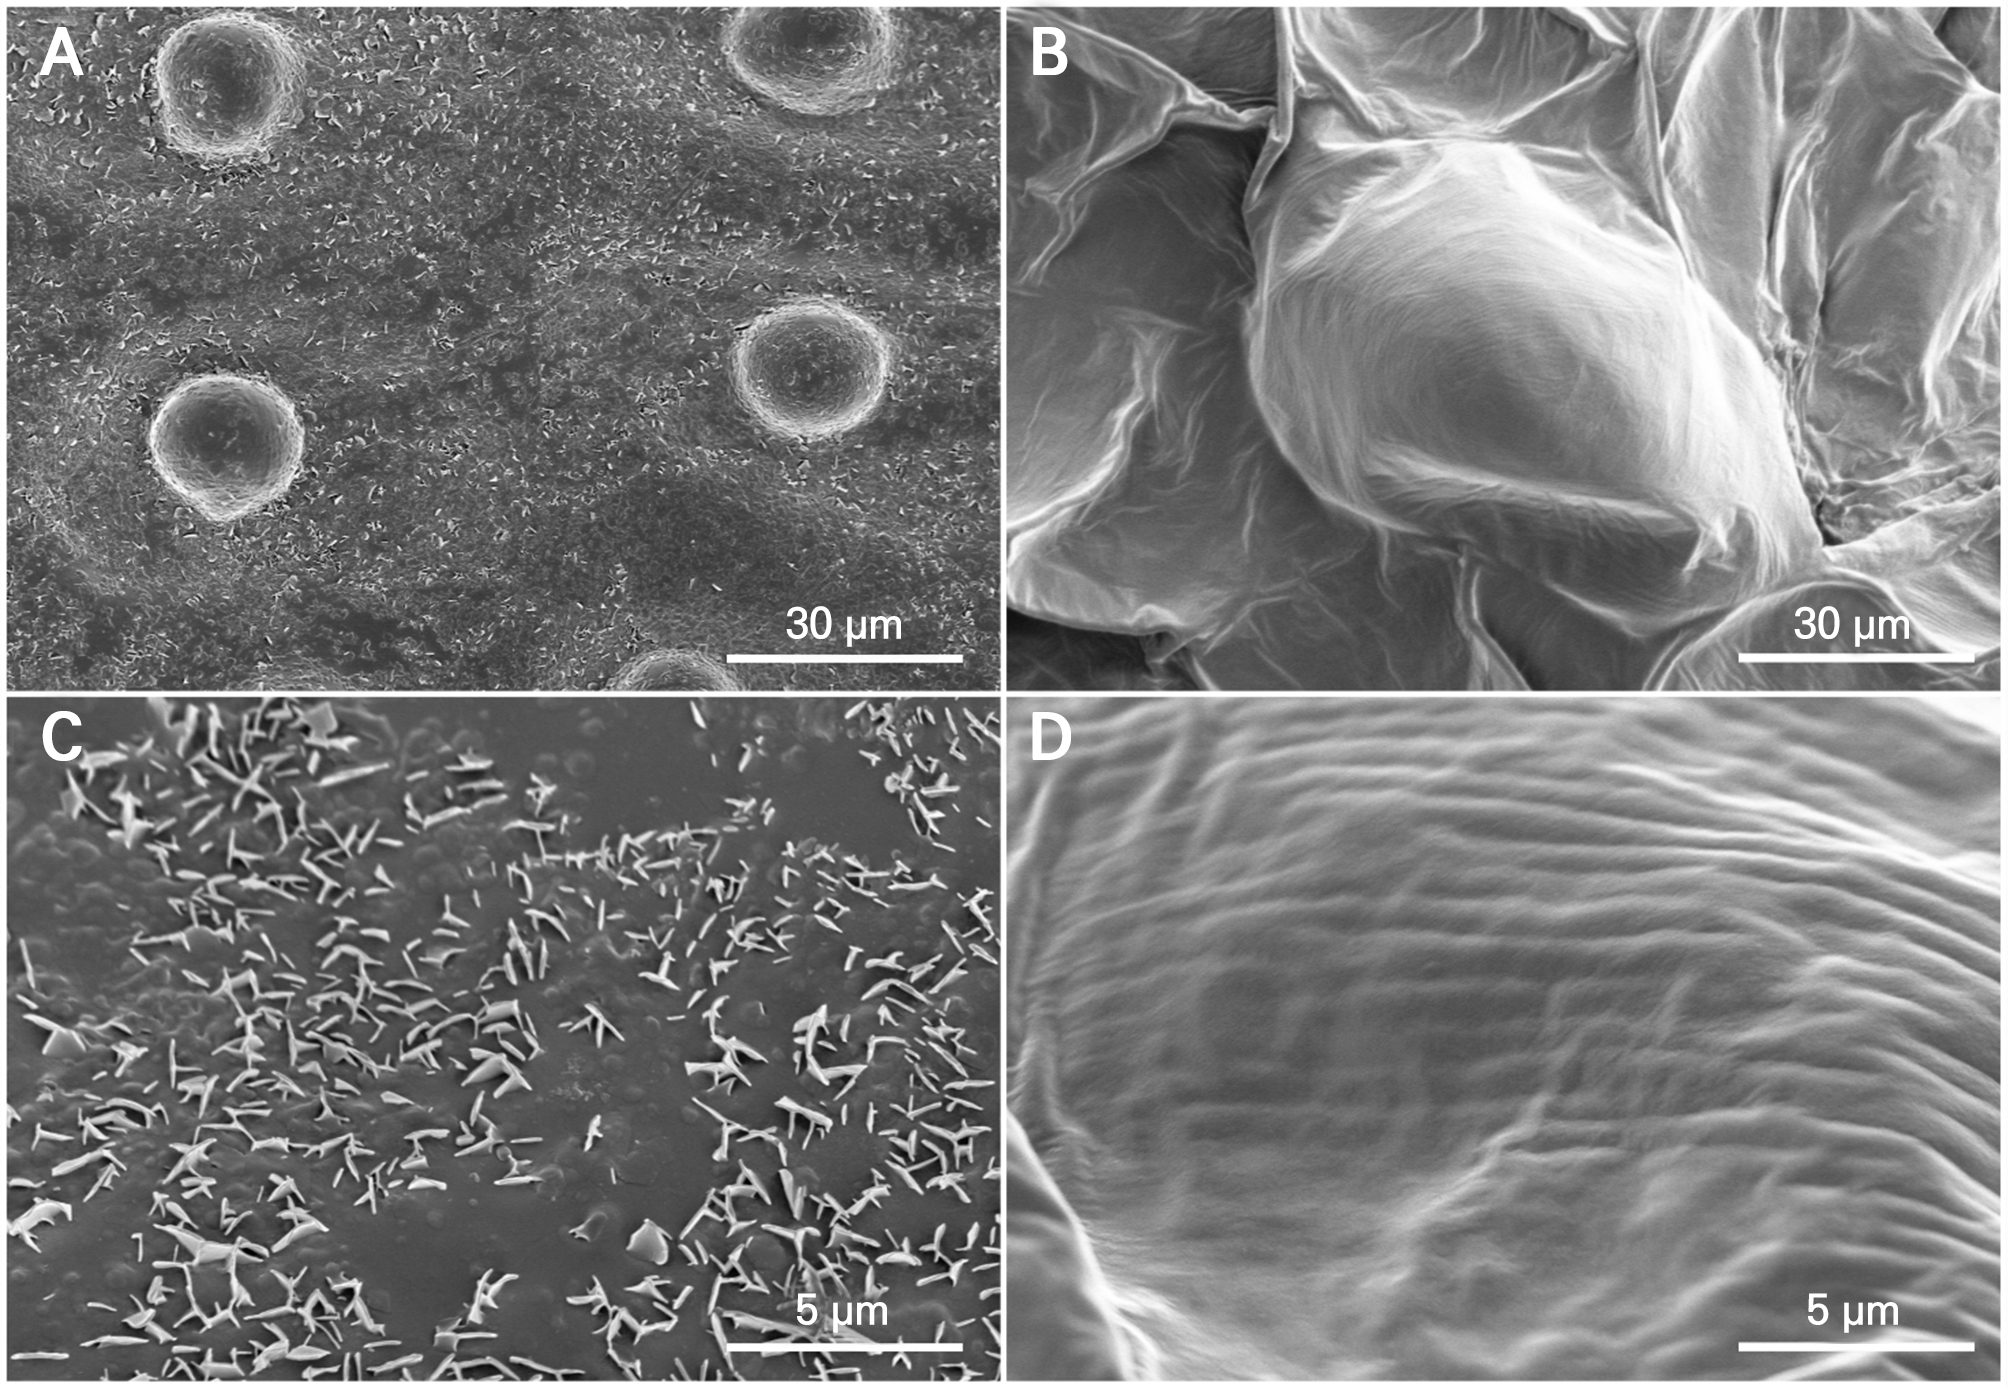
SEM observations revealed distinct surface microstructures in the leaves and petals (Fig. 4). The leaf surfaces displayed abundant wax crystalline structures distributed across the cuticle, resulting in a rough surface texture. In contrast, the petals showed little evidence of discrete crystalline structures and exhibited a comparatively smooth epidermal surface. These microstructural differences are consistent with the contrasting chemical organization between organs, characterized by alkane-dominated wax layers in leaves and a mixed-layer-dependent composition in petals.
Discussion
This study clearly demonstrated that when EW and IW are separately quantified in the leaves and petals of P. ‘Mantefon’, the total wax load, compound class composition, and carbon chain length distributions differ depending on the organ and layer. Layered wax analyses have experimentally shown that moving beyond viewing the cuticle as a single membrane, EW and IW can be treated as distinct chemical substructures with potentially different functional contributions (Buschhaus and Jetter 2011; Buschhaus et al. 2015). Accordingly, the present dataset provides a cultivar-specific quantitative framework that highlights not only clear organ-level contrasts but also pronounced layer-dependent reorganization within petals, including the petal-specific occurrence of a detectable triterpenoid fraction.
Leaves exhibited an approximately 3.25-fold higher total wax load than petals (Fig. 1 and Table 1), primarily stemming from increased alkane accumulation. The dominance of alkanes in both the leaf EW and IW cases is consistent with an alkane-rich wax organization that has often been associated with barrier-related leaf cuticles, although barrier performance was not directly evaluated in the present dataset (Jetter et al. 2006; Shepherd and Griffiths 2006). Consistently, the epicuticular wax composition of Oryza sativa leaves has been reported to retain a high alkane proportion despite variations across developmental stages, supporting the recurring observation of alkane-rich organization on leaf surfaces (Shi et al. 2023). In addition, the relatively great partitioning of fatty acids into IW in leaves indicates that compound classes can be redistributed across layers, even within the same organ, in good agreement with reports that EW and IW often differ quantitatively in terms of their composition (Buschhaus and Jetter 2011).
In contrast, petals had a lower total wax load than leaves and showed only a small difference in the total wax load between EW and IW, yet they exhibited pronounced compositional reorganization depending on layer (Fig. 2). The concept that functional contributions differ between wax layers in petals has also been presented in studies that physically separated petal wax layers and compared their functional roles, indicating that the layer resolution can be a meaningful analytical unit in floral organs as well (Buschhaus et al. 2015). In the petal EW case, fatty acids accounted for 60.7%, whereas alkanes represented 27.7%. In contrast, petal IW exhibited a more even distribution of compound classes, including alkanes (47.4%), fatty acids (27.6%), primary alcohols (20.1%), and triterpenoids (4.9%). Importantly, a detectable triterpenoid fraction was observed only in petals, and its contribution was higher in IW than in EW, indicating that petal wax stratification involves not only shifts among the dominant aliphatic classes but also the organ-specific presence and layer-dependent allocation of minor constituents. These patterns support the view that even when total wax loads are comparable between EW and IW, petals can exhibit substantial layer-specific partitioning that may be relevant for downstream functional comparisons, as also suggested in studies that physically separated petal wax layers and evaluated their functional roles (Buschhaus et al. 2015). Such differences in the wax composition and crystalline coverage between leaves and petals have also been reported in recent multispecies comparisons, aligning with the broader tendency of floral surfaces to adopt compositional strategies that are distinct from those of leaves (Tunstad et al. 2024).
The carbon chain length distributions further reinforced organ- and layer-specific differences (Fig. 3). Petal alkanes were mainly concentrated in the C17–C24 range, clearly distinguishing them from leaf alkanes, which exhibited pronounced peaks at C26 in both EW and IW. Fatty acids were centered on C18 in the leaves, whereas the petals showed C28 dominance, with an expanded distribution from C18 to C28. Primary alcohols were present at very low levels in the leaves but increased in the petals, particularly in IW, with major chain lengths at C32 and C34. Reports that alkane chain length distributions differ by organ and may emphasize longer chains in leaves have also been presented in comparisons of rose leaves and petals, providing a useful context for interpreting the organ-specific patterns observed in this study (Cheng et al. 2019). Moreover, it has been reported that the wax composition, including the compound class and carbon chain length, can influence wax self-assembly and crystallization on the surface, which in turn can lead to differences in the surface microstructure (Koch and Ensikat 2008).
SEM revealed abundant wax crystals on the leaf surfaces, producing a rough surface texture, whereas the petal surfaces showed few distinct crystals and exhibited relatively smooth textures. This morphological contrast is consistent with the high wax load and alkane-centered composition of leaves, conditions often associated with wax crystallization and pronounced surface structuring (Koch and Ensikat 2008). In addition, multispecies comparisons reporting sparse crystalline structures on the petals suggest that the morphological pattern observed here may not be restricted to a single species (Tunstad et al. 2024). Collectively, these organ- and layer-resolved quantitative results establish a reference dataset for P. ‘Mantefon’ that can be used to guide subsequent functional testing of organ-specific surface traits.
Conclusion
This study establishes an organ- and layer-resolved quantitative dataset of cuticular waxes in the leaves and petals of P. ‘Mantefon’ by comparing fractions enriched in EW and IW. The results show that wax organization is strongly dependent on organ identity and the wax layer, with leaves characterized by a high load and an alkane-dominant profile and petals characterized by lower total wax loads but pronounced layer-dependent redistribution among major compound classes. Notably, a detectable triterpenoid fraction was observed exclusively in petals, highlighting a petal-specific compositional feature within this cultivar. Together with organ-specific carbon chain length signatures and SEM supported differences in crystalline coverage, the results here support the consideration of cuticular wax as an organ-specific surface trait and provide a quantitative reference dataset for future functional studies in indoor horticultural conditions.
