

Introduction
Review and Development of Plant Quality Indices
Revisiting the Dickson quality index: evaluation and development
Evaluation of the compactness index and proposal of applied variants
Evaluation of the shoot-to-root ratio and development of extended versions
Development and proposal of additional plant quality indices
Proposal of integrated morphophysiological plant quality indices
Conceptual Design and Analytical Framework
Study design overview, definition of archetypes, and plant size
Basic quantitative parameters, units, and plant quality indices
Data analysis and software environment
Conceptual Demonstration and Comparative Insights
Analysis of plant quality indices according to plant archetype and size
PCA-based evaluation of plant quality indices
Correlations among plant quality indices and cluster analysis
Synthesis, Limitations, and Practical Implications
Conceptual integration and archetype-specific interpretation of plant quality indices
Potential applications of the plant quality indices
Introduction
Throughout the centuries-long history of horticulture, agriculture, and forestry (Holmes 1975; Sansavini 2008; Cohen 2009; Jones et al. 2021), the development of methods capable of comprehensively evaluating plant growth performance has remained a central focus (Poorter and Garnier 1996; Egerton 2008; El-Sharkawy 2011).
From the intuitive selection of seedlings by ancient farmers to modern plant physiology experiments conducted in precisely controlled environments, efforts to quantify, compare, and predict plant quality have advanced along with scientific progress (Poorter and Garnier 1996; Abbott 1999; Poorter and Sack 2012). The standard concept of plant quality includes a number of measurable parameters, including biomass (e.g., dry weight) allocation, morphological stability, structural completeness, and physiological soundness. Despite remarkable advances in genetic tools (Baginsky et al. 2010; Poczai et al. 2013), remote sensing technologies (Bannari et al. 1995; Xue and Su 2017; Park et al. 2024; Jang et al. 2025), and chlorophyll fluorescence techniques (Park et al. 2023c; Lim et al. 2024; Yang et al. 2024; Ha et al. 2025; Kim et al. 2025b), most indices used to evaluate plant quality remain largely based on conventional indices developed decades ago (Jolliffe et al. 1982).
Among the standard indices of plant quality, the Dickson quality index (DQI) proposed in the mid-20th century remains one of the most widely adopted (Dickson et al. 1960). This index integrates the parameters of plant size and biomass into a single numerical value, thus serving as a useful tool for quantifying plant quality (Seo et al. 2018; Alonso et al. 2024; Guo et al. 2024; Musa and Sahoo 2025). The DQI has been extensively applied to assess the survival potential and quality of not only tree seedlings (Bayala et al. 2009; Binotto et al. 2010; Mota et al. 2018; Güney et al. 2020) but also food crops (Aakash et al. 2022) and horticultural crops (Lin et al. 2019; Park et al. 2023a; Wi et al. 2024; Lee et al. 2025a, 2025b). In addition to the DQI, classical indices such as the compactness index, sturdiness quotient (SQ), shoot-to-root ratio (S/R), and relative water content (RWC; or relative moisture content) have long served as practical tools for evaluating plant robustness and quality (Poorter and Sack 2012; Song et al. 2014; Nyoka et al. 2018; Lee and Nam 2023a, 2023b; Choi et al. 2024b; Kim et al. 2024d; Bae et al. 2025). For example, compactness, calculated as the ratio of the shoot dry weight to shoot height, is used to assess shoot robustness; SQ serves as an auxiliary index for comparing seedling sturdiness; the S/R ratio is widely employed to analyze biomass allocation patterns between aboveground and belowground organs under different experimental conditions; and RWC is used as a reliable measure of the water storage capacity of individual plants.
While these conventional measures of plant quality remain highly useful, the scope of modern experiments on plant physiology has considerably advanced (Raikhel 2001). Knowledge of the diversity of plant groups and growth conditions has increased, revealing the limitations of using only a few plant quality indices to capture the multifaceted characteristics of plant quality (Currey et al. 2011). For example, emerging experimental settings, such as light-emitting diode (LED) spectral regulation, soilless hydroponic cultivation, and remote sensor-based growth monitoring, produce complex datasets that cannot be adequately evaluated using only conventional plant quality indices (Brisco et al. 1998; Amzallag 2001; Hunt et al. 2002; Shahid et al. 2018; Khan et al. 2020; Kim et al. 2024d; Shin et al. 2024; Lozano-Castellanos et al. 2025). Consequently, current concepts of plant quality extend beyond simple measures, such as the shoot height or biomass components (e.g., shoot and root biomass). A broader range of growth parameters has been examined (Prusinkiewicz 2004; Hilty et al. 2021; Jang et al. 2023; Ahn et al. 2024), including organ-specific biomass allocation patterns, the efficiency of morphological development, alterations in structural traits, and water content analyses (Ingestad and Agren 1991; Ramadan 2024; Inthima and Supaibulwatana 2025; Yan et al. 2025).
From this perspective, it is necessary to re-evaluate the current framework for plant quality assessment and develop novel, flexible plant quality indices applicable based on traits measurable under field and laboratory conditions. The present study was designed as a proof-of-concept analysis using synthetic datasets to examine several widely used plant quality indices and to critically evaluate their mathematical structures, physiological bases, and applicability. Additionally, we propose new plant quality indices, derived from combinations of fundamental yet highly relevant growth and physiological parameters, in this case the plant size, biomass components, number of leaves and branches, maximum quantum yield (Fv/Fm), and normalized difference vegetation index (NDVI). To our knowledge, these specific formulations/definitions have not been previously reported. We constructed these indices to enable straightforward interpretations of the measured parameters while ensuring physiological validity, defined as a strong correlation with underlying growth inputs in the synthetic dataset. Although the analyses are based on synthetic datasets, this study provides a conceptual framework for the development and evaluation of plant quality indices that can be tested and refined using empirical data in future studies.
Through this approach, we aimed to enhance reproducibility and interpretability, not only in controlled experimental settings but also in practical cultivation environments, thereby contributing to the establishment of an adaptable plant quality assessment framework applicable to a wide range of plant taxa and cultivation conditions. By integrating established knowledge with new perspectives, this study provides a foundation for a comprehensive and flexible plant quality evaluation system that may be evaluated, tested, and refined across diverse plant species, sizes, and research contexts.
Review and Development of Plant Quality Indices
Revisiting the Dickson quality index: evaluation and development
As a starting point, Table 1 summarizes all plant quality indices discussed in this review, including their names, abbreviations, and mathematical definitions, providing a common terminology for the sections that follow. Among these indices, the “Dickson quality index” (DQI) has long served as a cornerstone metric for nursery seedling quality assessment.
Table 1.
Names, abbreviations, and mathematical definitions of the 16 plant quality indices used in this study
| Numbersz | Plant quality index namesy | Equations |
| 1 | Dickson quality index (DQI) | |
| 2 | Balanced morpho-structural index (BMSI) | |
| 3 | Shoot-root efficiency index (SREI) | |
| 4 | Dickson quality index′ (DQI′) | |
| 5 | Compactness | |
| 6 | Compact biomass index (CBI) | |
| 7 | Compactness′ | |
| 8 | Top-heavy index (THI) | |
| 9 | Root investment ratio (RIR) | |
| 10 | Morphological complexity index (MCI) | |
| 11 | Leaf efficiency index (LEI) | |
| 12 | Simple growth quality index (SGQI) | |
| 13 | Structural stability index (SSI) | |
| 14 | Integrated morphophysiological index (IMI) | |
| 15 | IMI with morphological component (IMImorpho) | |
| 16 | IMI with morphophysiological component (IMItotal) |
zAll plant quality indices listed in this table are arranged in the same order as previously described in the “Review and Development of Plant Quality Indices” section.
yThe Dickson quality index (DQI) was developed by Dickson et al. (1960); the origins of DQI′ (also called the “seedling index”, “composite index”, or DQI) and compactness′ are unclear, but DQI′ has been found in a number of studies, including Bai et al. (2014), Liu et al. (2023), Kim et al. (2024a), and Lee et al. (2025c); compactness′ has also been found in the literature, for example, Kim et al. (2024a), Lee et al. (2024a) and Lee et al. (2025c). The precise origin of the compactness index could not be determined. All other plant quality indices in this study were newly proposed herein.
Historically, this index originated in the mid-20th century, when Dickson et al. (1960) proposed several calculations for evaluating the quality of nursery seedlings used in forestry. One of the equations presented in their paper later became known as the DQI, even though the original authors did not use this term, with the designation DQI emerging only in subsequent literature. This index is calculated as follows:
The index was originally developed to assess the seedling quality of white spruce (Picea glauca) and white pine (Pinus strobus) in a forestry context (Dickson et al. 1960). In forestry, almost all species of interest possess well-defined stems, and stem-related traits are considered critical quantitative parameters (Grossnickle 2012). In contrast, many horticultural crops, including numerous vegetables, floricultural crops, ornamental foliage plants, and succulents, exhibit a rosette growth form in which the presence or clear demarcation of a stem is often ambiguous (Griffiths and Males 2017; Sun et al. 2018; Dos Santos et al. 2022; Khanh et al. 2023, 2024).
In vegetables and floricultural crops such as spinach (Spinacia oleracea), Chinese cabbage (Brassica rapa ssp. pekinensis), parsley (Petroselinum crispum), African violet (Saintpaulia ionantha), and species of Viola, Hosta, and Primula, the stem is often obscured or morphologically ambiguous owing to the presence of rosette-like leaf arrangements or compressed shoot structures. Notably, in succulents and xerophytic genera, such as Echeveria, Haworthia, Gasteria, Agave, Tillandsia, Ariocarpus, Sempervivum, and Orostachys, the stem may be poorly defined or only visible when all leaves are removed (Nam 2024). In such cases, the direct application of the original DQI can be problematic because the index presupposes stem diameter as an essential component. This limitation constrains interpretability when applied to taxa in which the stem is indistinct or exhibits substantial morphological variability, thereby motivating the development of alternative plant quality indices that are adaptable to a wider range of growth forms.
To address this issue, the stem diameter term in the DQI can be replaced with shoot width, allowing the index to be effectively applied to rosette-type plants. Here, shoot width refers to the maximum horizontal span of the aerial parts measured externally. In rosette-type plants with multiple shoots, the widest canopy extent is used as a representative value. However, given the morphological diversity of plant species, researchers may adjust this criterion according to the structural characteristics of the taxa under investigation. Shoot width, together with shoot height (or shoot length), reflects the light interception strategy of the plant, the canopy architecture, and the spatial occupancy efficiency (Niinemets et al. 2006). A relatively wide canopy area suggests greater potential for photosynthesis, thus serving as a meaningful indicator of plant performance (Wells 1991; Niinemets 2007). Because spatial occupancy patterns are closely linked to photosynthetic potential, incorporating shoot width into quality assessments has strong theoretical justification (Wells 1991).
The proposed modified index, termed the “balanced morpho-structural index” (BMSI), given that it corrects the limitations inherent in the original DQI, may also be referred to as the “modified Dickson quality index” (MDQI). This modification enhances the flexibility of the application, enabling its use across a wide range of horticultural research contexts where diverse plant growth forms are encountered. The BMSI is calculated as follows:
Cactaceae species (e.g., Opuntia, Mammillaria, and Rebutia), as well as certain members of Euphorbia, Lithops, and Conophytum exhibiting Crassulacean acid metabolism, possess highly attractive morphologies (Nam 2024) that are often morphologically distinct from more conventional plant species (Boke 1980; Opel 2005; Korn 2011; Dorsey et al. 2013; Cabahug et al. 2018).
In these taxa, some organs commonly observed in other plants, such as leaves, may appear to be absent or effectively absent, and in some cases may be replaced by areoles (Altesor and Ezcurra 2003). Due to extreme morphological reductions and succulence, these plants are frequently perceived as geometrically simple forms, often resembling cylindrical or globular shapes, rather than exhibiting differentiated organs. Furthermore, depending on the observer measuring the plant growth parameters, the boundaries or even the existence of stems may be perceived as highly ambiguous.
Such morphological peculiarities indicate that uniform application of the same quality index across all plant groups is not always valid, underscoring the necessity of evaluating index suitability according to structural morphology.
In situations where such issues arise, it is proposed that stem diameter or shoot width be excluded from the index. As an alternative, we propose the “shoot-root efficiency index” (SREI), calculated as follows:
This index is expected to be broadly applicable to almost all vascular plant species, except for extremely specialized cases, such as Taeniophyllum, which completely lacks a shoot system (Suetsugu et al. 2023), and Dendrophylax lindenii, in which the shoot system appears to be effectively absent (Hoang et al. 2017). Importantly, except for these rare exceptions, the SREI can be applied even when morphological traits such as the presence of stems are ambiguous, particularly in cases where the DQI or BMSI are not suitable. Thus, the scope of applicability of plant growth indices is expanded by enabling comparisons of relative growth efficiency across diverse plant forms. Moreover, because the calculation of the index places greater emphasis on the shoot height of the plant, it is particularly suitable for rosette-type leafy vegetables and ornamental foliage plants, where evaluations of shoot systems are often complicated by stem ambiguity.
In addition, while various versions of the DQI employ the same basic quantitative parameters, these differ in terms of their structural formulation. Examples of such approaches include work by Kim et al. (2024a) on Salvia miltiorrhiza cultivated under LED lights of different quality levels in a plant factory system and a study by Lee et al. (2025c) that applied various concentrations of auxinic rooting promoters to stem cuttings of Hedera algeriensis cv. Gloire de Marengo. Notably, Kim et al. (2024a) and Lee et al. (2025c) explicitly referred to the variant calculation described below as the DQI. In other studies, researchers used the same type of calculation under the generic designation “seedling index” without specifying a distinct name (Bai et al. 2014; Liu et al. 2023), and the provenance of this terminology remains unclear. Bai et al. (2014) used the term “seedling index” or “composite index” in a broad and somewhat ambiguous sense, referring collectively to more than ten different formulas as opposed to providing a single consistent definition. These inconsistencies underscore the need for clearer terminology and standardized definitions in future studies. The calculation of this index, here provisionally referred to as the “DQI′”, is as follows:
In this case, the requirement of a thicker stem relative to the plant size emerges as a distinguishing feature compared to the conventional DQI. Consequently, such variant calculations alleviate some of the structural constraints of the original DQI, offering an alternative interpretive framework that may be more flexible across morphological categories. For practical implementation, the shoot length term may be replaced with shoot height in upright-form or rosette-type species.
This index has also been shown to be effective for evaluations of plant quality (Kim et al. 2024a; Lee et al. 2025c); plant treatments exhibiting superior basic quantitative parameters have yielded significantly higher values when calculated using these indices (Liu et al. 2023; Kim et al. 2024a; Lee et al. 2025c). Thus, these indices address the inherent practical limitations of the DQI while providing effective evaluations of plant quality.
By applying the DQI, BMSI, and SREI simultaneously to rosette-type plants with measurable stems, upright herbaceous species, and stem-thickening crops (such as woody plants), researchers can analyze the changes in index values according to their morphological characteristics. Moreover, if individuals showing low values in the conventional DQI exhibited relatively high values in the BMSI or SREI, this could serve as evidence that the respective index more appropriately reflects quality in certain morphological groups. These findings would provide empirical indicators that demonstrate that each index captures distinct structural and morphological traits beyond simple numerical comparisons. As shown in other studies, the variant provisionally referred to as the DQI′ in this study could also be referred to simply as the “seedling index” or “composite index” (Bai et al. 2014; Liu et al. 2023) or, in the case of a variant of the BMSI, it may be more appropriately designated as the “balanced morphology-mass index” (BMMI).
Evaluation of the compactness index and proposal of applied variants
“Compactness”, a plant quality index used to indicate the structural integrity of shoots, has been widely used in various studies (Jeong et al. 2020; Yun et al. 2023; Bae et al. 2025; Go et al. 2025; Hwang et al. 2025). Compared with the DQI, the compactness index is relatively less standardized, and in some studies, it has been applied with alternative interpretations and parameter combinations (Sour et al. 2025; Vonlanthen et al. 2025).
A relatively high compactness value is generally interpreted as representing that a plant possesses substantial shoot biomass (e.g., shoot dry weight) relative to shoot size, whereas a low mean value can serve as a diagnostic tool for detecting abnormal symptoms, such as excessive elongation of the shoot (Nam et al. 2022; Liu et al. 2023; Choi et al. 2024a). The usual calculation of compactness is given below.
Despite its simplicity, this morphological index can effectively represent shoot density; however, it is structurally limited in that it considers only shoot height. For example, when comparing plants with similar shoot heights but different morphologies (plant habit), such as rosette-type floricultural species (e.g., Viola), upright-habit species (e.g., Antirrhinum), or upright fruiting vegetable crops (e.g., Solanum lycopersicum and Capsicum annuum), shoot width and leaf arrangement differ considerably. Therefore, compactness, which is highly useful when comparing treatments within the same species, does not adequately capture interspecific morphological diversity, which may lead to underestimations or overestimations of the photosynthetic potential or structural stability. This limitation may be less relevant in monoculture-based horticultural production, where comparisons are usually made within a single species. However, in broader ecological or restoration contexts, such as mixed plantings, agroforestry systems, or community-level assessments, accurate indices that can evaluate plant quality across different morphological groups become more useful.
This suggests that relying solely on compactness as a quality index may be inappropriate for horticultural plant groups with high morphological diversity (Spani et al. 2025). Accordingly, we propose a new plant quality index, the “compact biomass index” (CBI), which offers a more comprehensive assessment of plant density.
The CBI incorporates shoot width in addition to shoot height, thereby enabling a comprehensive assessment of spatial occupancy efficiency that conventional compactness fails to capture. For example, in rosette-type plants, wider shoot widths are directly associated with an increased potential photosynthetic surface area, and spatial occupancy patterns are closely linked to future growth potential (De Vylder et al. 2012; Weraduwage et al. 2015). By incorporating shoot width, the CBI provides a more integrated representation of the plant morphological structure. Moreover, because the formula also incorporates total dry weight, it allows for comparisons of total biomass production relative to shoot area, making it a useful indicator.
An additional advantage of the CBI is that, similar to compactness, it can be calculated based solely on simple measurements (i.e., shoot height, shoot width, and total dry weight). This makes it suitable for relatively rapid quality assessments, not only in laboratory settings but also at nurseries, production sites, and for ornamental tree selection. In particular, observing increases or decreases in index values is expected to be effective for the early detection of elongation caused by heat stress, low-light conditions, or excessive nitrogen fertilization, as well as for use as a marketability index for ornamental plant species and leafy vegetables.
In future studies, CBI values for diverse growth forms (e.g., rosette, upright, and creeping types) should be obtained and correlations investigated with respect to other quality indices, such as compactness, the DQI, and the BMSI. This will facilitate the establishment of optimal CBI ranges for specific crops and cultivation environments. Through such efforts, the CBI could be developed into a universal and practical quality index capable of fairly comparing and evaluating plant groups with different morphological traits.
In addition to the CBI, a variant version of compactness in which shoot dry weight is multiplied by shoot height has been applied in previous studies, i.e., Kim et al. (2024a) and Lee et al. (2025c); Lee et al. (2024a) also applied this variant, with air plants (Tillandsia ionantha) grown under different LED light treatments in non-substrate and restricted irrigation conditions. This modified index, also referred to as “compactness′”, is expressed as follows:
Unlike the original compactness index, which simply evaluates the structural soundness of the shoot, compactness′ can serve as an indicator of the more absolute growth of individual plants. This makes it more suitable for breeding and cultivation strategies aimed at achieving larger plant sizes than for selection processes that prioritize density. In particular, it is expected to have high utility in research on forage and bioenergy crops, where the rapid accumulation of biomass and growth of the plant within a short period are essential. The literature indicates that this calculation has been labeled “compactness” in some studies (Kim et al. 2024a; Lee et al. 2024a, 2025c), although the calculation differs from the conventional compactness concept. To avoid ambiguity, we suggest referring to the modified metric as “compactness′” or as the “shoot robustness index” (SRI).
Evaluation of the shoot-to-root ratio and development of extended versions
The balance between shoot and root growth is a critical factor in plant quality assessments (Bláha 2021; Zhang et al. 2023). The conventional shoot-to-root ratio (S/R) provides high visibility by expressing this balance as a simple mass ratio (Ko et al. 2017), yet its simplicity imposes clear limitations with regard to its ability to capture both the structural stability and morphological traits of plants (Spani et al. 2025). In particular, elongation and shoot-heaviness can vary greatly depending on the ratio between shoot height and root length (Tumber-Dávila et al. 2022). Given that plant species differ in adaptive strategies for the allocation of above- and below-ground biomass, such variability reinforces the importance of indices capable of capturing these allocation patterns. To address this variability, a new index is proposed, the “top-heavy index” (THI), calculated as follows:
The THI combines the biomass ratio (shoot dry weight/root dry weight) and the length ratio (shoot height/root length), allowing the simultaneous assessment of both the biomass distribution and morphological imbalance. Higher THI values indicate that a greater proportion of mass is concentrated in the upper structure, with relatively poor root development. This index is expected to be particularly useful under conditions that are likely to induce shoot elongation, such as light quality (e.g., monochromatic green light irradiation and changes in the red/far-red ratio), plant growth regulator treatments (e.g., exogenous GA3), and variations in planting density.
For example, plants treated with GA3 often show increased shoot heights but relatively weak root development. Such GA3-induced elongation patterns have been reported in a previous study (Lee et al. 2023) and would be expected to increase THI when evaluated using the proposed index, thereby enabling early detection of elongation-related damage. Future studies should compare the THI with the conventional S/R ratio and DQI to analyze their correlations in evaluations of elongation and structural stability, and to establish crop-specific threshold values.
The THI emphasizes imbalances between shoot and root allocation; however, it does not fully capture the extent of root development. Root growth is integral to the water and nutrient uptake capacity of the plant (Cochavi et al. 2020) and thus serves as a critical determinant of post-transplant establishment and stress tolerance (Struve 2009; Park et al. 2023b; Lee and Nam 2024). Conventional mass-based indices, such as the root mass fraction (RMF) and the ratio of the root to shoot mass (R/S) (Freschet et al. 2015; Ko et al. 2017), fail to fully account for root development (e.g., root length). To address this gap in the literature, a new index that fully evaluates root biomass and morphological development is proposed, termed the “root investment ratio” (RIR). It is defined as follows:
The higher the RIR value, the greater the degree of root development relative to shoot development, reflecting a superior resource acquisition capacity. This index is expected to be useful to those who assess drought or salinity stress tolerance, analyze the quality of root crops (e.g., Daucus carota, Raphanus sativus, and Beta vulgaris), and predict the establishment success of seedlings for afforestation. For example, even when two plants of the same species and with the same total dry weight differ in terms of their RIR, the individual with longer roots and a greater root fraction would be expected to have higher survival potential under arid conditions. Such variation in the RIR among plants of the same genotype may arise from differences in growing conditions, intrinsic genetic factors, or interactions among these factors. However, before the RIR can be used in this way, verification of this relationship is required. The RIR provides a conceptually simple yet functionally meaningful approach for evaluating root investment.
Development and proposal of additional plant quality indices
As discussed above, the structural complexity of a plant is an important quality factor that cannot be fully explained using simple size or biomass metrics. The number of leaves and branches can be considered key determinants of the potential light-capturing area, reflecting the overall growth strategy under various cultivation conditions (Duncan and Hesketh 1968; Bhagsari and Brown 1986; Fleisher et al. 2006). However, using absolute values alone may cause distortions owing to differences in plant size or species. To address this, a newly proposed plant quality index, the “morphological complexity index” (MCI), is defined as follows:
Logarithmic transformation mitigates the excessive variation caused by very high numbers of leaves or branches, whereas multiplying by the ratio of the shoot height to total dry weight incorporates efficiency considerations. A higher mean value indicates that a plant forms a relatively more complex structure for the same biomass, reflecting the potential light capture, diversity of plant forms, and promotion of branching.
In the future, the MCI should be analyzed in experiments that induce morphological changes, such as auxin and cytokinin treatments, pruning, or dense planting, to identify turning points in morphogenetic strategies. It is expected to be particularly useful in studies of branching-type herbaceous plants, shrubs, and in the selection of ornamental landscape plants.
Although the MCI highlights the structural complexity of the shoot system, it does not directly address the functional efficiency of leaves, which are the primary organs involved in photosynthesis. To complement this perspective, we propose the “leaf efficiency index” (LEI). Leaves are the most important photosynthetic organs; however, the same leaf area does not always guarantee identical productivity (Weraduwage et al. 2015). Considering this, the newly proposed LEI evaluates shoot dry weight per unit leaf area. It is defined as follows:
A higher LEI value indicates that more shoot biomass has been formed, given the same leaf size and number values. In cases where stem or branch biomass constitutes an excessively large proportion of the shoot, the index can alternatively be calculated using leaf dry weight instead of total shoot dry weight. Nevertheless, even when maintained as the shoot dry weight, the index can still serve as a valuable tool for indirectly representing the overall photosynthetic capacity or efficiency of the plant. Consequently, the LEI may provide indirect insights into photosynthetic efficiency and resource allocation patterns, as well as structural traits such as leaf thickness or tissue density. The index is expected to have high utility in studies comparing light quality or intensity, fertilization levels, and water availability. In the future, integrating the LEI with soil plant analysis development (SPAD) readings, assimilation-intercellular CO2 response curves (A/Ci curves), and water use efficiency (WUE) values could facilitate a more comprehensive interpretation of leaf productivity.
In this context, there remains a need in experimental settings for an index capable of quickly and simply assessing the growth efficiency of individual plants. The plant quality index proposed here, the “simple growth quality index” (SGQI), is calculated by dividing the total dry weight by the sum of the shoot height and root length, thereby intuitively indicating the extent of biomass accumulation relative to elongation growth.
A higher SGQI value indicates greater biomass accumulation for the same plant length, indirectly reflecting photosynthetic efficiency, resource use efficiency, and the degree of tissue thickening. The SGQI is expected to be particularly advantageous for large-scale seedling selection, comparative analyses of environmental stress responses, and short-term growth assessments. For example, analyzing SGQI changes between water-stressed and control groups would enable the rapid evaluation of growth inhibition versus compensatory growth. When used in parallel with S/R or its inverse, R/S, the SGQI could help distinguish plant growth strategies more clearly.
Indices such as the SGQI emphasize biomass accumulation and efficiency; accordingly, complementary measures are required to capture structural stability. The structural stability of a plant cannot be fully explained by the stem thickness or shoot height alone. We propose the “structural stability index” (SSI), which treats the product of the shoot width and stem diameter as an indicator of aboveground structural support, dividing it by shoot height to adjust for elongation effects.
The SSI would be useful in crop improvement programs. For example, preventing lodging in crops, such as rice and maize, has long been a critical objective (Xue et al. 2016; Shah et al. 2019; Zhang et al. 2021). Plants with narrow shoots and thin stems, when excessively elongated, are generally considered more susceptible to lodging (Shah et al. 2019; Zhu et al. 2023). Under static loading conditions, a wider shoot width generally enhances stability by lowering the center of gravity and distributing mechanical stress (Xiao et al. 2015). Based on these observations, a higher SSI value can be indicative of greater structural stability against lodging, incorporating the contribution of the crown width to stability, which is overlooked in conventional shoot-height-to-stem-diameter ratios. However, it should be noted that under dynamic loads such as strong winds, the increased aerodynamic drag associated with a wider crown can offset these benefits and potentially increase the risk of lodging.
Nevertheless, the SSI can still serve as a useful morphological indicator for evaluating lodging resistance in food crops, analyzing establishment stability in landscape trees, and predicting wind damage in ornamental trees when interpreted in conjunction with aerodynamic factors. In wind simulation experiments, cultivars with higher SSI values can be interpreted as having greater structural adaptability under moderate wind conditions. Future research should combine the SSI with mechanical strength tests (e.g., bending strength and breaking load) to elucidate the relationship between physical strength and morphological stability, thereby enabling empirical validation.
Proposal of integrated morphophysiological plant quality indices
Conventional plant quality indices tend to rely solely on morphological traits or quantitative parameters such as biomass components, and attempts to incorporate physiological characteristics are relatively rare. However, plant performance in actual cultivation or experimental settings depends not only on structural attributes but also on physiological efficiency (e.g., photosynthetic capacity and stress resilience). Haworth et al. (2023) emphasized that plant physiological traits are central to photosynthetic performance, growth, and resilience to abiotic stress, whereas Zhang et al. (2020) highlighted that stress defense and growth suppression are complementary strategies by which plants respond to adverse environments. Therefore, there is a need for an integrated morphophysiological plant quality index that comprehensively reflects both the morphological balance and physiological soundness. Combining these dimensions within a single metric can provide a holistic and functionally relevant assessment of plant quality. To address the limitations of plant quality indices based solely on morphological parameters, we propose the “integrated morphophysiological index” (IMI), defined as follows:
The IMI focuses on structural balance by incorporating both the ratio of the shoot height to shoot width and the ratio of the shoot dry weight to root dry weight. In addition, Fv/Fm and the NDVI serve as complementary indicators of maximum photochemical efficiency and chlorophyll-related greenness/light-capture potential, respectively, thereby reflecting overall plant vigor (Elgaml et al. 2022).
Here, Fv/Fm denotes the maximum quantum yield of photosystem II (PSII) obtained from a chlorophyll a fluorescence analysis (Stirbet and Govindjee 2011) and reflects the potential energy conversion efficiency of the photosynthetic apparatus (Kim et al. 2024a). This parameter ranges from 0 to 1, with values for healthy, unstressed higher plants typically falling between approximately 0.78 and 0.84 (Muniz et al. 2014; Lee 2023; Shin et al. 2023; Lee et al. 2024b; Hong et al. 2025). It can decrease slightly in response to various stress factors that reduce PSII activity (Ibaraki and Murakami 2006; Lee et al. 2021; Jo et al. 2025; Kim et al. 2025a).
The NDVI is calculated from near-infrared and red reflectance, providing an indirect estimate of the leaf chlorophyll content, greenness, and light capture potential (Pettorelli et al. 2011; Kim et al. 2024b). NDVI values generally range from –1 to 1, but they are typically positive for plant surfaces (Pettorelli 2013; Huang et al. 2021). In contrast, measurements over water surfaces may yield negative values (Huang et al. 2021). However, when measured with proximal sensing devices such as handheld spectroradiometers, the NDVI is obtained at close range and is unaffected by water surface reflectance, atmospheric scattering, or background reflectance, making negative values virtually nonexistent for land covered by healthy vegetation (Govaerts and Verhulst 2010; Stamford et al. 2023). Accordingly, the IMI assumes no potential for negative NDVI values in this context.
According to Tan et al. (2018) and Morales-Gallegos et al. (2023), Fv/Fm and the NDVI are positively correlated, and under normal conditions, both parameters yield positive values. This positive association supports the integration of both metrics into a single plant quality index, as they collectively reflect the structural and physiological aspects of plant vigor. In addition, Jang et al. (2023) highlighted that physiological parameters such as Fv/Fm and the NDVI have the distinct advantage of being measurable rapidly and on demand, unlike conventional biomass-oriented indices that are used to assess plant health.
Both Fv/Fm and the NDVI have been widely applied in plant physiology research, and numerous studies have simultaneously utilized both parameters (Garty et al. 2000; Tan et al. 2012; Kim et al. 2022, 2024c; Wen et al. 2022; Hong et al. 2025; Lee et al. 2025a; Zolin et al. 2025). Incorporating widely used physiological indicators into plant quality indices can enhance their practical utility and enable more accurate and timely assessments across diverse research and cultivation contexts.
In the proposed formula, the total dry weight represents the overall growth level of the plant. By applying a multiplicative structure, the IMI value decreases substantially when either the morphological or physiological components are low, thereby preventing overestimations of plants disproportionately strong in only one aspect. This index is intended to be broadly applicable in principle, but its generality should be empirically validated, not only in food crops but also in horticultural plants, such as rosette-form succulents, high-value leafy vegetables, and ornamental foliage plants, where the structural balance and physiological performance are key determinants of productivity and marketability. In practical terms, because the IMI and its variants explicitly include biomass components, their direct calculation currently requires destructive sampling and is therefore most suitable for research-oriented seedling grading or benchmark trials in which plants can be harvested. Nevertheless, the IMI provides a useful target metric for developing non-destructive (or non-invasive) surrogates: by combining the NDVI (measurable via proximal sensors or remote-sensing platforms) with allometric or imaging-based estimates of biomass, IMI-like scores could in the future be incorporated into high-throughput phenotyping and stress-tolerance screening under greenhouse or field conditions. When used alongside the conventional DQI, the IMI can help re-evaluate high-DQI individuals who exhibit structural imbalances.
The IMI can also be modified depending on the research objectives and environmental conditions. First, a variant in which only the morphological component is subjected to square-root transformation is proposed, as follows:
This modified calculation of the IMI effectively reduces the variability arising from morphological and structural factors while maintaining the sensitivity of the physiological parameters. It is expected to be particularly effective in experiments focusing on differences in physiological responses, such as those involving changes in light quality, light intensity, or nutrient supply. Second, a variant in which the square root is applied to the entire formula is defined as follows:
This formula applies the square root uniformly to all components, which helps reduce the influence of extreme values and stabilize variance, a well-established benefit of square-root transformation in data analysis (Iacobucci et al. 2025). It is expected to enable more stable comparisons in open-field cultivation with large environmental fluctuations, seasonal comparisons, and multi-location trials. The three forms of the IMI described above can be selectively applied according to environmental factors, crop types, the experimental design, and the magnitude of data variability. In future studies, reference ranges should be established for the IMI, the IMI with morphological components (IMImorpho), and the IMI with morphophysiological components (IMItotal) for different crop groups, and the contribution of each parameter should be analyzed. In addition, the predictive ability of the index under long-term growth and environmental stress conditions should be verified through comparisons between predicted index values and observed field data. Through these efforts, the IMI may serve as a candidate integrative index for evaluating plant morphological traits and physiological responses, pending empirical validation.
In the future, in addition to Fv/Fm and the NDVI, it will be necessary to incorporate other parameters into new quality indices. Examples include PIABS, which is a performance index based on absorption used in chlorophyll a fluorescence analyses (Srivastava et al. 1999; Hong et al. 2025; Lee et al. 2025a, 2025b), and spectral vegetation indices from remote sensing that support the interpretation of plant photochemical efficiency rates and chlorophyll concentrations (Kim et al. 2024b; Park et al. 2024; Shin et al. 2024; Hong et al. 2025; Lee et al. 2025a), including the photochemical reflectance index (PRI), the simple ratio (SR), and the modified chlorophyll absorption ratio index (MCARI). In addition, other chlorophyll a fluorescence parameters, such as PItotal, ΦPSII, and ΦNPQ, can provide complementary information regarding overall electron transport efficiency and non-photochemical energy dissipation rates.
Because the plant quality indices we have proposed may vary in terms of sensitivity depending on the environmental conditions, crop groups, and growth stages, it is essential to perform correlation analyses among the indices and evaluate their sensitivity under different conditions. For this purpose, correlation analyses and principal component analyses (PCA) should be conducted to visualize the structural relationships among the indices and assess the distinctiveness and redundancy of the information that each index represents. In addition, differences in index values according to plant morphological archetypes (e.g., rosette, upright, and creeping types) and sizes should be analyzed to determine their applicability to different plant form groups and scales. Such analyses can provide fundamental data for the selection and integration of quality evaluation indices.
Conceptual Design and Analytical Framework
Study design overview, definition of archetypes, and plant size
This study was conducted as a proof-of-concept analysis based on a synthetic dataset to conceptually verify the sensitivity, discriminative power, and correlation structure of both conventional indices (DQI and compactness), variant indices (DQI′ and compactness′), and newly proposed plant quality indices. For this purpose, three fundamental archetypes with distinct morphological contrasts were defined: rosette (represented by Cichorium intybus cv. Asia Sugar; Shin et al. 2024), upright (represented by Coleus cv. Wizard Jade; Park et al. 2024), and creeping (represented by Hedera algeriensis cv. Gloire de Marengo; Lee et al. 2025c) types. For each archetype, small (S) and large (L) variants were included, with the medium size (M) designated as the reference. Each group consisted of 12 synthetic replicates, resulting in a total of nine groups and 108 samples (Fig. 1).
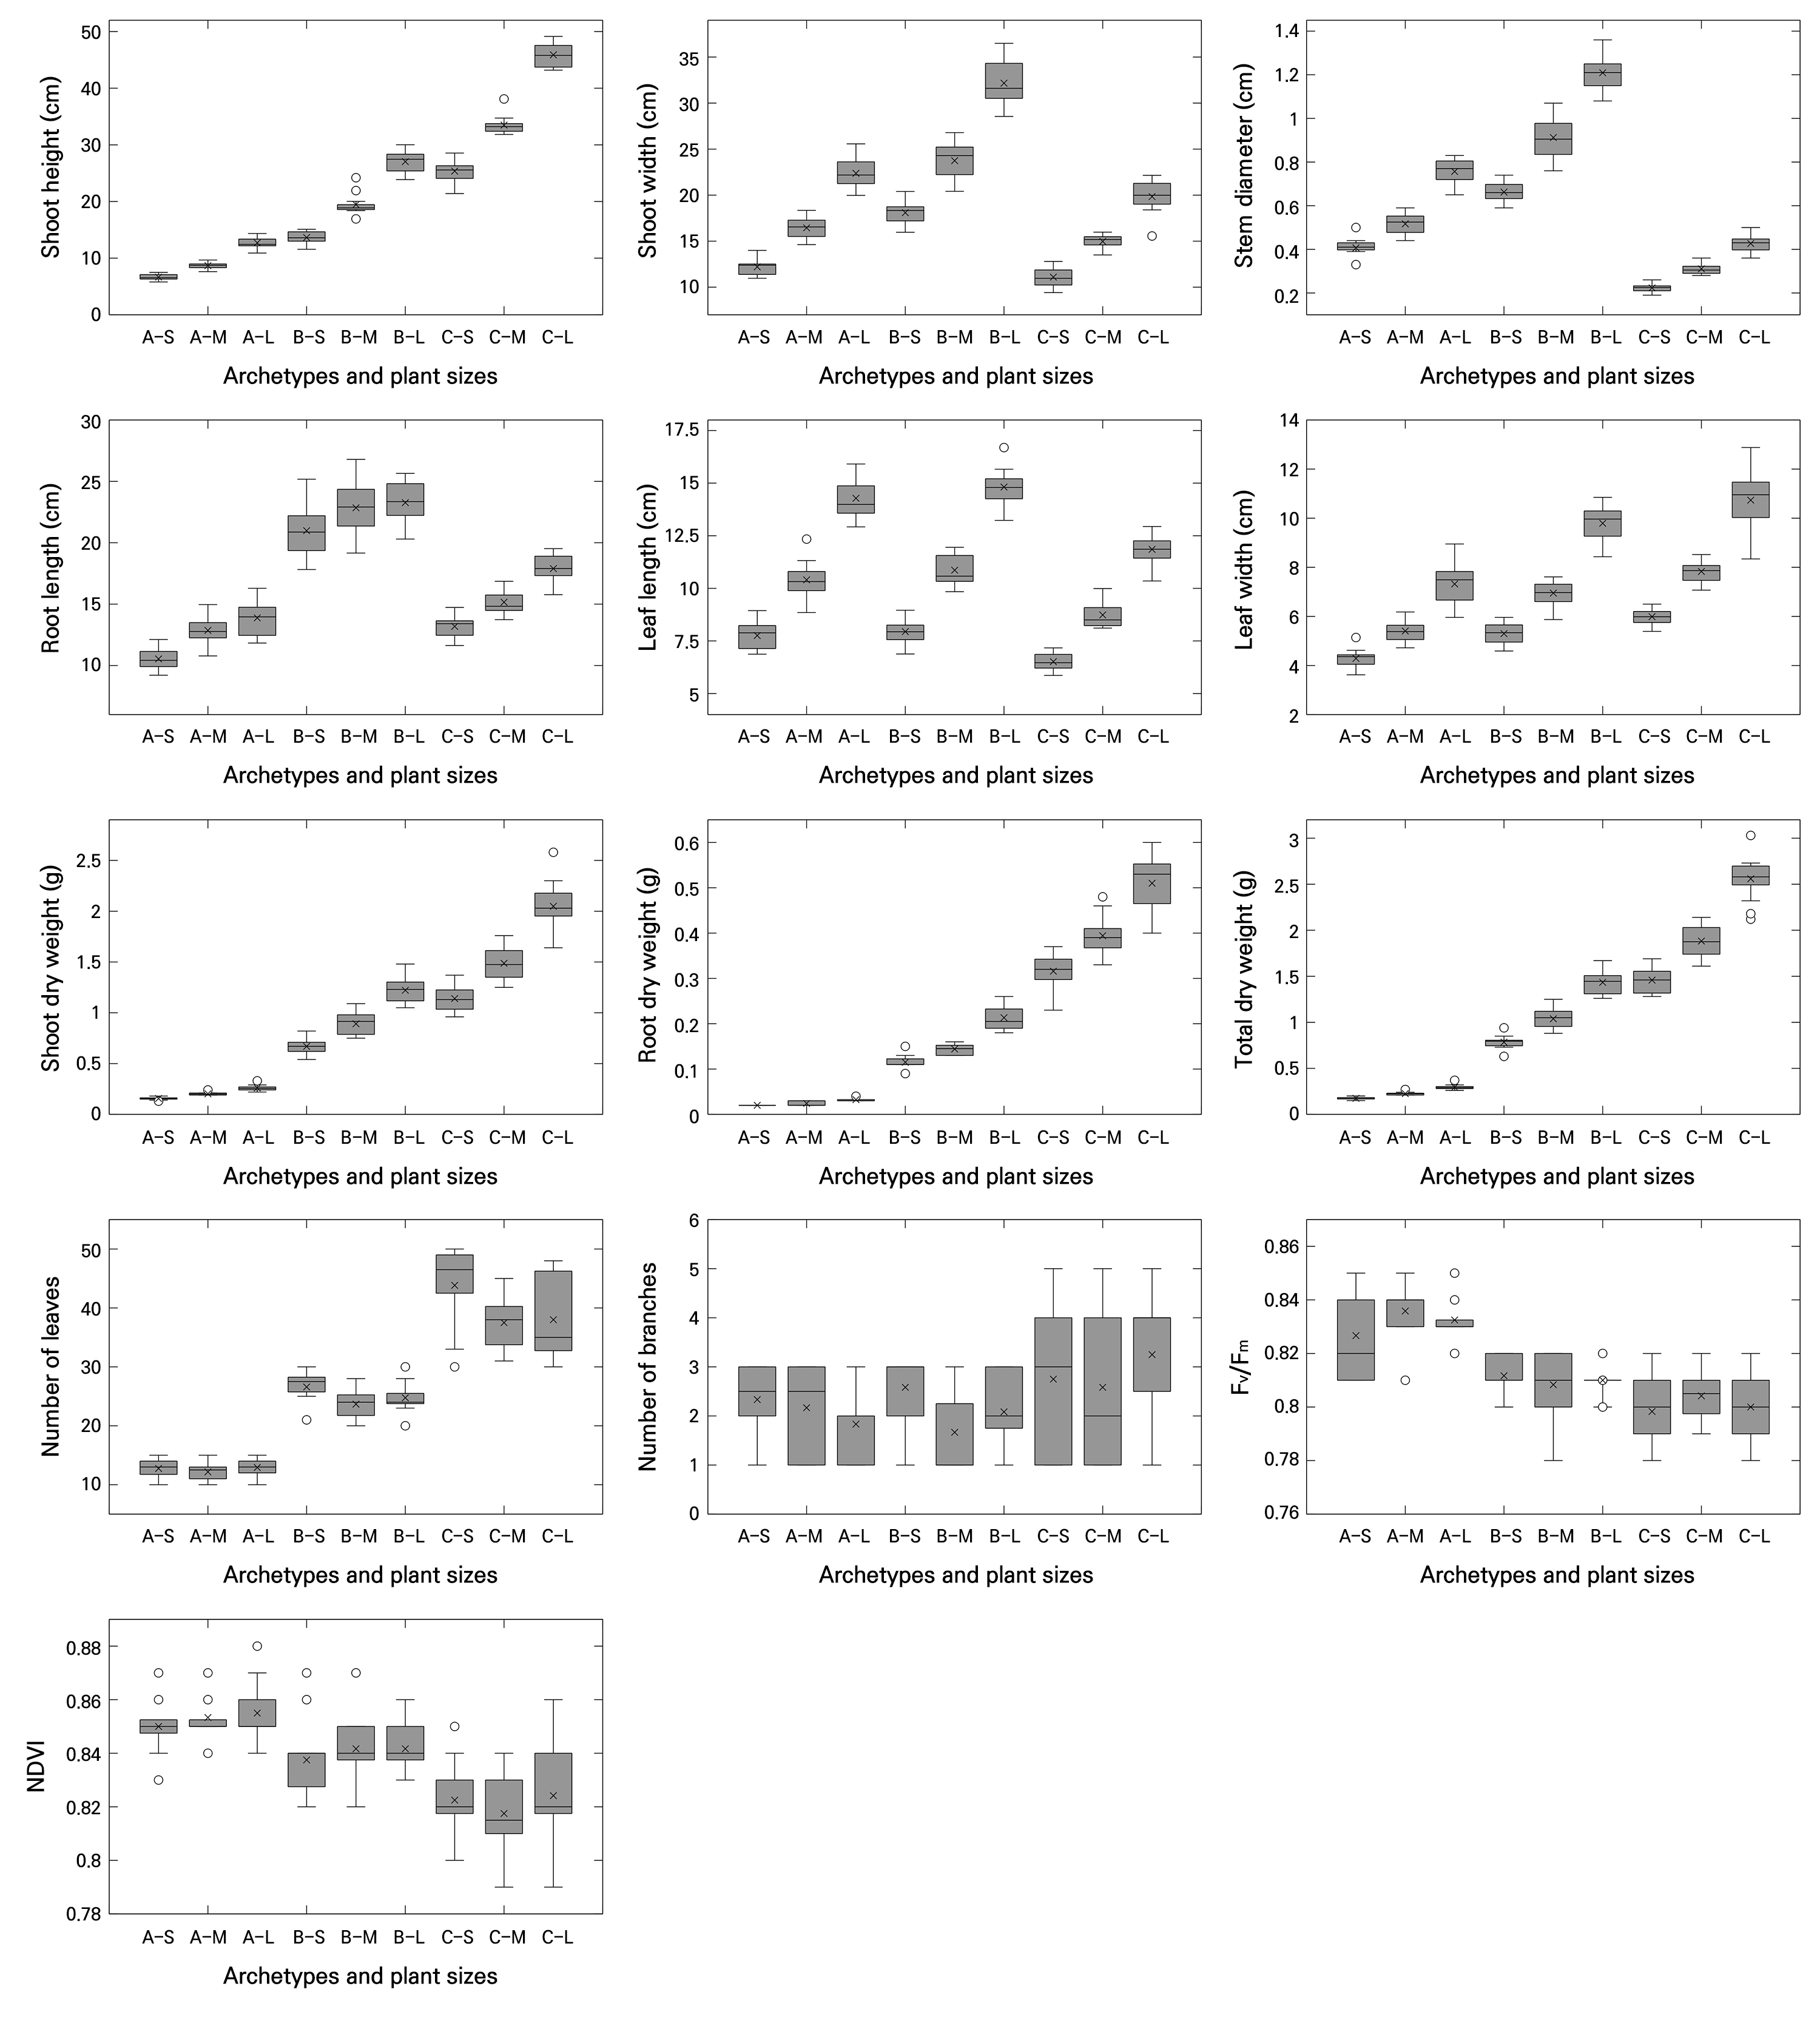
Fig. 1.
Basic quantitative parameters (plant size, biomass components, and number of leaves and branches), maximum quantum yield of photosystem II (Fv/Fm), and normalized difference vegetation index (NDVI) of plants derived from a synthetic dataset, analyzed across combined classifications of plant archetype and size (n = 12). Abbreviations along the x-axis denote combinations of plant archetype and plant size, where A represents the rosette, B the upright, and C the creeping archetypes; S, M, and L indicate small, medium, and large sizes, respectively. In the boxplots, the horizontal line inside each box represents the median (Q2), the “×” symbol indicates the mean, and “◦” symbols denote outliers. The upper and lower edges of the box correspond to the third (Q3) and first (Q1) quartiles, respectively. Whiskers extend to the minimum and maximum values.
Basic quantitative parameters, units, and plant quality indices
The dataset comprised eight morphological parameters: shoot height (cm), shoot width (cm), stem diameter (cm), root length (cm), leaf length (cm), leaf width (cm), number of leaves, and number of branches; three biomass components: shoot dry weight (g), root dry weight (g), and total dry weight (g); and two physiological parameters: Fv/Fm and the NDVI.
The conventional plant quality indices are the DQI and compactness. Variant indices are the DQI′ and compactness′. The newly proposed indices are the BMSI, SREI, CBI, THI, RIR, MCI, LEI, SGQI, SSI, IMI, IMImorpho, and IMItotal.
Morphophysiological parameter values were generated with reference to mean values and ranges reported in the literature (Park et al. 2024; Shin et al. 2024; Lee et al. 2025c) using the random number generator in SAS 9.4 (SAS Institute, USA). For each archetype-size combination, synthetic observations for each variable were sampled from assumed normal distributions whose means and approximate ranges were set based on these literature-based values. A precision of two decimal places was applied to continuous variables, whereas leaf and branch counts were rounded to the nearest integer and recorded without decimals.
Data analysis and software environment
Statistical analyses were conducted in SAS 9.4 (SAS Institute, USA) and Python 3.11 (Python Software Foundation, USA). Two-way analysis of variance (ANOVA) was applied to evaluate the main effects of archetype and plant size factors, as well as their interaction, with significance set to p < 0.05. PCA was conducted after Z-score standardization to ensure comparability across indices with different scales, and no rotation was applied. To examine interrelationships among the indices, Pearson correlation coefficients were computed and subjected to hierarchical clustering using Euclidean distances among correlation-matrix rows with average linkage. In the resulting correlation heatmaps, color intensity represents the Pearson correlation coefficient (r), with red indicating positive (+) correlations and blue indicating negative (–) correlations. Given the sample sizes used in this study (n = 36 within each archetype: rosette, upright, and creeping; and n = 108 for the combined dataset), correlations for which r ≥ 0.33 or r ≤ –0.33 (within each archetype) and r ≥ 0.19 or r ≤–0.19 (combined dataset) are considered statistically significant at p < 0.05 (two-tailed).
Conceptual Demonstration and Comparative Insights
Analysis of plant quality indices according to plant archetype and size
Before proceeding with a detailed explanation, it should be noted that the present analysis was not based on actual cultivation observations but rather on a synthetic dataset designed and generated according to clearly contrasting plant morphological types (i.e., archetypes) and sizes. This approach was adopted as a proof-of-concept to illustrate the conceptual validity of the proposed plant quality indices, their correlation structures, and the outcome trends according to specific parameters. Such synthetic data do not substitute for empirical validation but serve to conceptually demonstrate the behavior of the indices, as previous studies have compared and tested trait characteristics using conceptually designed datasets (Van Kleunen et al. 2010).
At the same time, several composite indices considered in this study, particularly the DQI, compactness, and related morpho-structural metrics, have already been empirically associated with seedling vigor, early post-transplant growth, and field performance in real crops. For example, the DQI and chlorophyll fluorescence-based indicators have been used jointly to assess ornamental seedling quality in Pentas lanceolata under different acclimation regimes (Lin et al. 2019), and the DQI has shown strong relationships with short-term relative growth rate after transplanting in grafted tomato seedlings grown in cylindrical paper pots (Seo et al. 2018) as well as with the early growth of tomato seedlings produced by different nursery systems (Bae et al. 2025). Moreover, in Korean thistle (Cirsium setidens) cultivated under various LED spectral quality treatments (Lee et al. 2025a) and in Korean native Phedimus species cultivated under different photoperiods (Lee et al. 2025b), the DQI and chlorophyll fluorescence indicators were weakly correlated. In forestry and agronomic contexts, DQI-like seedling quality indicators have also been associated with subsequent survival and growth under field conditions (Smirnakou et al. 2017; Gallegos-Cedillo et al. 2021). Thus, the present synthetic, proof-of-concept analysis should be viewed as a complementary step that clarifies the mathematical structure and covariation patterns of existing and newly proposed plant quality indices, while future work will need to validate these indices empirically using data from contrasting species and growth forms.
Three defined plant habits or archetypes (rosette, upright, and creeping) and three sizes (small, medium, and large) were examined using the 16 plant quality indices described above, and the main effects and interactions were analyzed via two-way ANOVA. This analytical framework supports the interpretation of how morphological diversity and plant size factors interact and are ultimately reflected in functional indices (Díaz and Cabido 2001; Weiner 2004).
The results indicated that all 16 indices showed statistically significant differences (p < 0.001) in the plant archetypes (Fig. 2). However, the main effect of plant size exhibited a slight variation depending on the index. Specifically, the DQI, BMSI, DQI′, CBI, THI, RIR, LEI, SGQI, SSI, IMI, IMImorpho, IMItotal, and compactness′ showed very high levels of statistical significance (p < 0.001). The SREI and MCI showed modest significance (p < 0.05), whereas the compactness index showed no significant differences among the plant size factors (p > 0.05). Regarding the interaction between plant archetype and size factors, the SREI, compactness index, THI, RIR, MCI, LEI, and SGQI were not statistically significant (p > 0.05). The IMItotal index showed modest significance (p < 0.05), whereas two other indices (IMI and IMImorpho) were highly significant (p < 0.001).
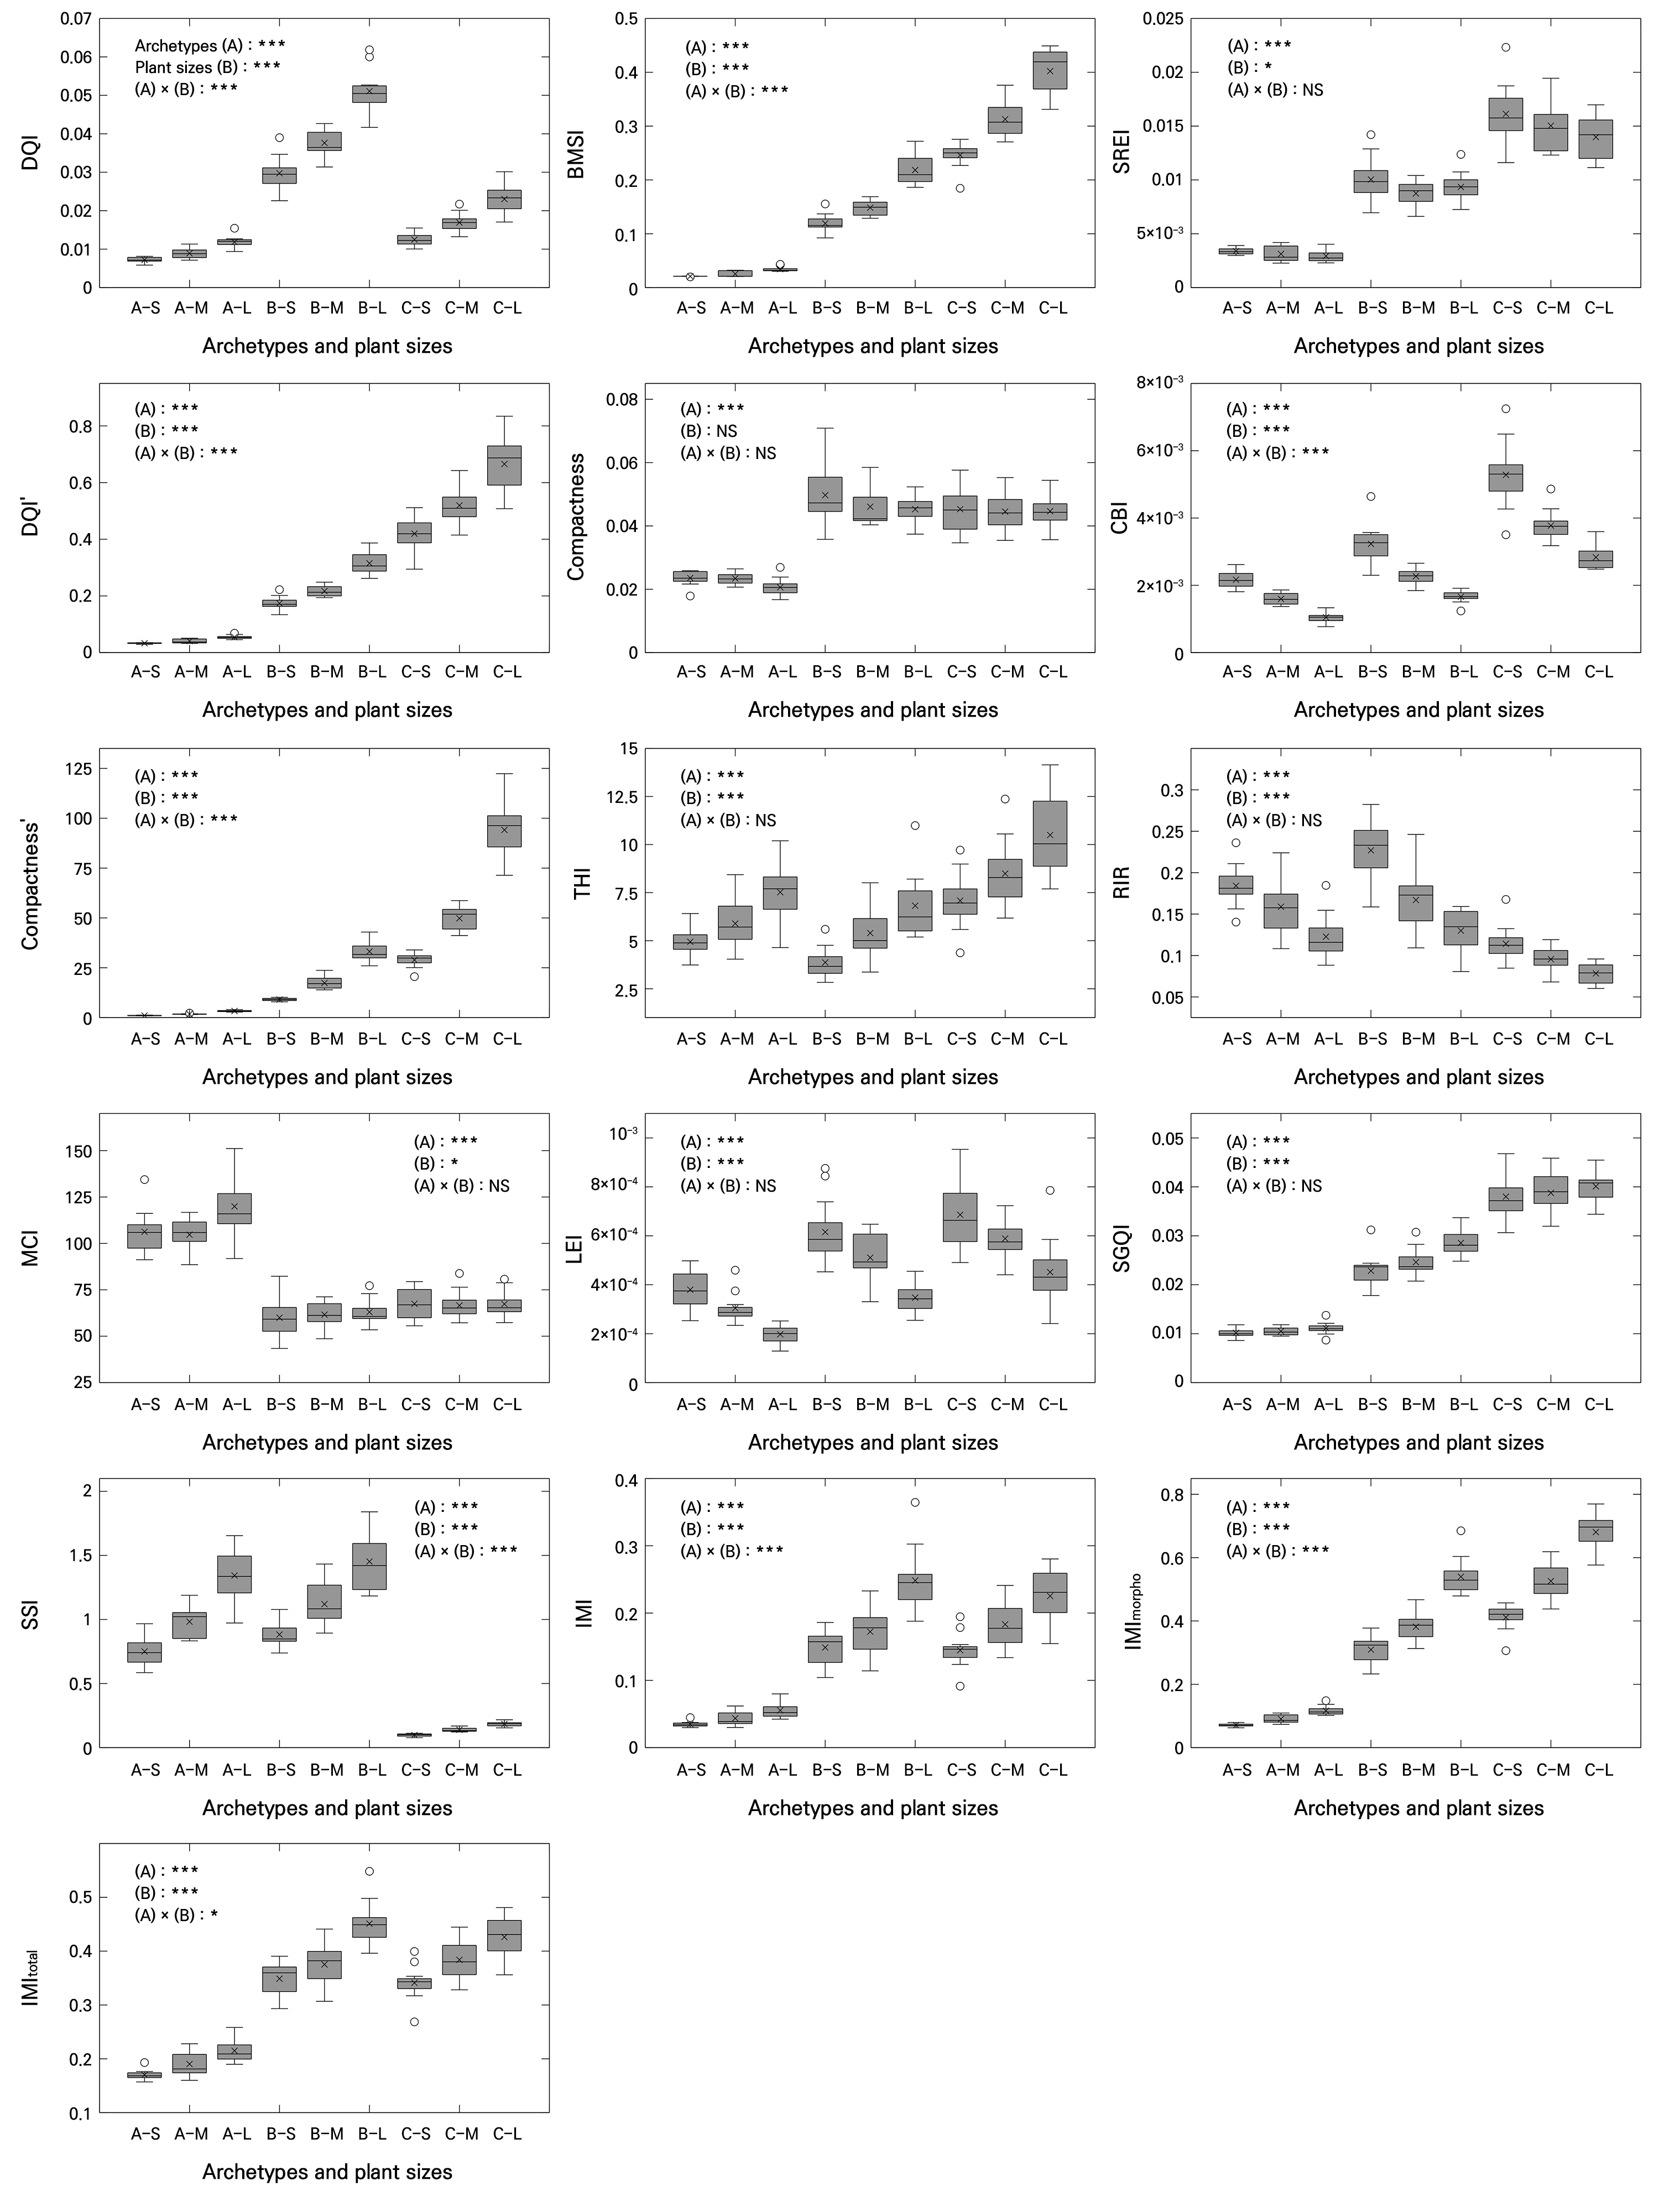
Fig. 2.
Plant quality indices of plants derived from a synthetic dataset, analyzed across combined classifications of plant archetype and size (n = 12). Abbreviations along the x-axis denote combinations of plant archetype and plant size, where A represents the rosette, B the upright, and C the creeping archetypes; S, M, and L indicate small, medium, and large sizes, respectively. In the boxplots, the horizontal line inside each box represents the median (Q2), the “×” symbol indicates the mean, and “◦” symbols denote outliers. The upper and lower edges of the box correspond to the third (Q3) and first (Q1) quartiles, respectively. Whiskers extend to the minimum and maximum values. Statistical significance is denoted as p < 0.05 (*), 0.01 (**), and 0.001 (***), while “NS” indicates non-significant differences. Significance was tested using two-way ANOVA with archetype (A), plant size (B), and their interaction (A × B) Variable names include conventional indices, specifically the Dickson quality index (DQI) and compactness; variant indices, namely DQI′ and compactness′; and proposed indices, namely the balanced morpho-structural index (BMSI), shoot-root efficiency index (SREI), compact biomass index (CBI), top-heavy index (THI), root investment ratio (RIR), morphological complexity index (MCI), leaf efficiency index (LEI), simple growth quality index (SGQI), structural stability index (SSI), integrated morphophysiological index (IMI), variant with square-root applied to the morphological component (IMImorpho), and variant with square-root applied to the full index (IMItotal).
The results of our analysis suggest that plant morphological types and sizes jointly determine structural, physiological, and resource allocation characteristics (Niklas 1994). This is consistent with previous findings from seedling quality studies (Dickson et al. 1960; Bai et al. 2014; Liu et al. 2023) and is also in line with broader physiological perspectives (Hong et al. 2025; Kim et al. 2025c; Lee et al. 2025a, 2025b).
In particular, morphological type (i.e., archetype) exhibited marked differences in the biomass-oriented index group (e.g., DQI, DQI′, BMSI, SGQI, IMI series, and compactness′), in which biomass parameters (e.g., dry weights of the shoot and root and the total dry weight) are the primary determinants. Generally, the upright (group B) and creeping (group C) types showed higher mean values for these indices than the rosette type (group A), suggesting that species with vertical or elongation-type growth models, such as climbing plants, tend to have more efficient shoot growth and biomass accumulation.
In contrast, the morphological stability index group (e.g., MCI) was higher for the rosette type. This reflects the inherent stability of rosette morphology, in which compact, symmetric shoot structures positioned near the ground reduce variations among individuals. This type of architecture also minimizes mechanical stress (Schmid and Harper 1985). Indices belonging to the resource allocation index group (e.g., THI and RIR) revealed contrasting allocation strategies among archetypes. The THI was higher in the creeping type, reflecting greater shoot allocation, whereas the RIR was higher in the upright and rosette types, clearly indicating a more balanced root investment strategy. Such differences among the index groups provide useful insights into divergent resource distribution strategies.
As a result, indices that are biomass-oriented (e.g., DQI, DQI′, BMSI, SGQI, IMI series, and compactness′) tended to increase with the plant size, as greater shoot heights, stem diameters or shoot widths, and total dry weights directly raised the numerator of these indices. However, indices related to proportional stability or efficiency (e.g., compactness, MCI, LEI, and CBI) showed weaker dependence on size, indicating that larger individuals did not necessarily exhibit improved proportional stability or efficiency. This is consistent with the view that excessive shoot elongation in large plants may compromise their structural stability (Niklas 1994).
The THI showed a slight increase with plant size and was closely linked to archetype-dependent shifts in root-shoot allocation (i.e., RIR). The IMI series maintained relatively high mean values except in the rosette type. In large upright plants, morphological ratios (e.g., shoot height-to-width ratio and shoot-to-root ratio) made a strong contribution, whereas in creeping plants, despite having relatively low physiological parameters such as Fv/Fm and the NDVI compared to other types, the combined effects of morphological ratios and biomass normalization maintained the index values. The SSI increased almost linearly with size in the rosette and upright types but showed little variation with size in the creeping type, which also had the lowest mean values overall.
When considering the baseline differences in plant traits by both morphological type and size shown in Fig. 1 and the plant quality indices calculated from them, it became clear that uniformly applying absolute threshold values of plant quality indices across all types was not appropriate. This reinforces the point that despite the substantial morphological diversity among plant species, applying a single uniform index risks oversimplifying structural differences and undermining meaningful assessments. In particular, indices within the biomass-oriented index group (e.g., DQI, BMSI, and IMI series) may require future studies to establish type-specific optimal threshold values. In contrast, one of the indices in the morphological stability index group, the MCI, could be referenced against the baseline value of the rosette type; based on its declining trend, the MCI can be utilized as an indicator of the early detection of structural deterioration.
Furthermore, although increases in plant size are generally advantageous for improving most biomass-oriented indices, they do not necessarily guarantee improvements in morphological stability or efficiency. Therefore, in the production and selection processes, a multi-index evaluation is required to balance yield potential with structural soundness. For example, the BMSI and SGQI can be used to identify individuals with high biomass productivity relative to plant size for yield-oriented breeding or nursery selection, whereas the THI, SSI, and RIR are particularly relevant for applications where lodging risk, mechanical stability, or root investment are critical, such as the production of tall ornamentals, containerized crops, or drought-resilient planting materials. In addition, the interaction effects between archetype and plant size identified in the two-way ANOVA indicated that the optimal size range differed among the types; the upright type benefited from a larger size, whereas the creeping type implied a risk of reduced structural stability when they exceeded a certain size threshold.
PCA-based evaluation of plant quality indices
Because many of the proposed indices share underlying variables, we used PCA to explore how they covary and to identify major axes summarizing their joint behavior. According to the PCA results, the first principal component (PC1) accounted for 60.9% of the total variance, whereas the second principal component (PC2) explained 17.4%, resulting in a cumulative explanatory power of 78.3% for the two axes (Fig. 3). When PC3 was included, the cumulative explanatory power increased to 91.4% (data not shown). PCA has been widely applied to summarize and discriminate plant morphological, physiological, and structural characteristics in multidimensional spaces (Alcántara-Ayala et al. 2020; Mohi-Ud-Din et al. 2021). The proposed indices could also effectively visualize the correlation structure and cluster separation.
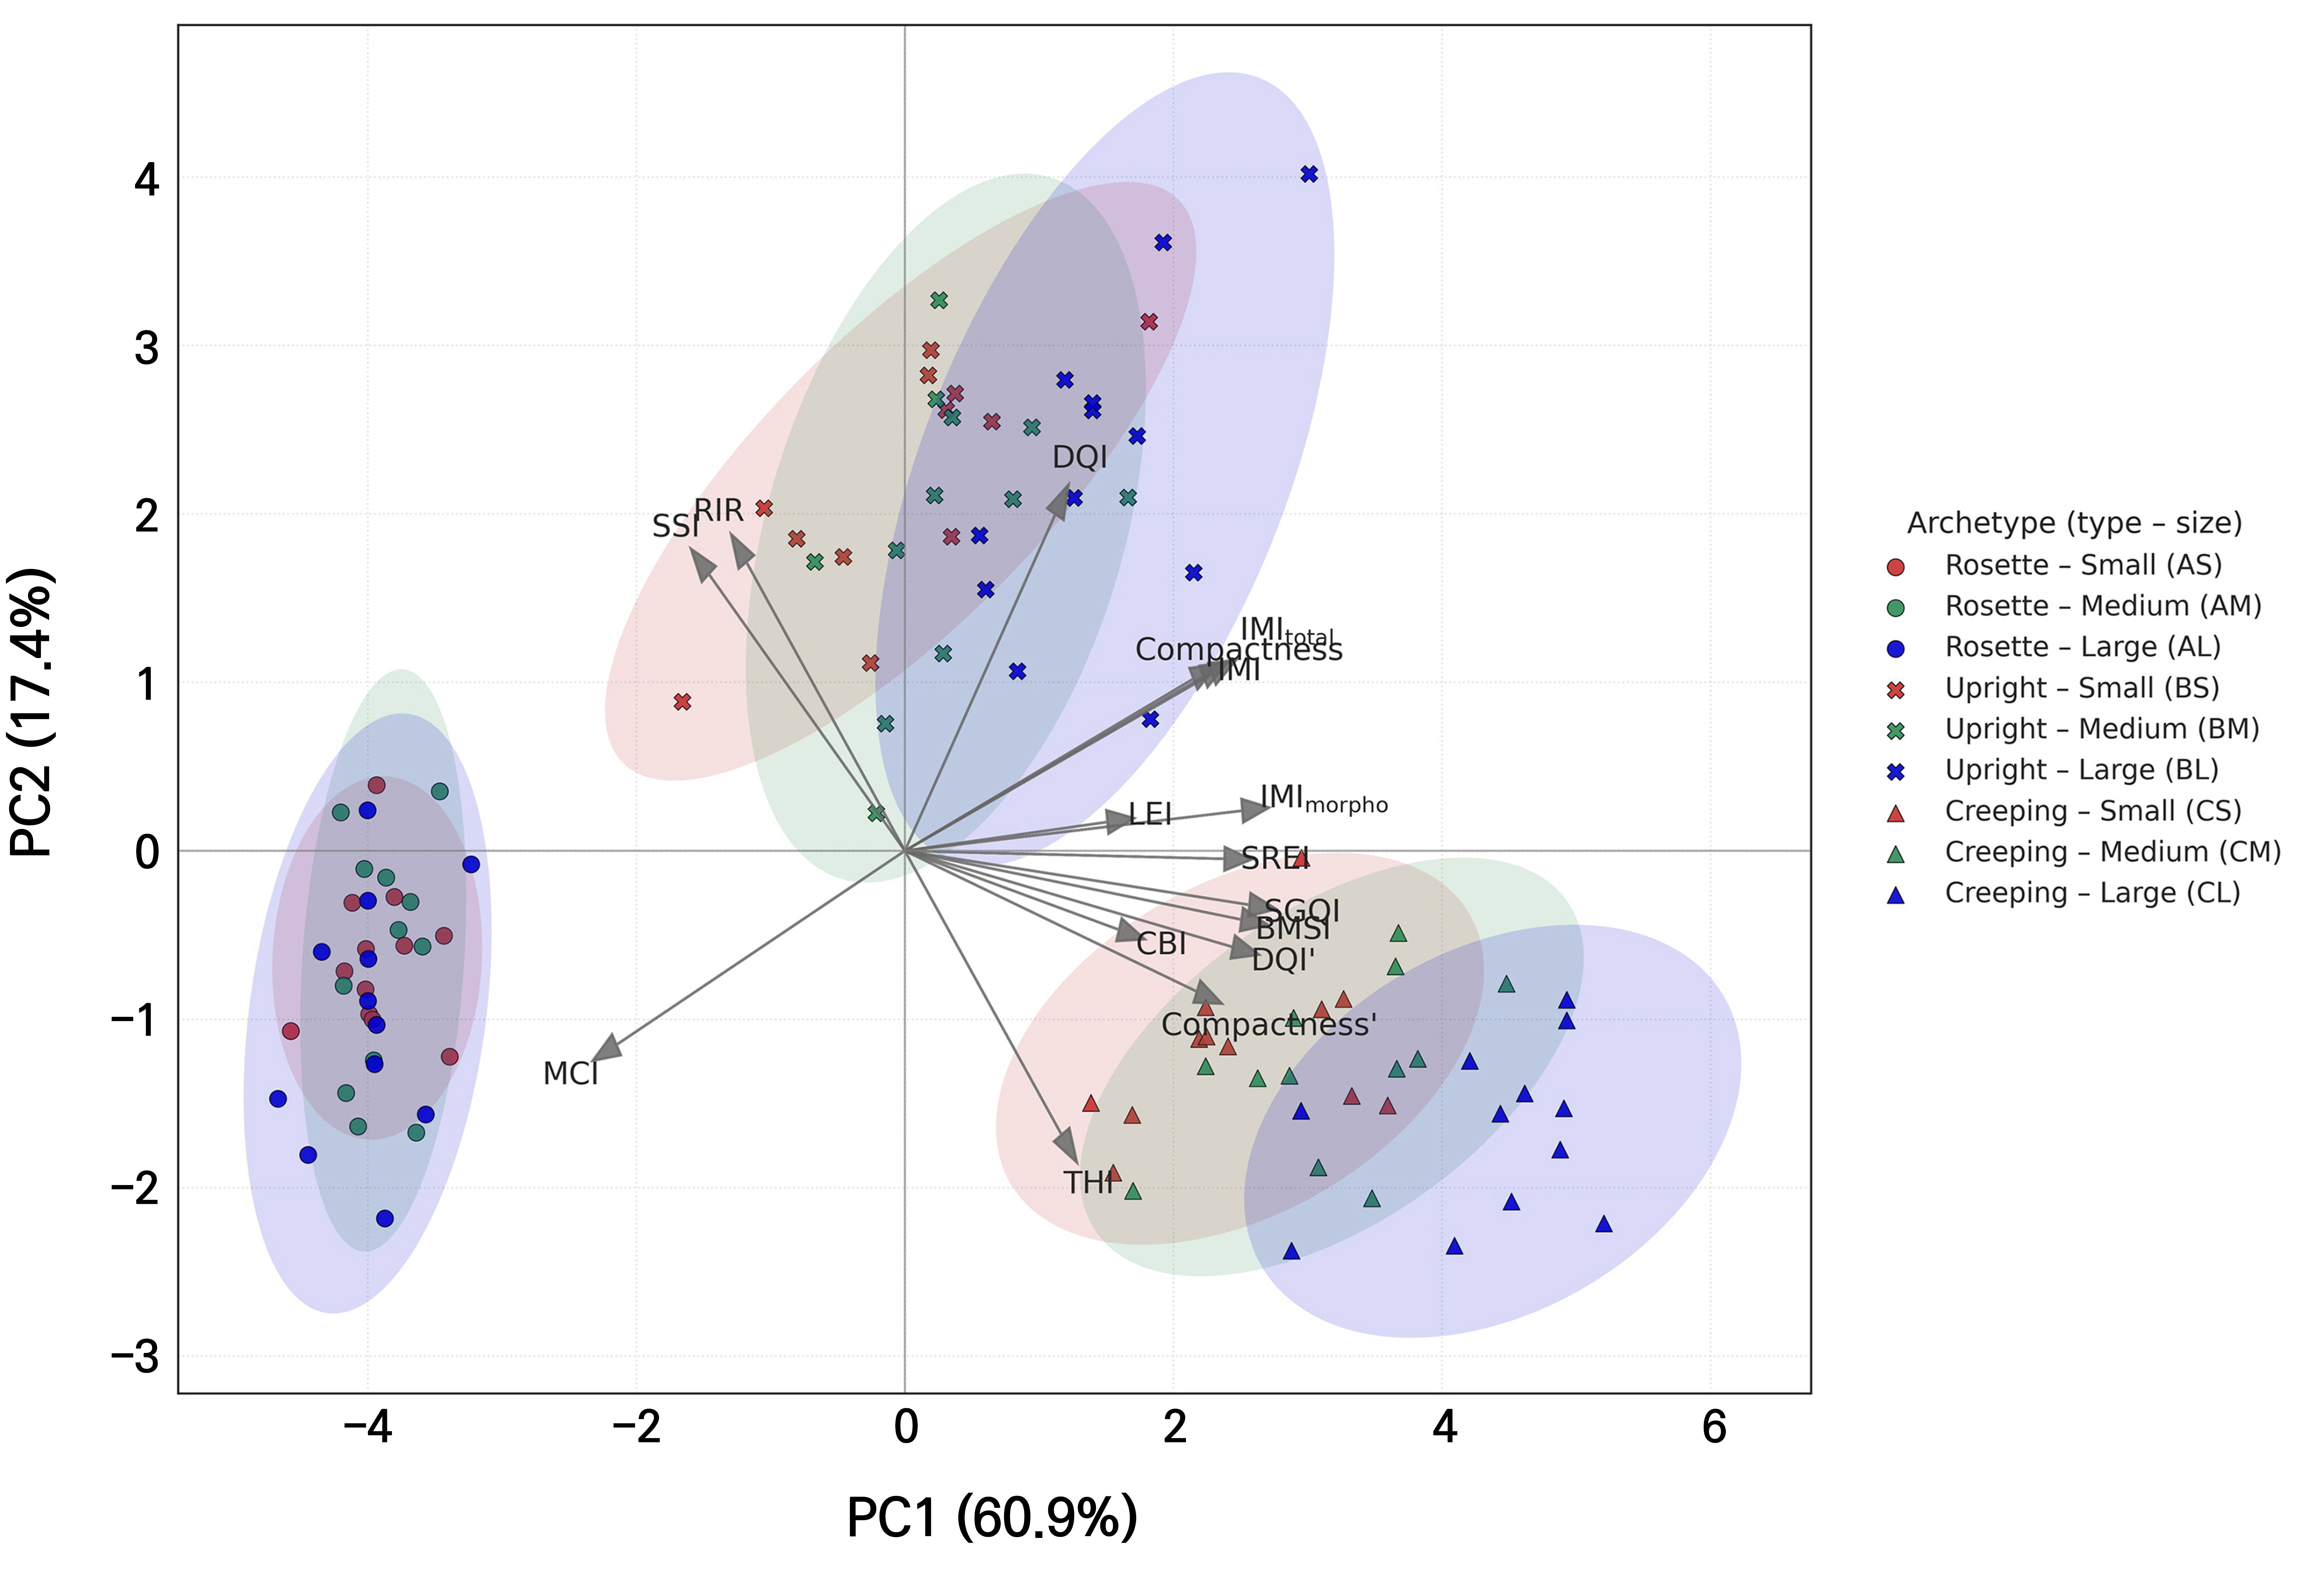
Fig. 3.
Principal component analysis (PCA) biplot of plant quality indices based on a synthetic dataset (n = 108). Shapes denote plant archetypes (circle: rosette; cross: upright; and triangle: creeping), and colors indicate sizes (red: small, green: medium, and blue: large). PC1 and PC2 explained 60.9% and 17.4% of the total variance, respectively, accounting for 78.3% in total. Data were simulated to demonstrate potential relationships between plant quality indices. Variable names include conventional indices, namely the DQI and compactness; variant indices, namely DQI′ and compactness′; and proposed indices, specifically the BMSI, SREI, CBI, THI, RIR, MCI, LEI, SGQI, SSI, IMI, IMImorpho, and IMItotal.
PC1 results were characterized by strong positive loadings on plant quality indices normalized to morphological ratios or physiological efficiency, namely the SGQI, IMImorpho, BMSI, DQI′, SREI, IMItotal, IMI, and the compactness′ index. These indices overcome the limitations of conventional indices, such as the DQI or compactness index, by indicating how efficiently biomass production and physiological soundness can be simultaneously achieved within a given morphological structure. Individuals located on the positive side tended to be characterized as large and highly efficient, whereas those on the negative side were relatively small and emphasized structural complexity (e.g., MCI). In addition, the SSI and RIR exhibited relatively weak negative loadings on PC1.
PC2 was positively loaded with the DQI, RIR, and SSI, whereas the THI showed a strong negative loading. A positive direction represents balanced and stable traits with relatively high root allocation and stem stability, whereas a negative direction corresponds to elongated or shoot-dominant traits. In particular, the THI, which combines the shoot-to-root dry weight ratio and shoot height-to-root length ratio, captures individuals in which shoot elongation and biomass accumulation are more pronounced relative to the roots.
The rosette type (group A) was distributed in the negative direction of both PC1 and PC2, with a smaller absolute size but higher MCI values, highlighting its structural complexity. The upright type (group B) was positioned at intermediate PC1 and higher PC2 values, where balance and stability were emphasized by the DQI, RIR, and SSI. The creeping type (group C) was characterized by higher PC1 and lower PC2 values, reflecting a combination of large, high-efficiency traits and shoot dominance. The increase in plant size consistently led to higher PC1 scores across all groups, reinforcing the characteristic traits of both the upright and creeping types.
The indices proposed in this study complement conventional single-morphological or simple ratio-based indices and help overcome their limitations. By integrating physiological parameters (i.e., Fv/Fm and NDVI) with plant morphological and biomass ratios, the IMI series of plant quality indices enabled simultaneous assessments of quantitative growth parameters and physiological soundness, thereby providing a comprehensive interpretation of morphophysiological differences that could not be captured by existing indices. Additionally, the SGQI and BMSI directly quantify biomass productivity relative to plant structure, the SSI and RIR reflect mechanical stability and root allocation, and the MCI expresses structural complexity, providing a framework for integrated evaluations of the morphological, physiological, and structural attributes of plants.
At the same time, because many of the proposed indices intentionally share underlying variables (e.g., total dry weight, as well as shoot height and width), a certain degree of redundancy among the indices is unavoidable. In this proof-of-concept study, redundancy was considered qualitatively through PCA loadings and the distribution of observations in the PC1-PC2 score space; however, future work should formally quantify redundancy and independence among the indices using approaches such as variance partitioning or partial correlation analysis applied to empirical plant datasets.
Correlations among plant quality indices and cluster analysis
A correlation analysis of the 16 plant quality indices was conducted using Pearson correlation coefficients and a hierarchical clustering analysis to compare and analyze the correlation structure and cluster characteristics of the indices by plant archetype and across the combined dataset (Fig. 4). Although hierarchical clustering is often based on the dissimilarity 1–r derived from pairwise Pearson correlations, we instead adopted the Euclidean distances between rows of the correlation matrix to better capture the overall correlation profile of each index. Unlike 1–r, which reflects only a direct linear association between a given pair of indices, profile-based Euclidean distances account for how each index relates to all others simultaneously, thereby emphasizing structural patterns within the correlation network (Jaskowiak et al. 2014). This approach provides a more comprehensive perspective on how indices behave relative to each other.
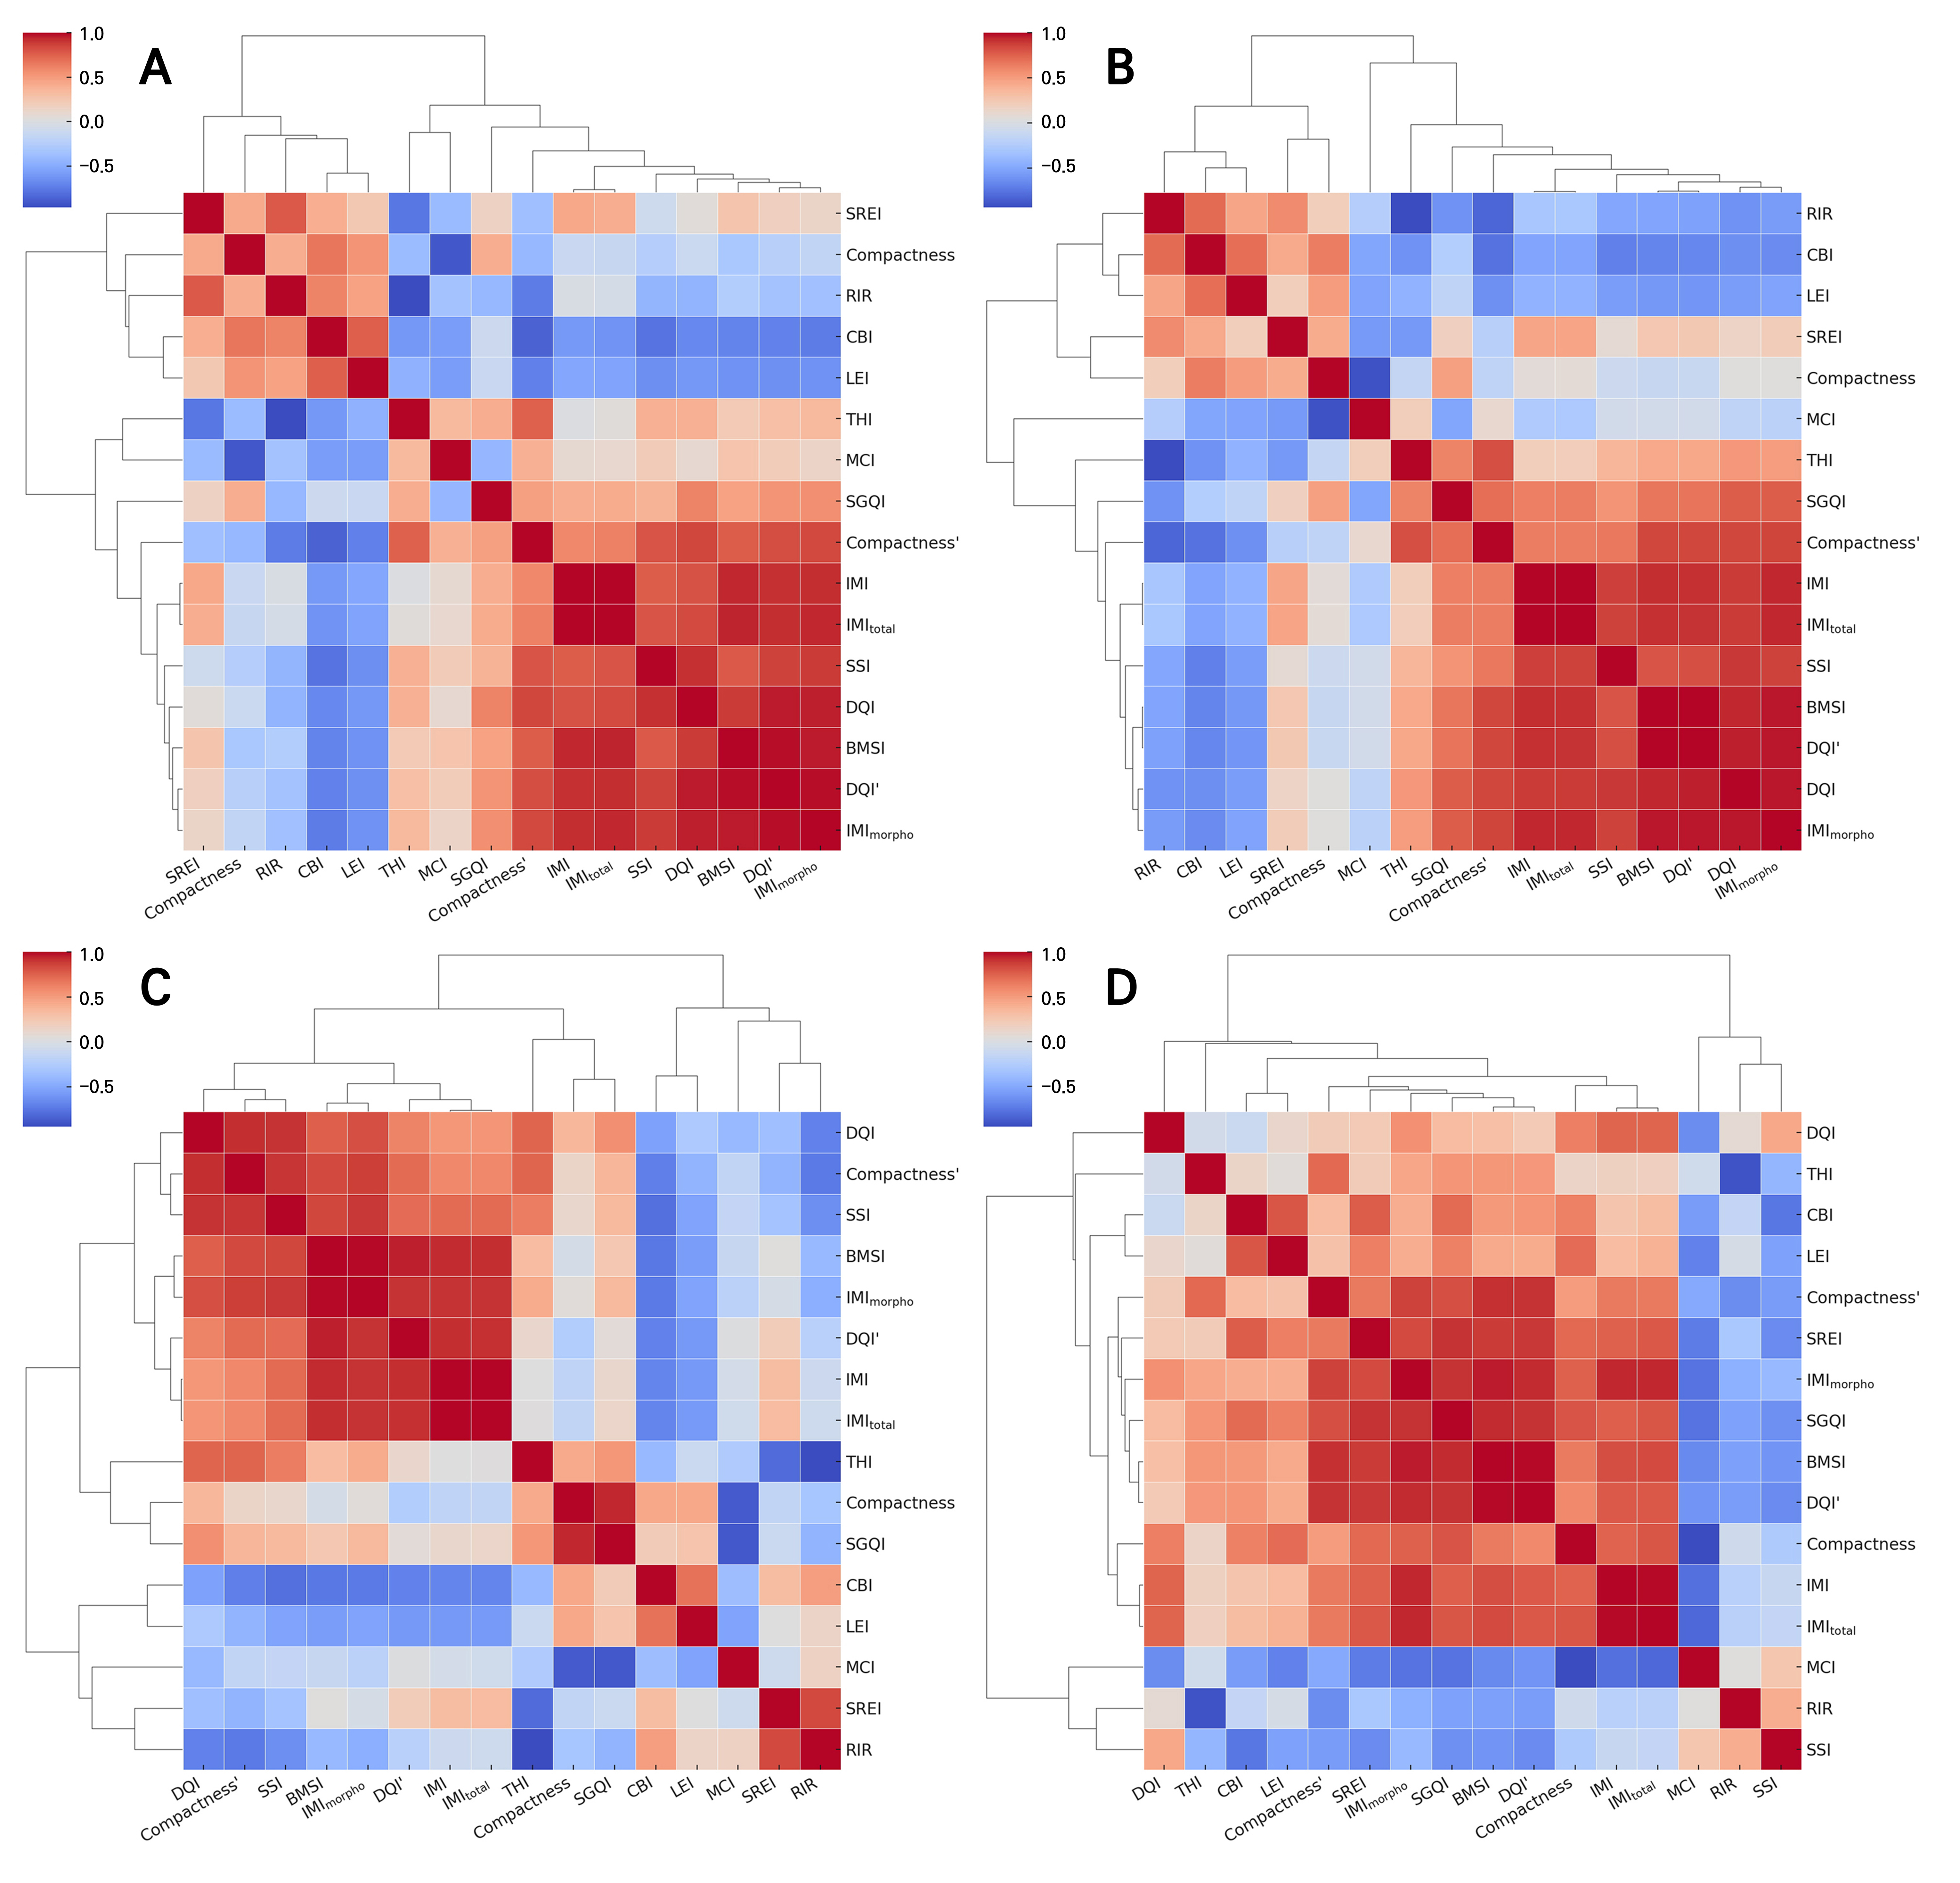
Fig. 4.
Pearson correlation coefficient heatmaps with hierarchical clustering of plant quality indices derived from a synthetic dataset, shown separately for different plant archetypes and for the combined dataset. Panel (A) shows rosette; panel (B) shows upright; panel (C) shows creeping; and panel (D) shows all combined archetypes. In each panel, red and blue colors indicate positive and negative Pearson correlations, respectively. Variable names include conventional indices, in particular the DQI and compactness; variant indices, namely DQI′ and compactness′; and proposed indices, specifically the BMSI, SREI, CBI, THI, RIR, MCI, LEI, SGQI, SSI, IMI, IMImorpho, and IMItotal. Given the sample sizes (n = 36 for each archetype and n = 108 for the combined dataset), correlations with r ≥ 0.33 or r ≤ ‒0.33 (A‒C) and r ≥ 0.19 or r ≤ ‒0.19 (D) are statistically significant at p < 0.05.
In the rosette-type group, the biomass-oriented index group (DQI, DQI′, BMSI, IMI, IMItotal, IMImorpho, and compactness′), together with the SSI, formed a compact, high-correlation cluster (Fig. 4A). These indices reflect the overall structural balance and biomass levels of plants, including shoot-to-root ratios, and exhibit strong positive correlations with each other. In contrast, the resource allocation index RIR and the biomass-oriented index SREI were separated from this cluster. In particular, the RIR showed a strong negative correlation with the THI (r = ‒0.75), clearly capturing the divergence in resource allocation strategies. Compactness, the LEI, and the CBI formed independent clusters associated with plant density and morphological stability and exhibited weak negative correlations with the biomass-oriented index group. This suggests that in rosette-type plants, biomass-oriented traits and structural density traits act in opposition. It is noteworthy that although compactness did not show significant main effects in the ANOVA, the PCA and clustering analyses indicated that compactness still participates in broader association structures with other indices. This reflects the distinction between univariate statistical significance and multivariate relationship patterns.
In the upright-type group, the DQI, DQI′, BMSI, and the IMI series similarly formed a strongly correlated biomass-oriented index group (Fig. 4B). The RIR and THI again showed a strong negative correlation (r = ‒0.96), as in the rosette type. The SREI was not clustered with the THI, but instead showed a closer connection with the compactness index. This indicates that in the upright type, variation in the SREI was more strongly associated with shoot stability indices (i.e., compactness). The LEI, MCI, and compactness index formed distinct independent clusters, suggesting that in the upright type, structural robustness, leaf, and branching traits represent separate axes of plant quality, distinct from biomass-oriented indices.
In the creeping-type group, biomass-oriented indices showed very strong interconnections overall, with the DQI, DQI′, BMSI, SSI, the IMI series, and compactness′ exhibiting strong positive correlations (Fig. 4C). As a result, the boundaries between the clusters were relatively less distinct compared to those of the other archetypes. In contrast, the compactness index as well as the MCI and LEI each formed independent clusters, and the RIR and THI consistently retained their strong negative correlations, as observed in the rosette and upright types. Notably, in the creeping type, the correlation between the SREI and RIR was stronger than in the other archetypes, implying that in creeping forms, aboveground expansion and root investment ratios are more tightly linked.
When all archetypes were combined, the absolute correlation strength between the clusters was attenuated, reflecting an average effect across plant types (Fig. 4D). Nonetheless, the RIR and THI consistently exhibited strong negative correlations, whereas the IMI series showed strong positive associations with other biomass-oriented indices.
Across all archetypes, a tripartite structure comprising a biomass-oriented index group, morphological stability index group, and resource allocation index group was consistently observed. However, the cohesion within clusters and the direction of the correlations differed depending on the plant archetype, and in some cases, individual indices exhibited traits spanning multiple groups. In some plant types, two or more tripartite groups may overlap, blurring the boundaries between biomass production, morphological stability, and resource allocation. This overlap underscores the extent to which the structural form governs the correlation structure among the quality indices and highlights that the interpretation of a given index may vary with the morphological characteristics.
Notably, the IMI series consistently clustered with high-performance biomass-oriented indices such as the DQI and BMSI across all plant growth forms, supporting its role as a consistent integrative index candidate within the synthetic dataset. Conversely, the persistent strong negative correlation between the RIR and THI across all types highlights their suitability as indicators for capturing the fundamental trade-off in resource allocation strategies. Overall, these patterns provide a basis for the development, selection, and application of plant quality indices that can help characterize the interactions between plant form, biomass distribution, and physiological performance.
Synthesis, Limitations, and Practical Implications
Conceptual integration and archetype-specific interpretation of plant quality indices
In this study, we re-examined the limitations of conventional plant quality indices (e.g., DQI, compactness, and shoot-to-root ratio) and established a conceptual foundation for an integrated framework of plant quality evaluation by proposing a new set of indices (BMSI, SREI, CBI, THI, RIR, MCI, LEI, SGQI, SSI, and IMI series) designed to complement and extend existing measures. The analyses were conducted not on empirical cultivation data but on a synthetic dataset, and by applying two-way ANOVA, PCA, correlation, and clustering analyses across morphological archetype and plant size factors, we demonstrated that these indices are closely linked to morphological, biomass-related, and physiological characteristics.
In contrast to the conventional plant quality indices, which are largely restricted to biomass-based or simple ratio measures, the newly proposed indices can be categorized into three evaluation domains: biomass-oriented indices, morphological stability indices, and resource allocation indices. In some cases, the individual indices incorporate the characteristics of multiple groups. This classification provides clarity and structure for the interpretation of indices depending on plant morphological archetypes, thereby offering a framework that can guide index selection in future research and practical applications. Moreover, by simultaneously reflecting the morphological balance and physiological soundness factors, the IMI series demonstrated the potential for integrated evaluations. The consistent and strong associations with existing indices observed in the PCA and correlation analyses suggest that, within this synthetic proof-of-concept dataset, the proposed indices behave as comprehensive metrics; however, their robustness should be further evaluated in follow-up studies using empirical datasets.
A further limitation should be noted: some of the proposed indices combine variables with different physical dimensions (such as shoot sizes and biomass components) and therefore yield composite units. In this study, these indices were treated as composite scores for relative comparisons and were Z-score standardized prior to multivariate analyses such that differences in physical units did not drive the PCA or correlation results. Nonetheless, future work should explore alternative normalization schemes or dimensionless formulations and formally assess redundancy and independence among the indices to facilitate interpretation and cross-study comparisons.
Overall, these findings underscore that plant quality indices should not be interpreted by a single universal standard; rather, differentiated reference ranges should be established according to morphological archetypes and plant sizes. For example, the rosette archetype showed distinct signatures in stability indices such as the MCI and LEI, the upright archetype did so in the RIR and SSI, and the creeping archetype in the THI, indicating that the interpretation of a given index can vary depending on the structural background or growth model of the plant. Therefore, future studies should focus on defining archetype- and size-specific reference ranges for plant quality indices. In addition, as empirical datasets accumulate, these indices may serve as calibration targets for scalable, non-destructive assessment pipelines based on allometry, sensing, or imaging-derived traits, contingent upon rigorous external validation.
Potential applications of the plant quality indices
From a breeding perspective, the indices proposed in this study could support multi-trait selection schemes by integrating information on plant size, biomass distribution, and physiological performance into a small number of composite scores. For example, biomass-oriented indices such as the DQI, BMSI, and SGQI could be used to rank genotypes according to overall vigor and growth potential, whereas the IMI and its variants may help identify lines that combine high biomass with stable physiological performance (Fv/Fm and NDVI). In early-generation or seedling-stage trials, breeders could apply threshold values or percentile-based cut-offs to these indices to pre-select promising genotypes before committing resources to more detailed yield or quality evaluations.
From the grower’s standpoint, the indices offer practical tools for seedling grading and production management. In commercial nurseries, compactness, the THI, SSI, and RIR could be used to distinguish structurally robust transplants from those that are excessively elongated, top-heavy, or weakly rooted, which may help reduce the risk of lodging and improve post-transplant establishment. Although some indices currently require destructive sampling for biomass estimation, they can serve as calibration targets for developing non-destructive surrogates based on allometric relationships, optical sensing, or imaging-derived traits. In future work, if needed and if sufficiently large, paired datasets become available, these surrogates could be refined using artificial intelligence and machine-learning approaches (e.g., computer vision on high-throughput imaging data). Once such surrogates are established, growers could routinely monitor index values to optimize nursery protocols (e.g., light, nutrition, and spacing) toward archetype- and size-specific target ranges.
Beyond crop production, the proposed indices also have potential applications in ecological restoration, forestry, and urban greening programs. In these contexts, successful establishment and long-term survival often depend on a balance between shoot growth, mechanical stability, and root system development. Resource allocation and stability indices such as the S/R, RIR, THI, SSI, and MCI could be used to characterize and select planting materials with favorable root investment and structural robustness for harsh or water-limited sites. In addition, the IMI series, by integrating morphological and physiological information, could help identify seedlings or plant materials that are not only large and suitably structured but also maintain relatively stable physiological status (e.g., Fv/Fm and NDVI) under stress in future empirical evaluations. As empirical datasets accumulate across species and environments, these indices could be incorporated into decision-support tools for species selection, stock-type recommendation, and quality control in large-scale planting or restoration projects.
In conclusion, the results of our proof-of-concept analyses provide conceptual groundwork for expanding plant quality assessment from single-index applications to multidimensional and integrated evaluation systems. With future empirical validation across diverse species and environmental conditions, the proposed indices and framework may contribute to the development of reference ranges and more standardized reporting practices for plant growth assessment.
