

Introduction
Materials and Methods
Plant material and growing conditions
Experimental design and treatments
Harvest and fruit quality measurements
HPLC sugar analysis
Statistical analysis
Results
Plant growth during the reproductive stage
Effects of the DLI and flower thinning on marketable fruit production
Fruit weight and soluble solids content (SSC)
Sugar composition: sucrose, glucose, and fructose
Discussion
Growth and assimilate partitioning with an increase in the DLI
DLI and flower thinning effects on marketable fruit production
Sugar metabolism and partitioning under different DLIs
Study limitations and future directions
Conclusion
Introduction
Strawberry (Fragaria × ananassa Duch.) is one of the most economically important fruit crops worldwide, valued for its distinctive flavor, nutritional quality, and commercial appeal (Capocasa et al. 2008). In recent years, the adoption of vertical farms for strawberry production has gained increasing attention as a means of achieving year-round, location-independent production with reduced exposure to adverse weather (Benke and Tomkins 2017; Kozai 2019). In a vertical farm, all light is supplied by electric lamps. The daily light integral (DLI), defined as the total amount of photosynthetically active radiation received per unit area per day, is a key environmental factor governing photosynthetic carbon assimilation, and consequently, fruit production and quality (Hidaka et al. 2013; Park et al. 2023; Zou et al. 2025).
Light availability strongly affects carbon acquisition and strawberry productivity. Supplemental lighting and increased photon flux can enhance vegetative growth, fruit yields, fruit mass, and soluble solids, although responses depend on the cultivar, spectrum, and cultivation conditions (Hidaka et al. 2013; Park et al. 2023; Roosta et al. 2024). Accordingly, the DLI range selected for controlled-environment strawberry production should provide sufficient carbon gain while avoiding unnecessary lighting energy input. In the present study, DLI levels of 15–20 mol·m-2·d-1 were therefore evaluated as a practically relevant range for fruit production in a vertical farm.
Sugar composition, primarily sucrose, glucose, and fructose, is a central determinant of strawberry flavor and market quality (Sturm and Tang 1999; Sturm et al. 2003). In strawberry fruit, sucrose metabolism involves both cleavage by invertases and sucrose synthesis or resynthesis associated with sucrose phosphate synthase (SPS) activity (Hubbard et al. 1991). Invertase activities and the expression of invertase-related genes change substantially during strawberry fruit development, and these developmental changes contribute to shifts in glucose, fructose, and sucrose concentrations (Topcu et al. 2022). Sugar composition also varies with the genotype, maturity stage, and cultivation environment (Sturm and Tang 1999; Alvarado-Camarillo et al. 2024). Because light controls source carbon availability, changes in the DLI may alter sugar accumulation and partitioning in fruit; however, the responses of individual sugars to different DLIs in vertical farms, particularly in the Korean cultivar ‘Kuemsil’, remain insufficiently characterized.
The ‘Kuemsil’ strawberry, derived from a cross between ‘Maehyang’ and ‘Seolhyang’, was developed for forcing culture and registered for commercialization in Korea in 2018 (Yoon et al. 2020). It is characterized by early flower bud differentiation, a high sugar content (approximately 11.1 °Brix), and relatively large fruit (approximately 24.6 g) with a marketable yield reportedly 14% higher than that of ‘Maehyang’ (Yoon et al. 2020). Recent hydroponic studies have further shown that the growth and fruit quality of ‘Kuemsil’ respond to substrate and nutrient-solution management practices (Rabbani et al. 2025; Zebro et al. 2025). Understanding how the DLI and flower thinning interact to determine fruit production and sugar composition in this cultivar is therefore of both scientific and practical importance.
Given the cultivar’s characteristically high sugar content and large fruit size, we hypothesized that increasing the DLI within a practically relevant range (15–20 mol·m-2·d-1) would progressively enhance marketable fruit production and shift sugar composition toward sucrose accumulation in ‘Kuemsil’ grown in a vertical farm and that flower thinning would amplify these DLI-dependent effects by reducing sink competition and further promoting the photoassimilate supply per fruit under sufficient light conditions.
This study aimed to determine the effects of the DLI and flower thinning on marketable fruit production and the fruit weight distribution; to characterize the sugar composition responses of sucrose, glucose, and fructose to these treatments; and to identify an optimal combination of the DLI and flower thinning for maximizing the marketable yield and sugar quality of ‘Kuemsil’ in a vertical farm.
Materials and Methods
Plant material and growing conditions
Strawberry (Fragaria × ananassa Duch.) ‘Kuemsil’ transplants were established from tissue-cultured propagules and produced through successive cultivation stages conducted entirely within the vertical farm, including the acclimatization phase (AP), pre-vertical farm phase (PVF), vertical farm phase (VF), and a vegetative growth stage with progressive leaf number management (4, 6, and 8 leaves), spanning from December 8, 2024 to August 20, 2025 (Fig. 1A). Plants were grown in a multi-tier vertical farm (Fig. 1C) located at Jeonbuk National University, Jeonju, Republic of Korea (35°51'2.75" N 127°08'0.46" E) using a hydroponic system with coir substrate individual pots (diameter 17 cm, height 15 cm). Environmental conditions, including the nutrient electrical conductivity (EC) and irrigation volume, were adjusted at each cultivation stage (AP, PVF, VF, and vegetative growth) following standard protocols for strawberry transplant production and were applied identically to all plants regardless of the subsequent DLI and flower thinning treatments. During the reproductive growth stage, when the DLI and flower thinning treatments were imposed, the nutrient solution was maintained according to the PBG (Proefstation voor Bloemisterij en Glasgroente) formula (EC 1.5–2.0 dS·m-1, pH 5.8–6.2). The macronutrient stock solutions (Tanks A and B, each diluted 100-fold to prepare the working nutrient solution) used in this study were formulated following a standard PBG-based prescription for strawberry hydroponics (National Institute of Crop Science, Rural Development Administration, Pyeongchang, Republic of Korea; Prescription No. 2024.9.4), based on a local groundwater analysis. Tank A contained calcium nitrate [5(Ca(NO3)2·2H2O)· NH4NO3, 55.4 kg], potassium nitrate (6.7 kg), ammonium nitrate (7.6 kg), and nitric acid (60%, 5.6 kg), together with an iron chelate source (2,580 g), per 1,000 L of stock solution. Tank B contained potassium nitrate (21.0 kg), potassium sulfate (14.7 kg), monopotassium phosphate (13.6 kg), magnesium sulfate heptahydrate (22.2 kg), and nitric acid (60%, 5.6 kg), supplemented with micronutrients boric acid (135 g; used as the sole boron source in place of borax) and manganese sulfate tetrahydrate (220 g), zinc sulfate heptahydrate (352 g), copper sulfate pentahydrate (26 g), and sodium molybdate dihydrate (26 g), per 1,000 L of stock solution. A separate acid tank (Tank C; nitric acid 60%, 11.2 L per 1,000 L) was used solely for pH/EC adjustments and the solution it contained was not added directly to Tanks A or B. The nutrient solution was supplied by drip irrigation at 150 mL·plant-1·day-1. The air temperature was maintained at 20°/16°C (day/night), the relative humidity at 65–75%, and the CO2 concentration at 700–800 µmol·mol-1. The photoperiod was set to 10/14 h (light/dark) throughout the reproductive growth stage using light-emitting diode (LED) lamps with independently adjustable red (peak: 627 nm) and blue (peak: 451 nm) channels, maintaining a red:blue ratio of 1:1. Pollination was carried out using bumblebees (2–3 individuals per growth room; Fig. 1E), which were active on Mondays, Wednesdays, and Fridays, supplemented with manual pollination using a fine paintbrush (Fig. 1F) once daily on the remaining days, from September 1, 2025. The experiment covered 83 days of reproductive growth (August 21 – November 10, 2025), during which fruits developed to commercial maturity (Fig. 1G).
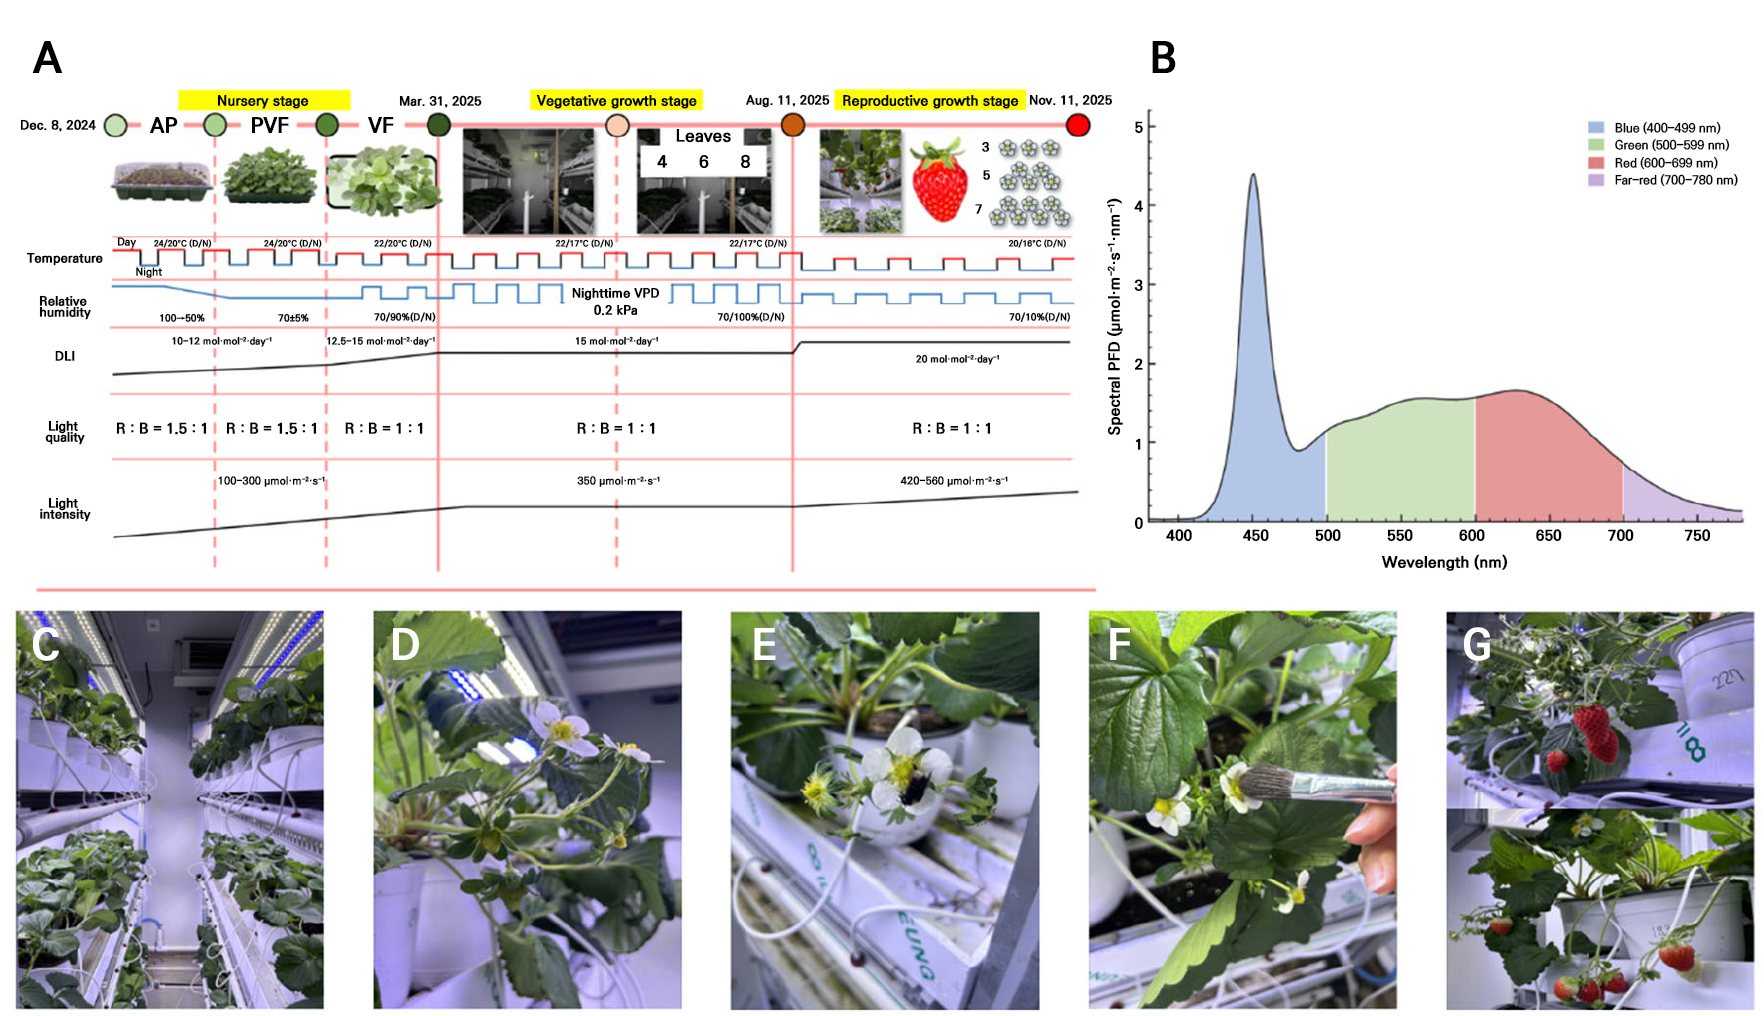
Fig. 1.
‘Kuemsil’ strawberry cultivation in a vertical farm at Jeonbuk National University: (A) Schematic timeline of cultivation stages, encompassing the acclimatization phase (AP), pre-vertical farm phase (PVF), vertical farm phase (VF), and vegetative growth stage with progressive leaf number management. Temperature, relative humidity, DLI, and light intensity trends are shown schematically and are not drawn to scale; numeric values at each stage are given as text labels. (B) Spectral photon flux density distribution of the LED lighting system at DLI 15 (PPFD: 420 µmol·m-2·s-1). Shaded areas represent blue (400–499 nm), green (500–599 nm), red (600–699 nm), and far-red (700–780 nm) wavebands. (C) Multi-tier growing system with LED lighting. (D) Flower thinning applied at first anthesis of each inflorescence. (E) Bumblebee pollination. (F) Manual pollination using a brush. (G) Ripening strawberry fruits under artificial lighting.
Experimental design and treatments
Treatments were arranged in a 3 × 3 factorial design with three DLI levels (15, 17.5, and 20 mol·m-2·d-1) and three flower thinning levels (3, 5, and 7 flowers per inflorescence retained) (Supplementary Table S1). These levels were selected based on preliminary cultivation records in vertical farm, in which plants typically produced approximately 11 marketable fruits per plant under standard management, providing a practical range for evaluating crop load effects. Each DLI level was assigned to a single dedicated growth room, where six beds (15–17 plants per bed; 90–102 plants per room) were arranged, with two beds allocated per flower thinning treatment, and five plants per bed were randomly selected as experimental units (n = 5). PPFD was measured at 35 cm above the bed surface, corresponding to the mean canopy height, with a fixed distance of 65 cm between the bed surface and the LED fixtures. Target PPFD levels (420, 500, and 560 µmol·m-2·s-1 for DLI 15, 17.5, and 20, respectively) were adjusted weekly by modulating the LED output using a quantum sensor (LI-180, LI-COR, USA). Plant positions within each bed were rotated twice per week to minimize spatial variation in light exposure.
Flower thinning was applied at first anthesis of each inflorescence; excess flowers were removed, leaving the designated number of flowers evenly distributed along the inflorescence (Fig. 1D). The spectral distribution of the LED fixtures was measured at DLI 15 (PPFD 420 µmol·m-2·s-1) as a representative spectrum, showing peak wavelengths at 451 nm (blue) and 627 nm (red), with an R:B ratio of approximately 1:1 (measured range 0.98–1.05 across four independent spectroradiometer measurements in a PPFD range of 404–566 µmol·m-2·s-1). The spectrum consisted of approximately 31% blue (400–499 nm), 32% green (500–599 nm), 31% red (600–699 nm), and 6% far-red (700–780 nm) of total photon flux (380–780 nm), with these proportions remaining stable across the measured PPFD range (Fig. 1B and Supplementary Table S2). The LED fixtures allowed independent adjustment of red and blue channel intensities, enabling precise control of the spectral composition across DLI levels.
Harvest and fruit quality measurements
Fruits were harvested weekly at commercial maturity (> 90% red surface coloration) throughout the experimental period. All fruits from five randomly selected plants per treatment (n = 5) were collected at each harvest. The fresh weight of individual fruits was recorded, and fruits were classified as small (< 8 g), medium (8–10 g), or large (> 10 g). Marketable fruits were defined as those with fresh weight > 10 g and soluble solids content (SSC) ≥ 10 °Brix. SSC was measured using a digital refractometer (PAL-1, Atago, Japan) on juice extracted from each fruit. The number of marketable fruit and the total fresh weight per plant were calculated for each treatment.
HPLC sugar analysis
Harvested fruits from five plants per treatment were pooled to form a single composite sample per treatment (n = 5 plants). Pooled samples were immediately frozen at −80°C and stored until analysis. Before analysis, frozen samples were freeze-dried (FD8518, Ilshin Biobase, Korea) for four to five days and ground to a fine powder. Sugar extraction was performed in triplicate (technical replicates) by dissolving 200 mg of freeze-dried powder in 5 mL of ultrapure water, briefly vortexing this extract, and shaking it in a water bath at 80°C for 20 min at 180 rpm. Samples were cooled to 4°C, vortexed, and centrifuged at 3,500 rpm for 10 min. The supernatant was filtered through a 0.45 µm PVDF syringe filter and stored in 1.5 mL vials until injection. Glucose, fructose, and sucrose concentrations were determined by high-performance liquid chromatography (HPLC; Agilent 1260 Infinity, Agilent Technologies, USA) equipped with a refractive index detector (RID) and a ZORBAX carbohydrate column (4.6 × 250 mm, 5 µm; Agilent Technologies, USA).
Statistical analysis
All data are presented as mean values unless otherwise stated. A two-way analysis of variance (ANOVA) was conducted to assess the main effects of the DLI and flower thinning, as well as their interaction, on each response variable. When significant effects were detected (p < 0.05), means were separated using Tukey’s HSD (Honestly Significant Difference) test. Growth and fruit data were analyzed using five plants per treatment as biological replicates (n = 5). To assess the sugar composition, one composite sample per treatment was extracted in triplicate such that the three values represented technical rather than biological replicates; these results are therefore interpreted as treatment-level trends. Statistical analyses were performed using R (version 4.2.1; R Core Team, Vienna, Austria).
Results
Plant growth during the reproductive stage
The DLI primarily governed the aboveground growth of ‘Kuemsil’ during the reproductive stage, while flower thinning had negligible effects on the plant morphology (Figs. 2 and 3). At 217 days after transplanting (DAT), the DLI had a significant effect on the number of leaves (p < 0.05), the SPAD value (p < 0.01), and the leaf area (p < 0.05). In contrast, flower thinning showed no significant main effect on any vegetative parameter, nor was a significant DLI × flower interaction detected (Fig. 3). The number of leaves decreased with an increase in the DLI, with DLI 15 significantly higher than DLI 20 on this metric (Tukey’s HSD, p ≤ 0.05). SPAD values were significantly higher at DLI 20 than at DLI 15 and 17.5. Leaf area was also significantly greater at DLI 15 compared to DLI 20, with DLI 17.5 showing an intermediate value.
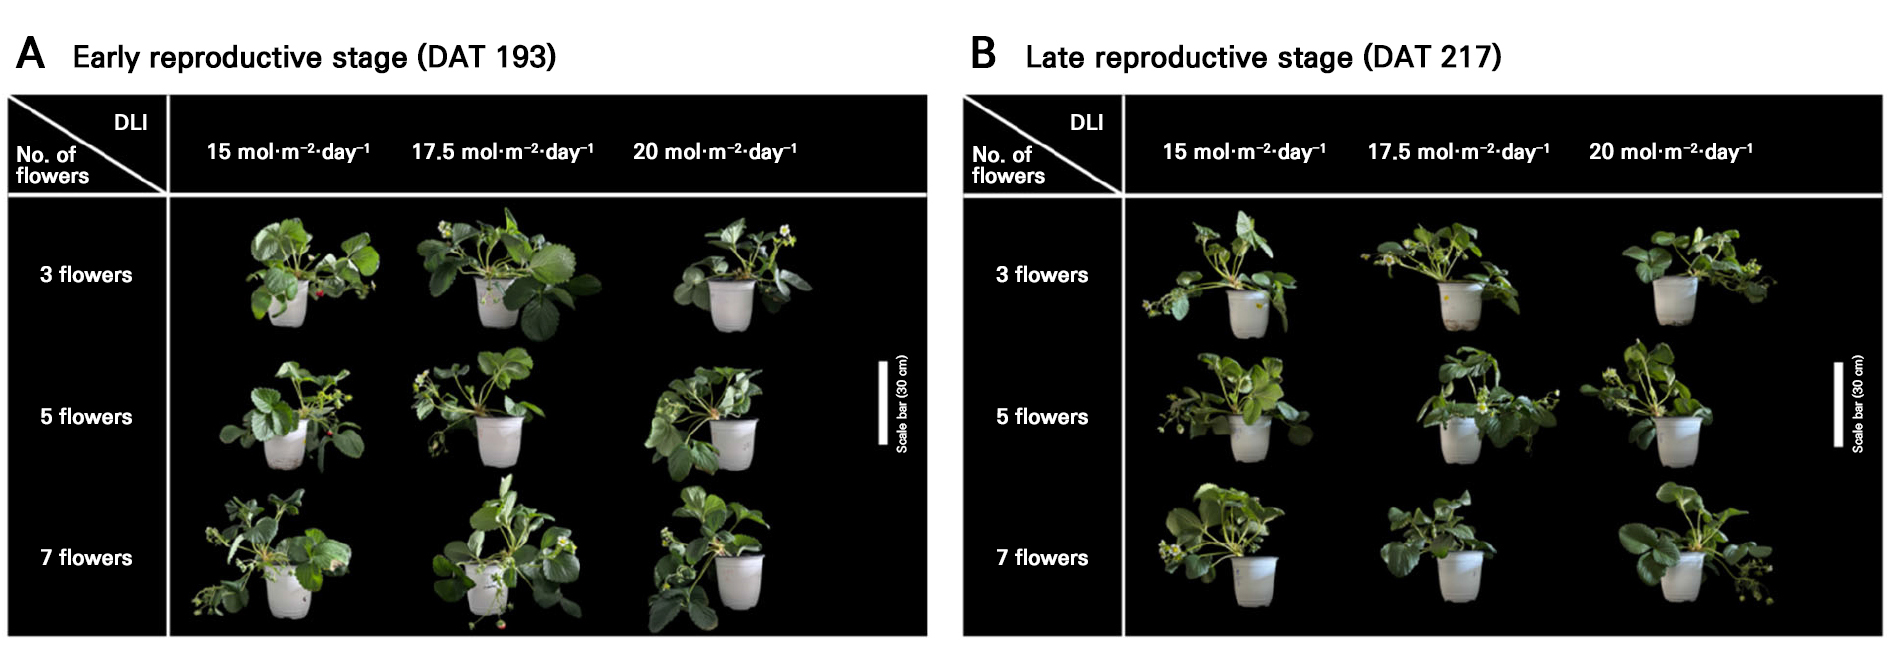
Fig. 2.
Representative side-view images of ‘Kuemsil’ strawberry plants as affected by the daily light integral (DLI) and number of flowers per inflorescence during the reproductive stage in a vertical farm: (A) Early reproductive stage (58 days after the start of the reproductive stage; DAT 193) and (B) late reproductive stage (82 days after the start of the reproductive stage; DAT 217). Each panel shows plants under three DLI levels (15, 17.5, and 20 mol·m-2·d-1) and three flower thinning treatments (3, 5, and 7 flowers per inflorescence). Scale bar = 30 cm.
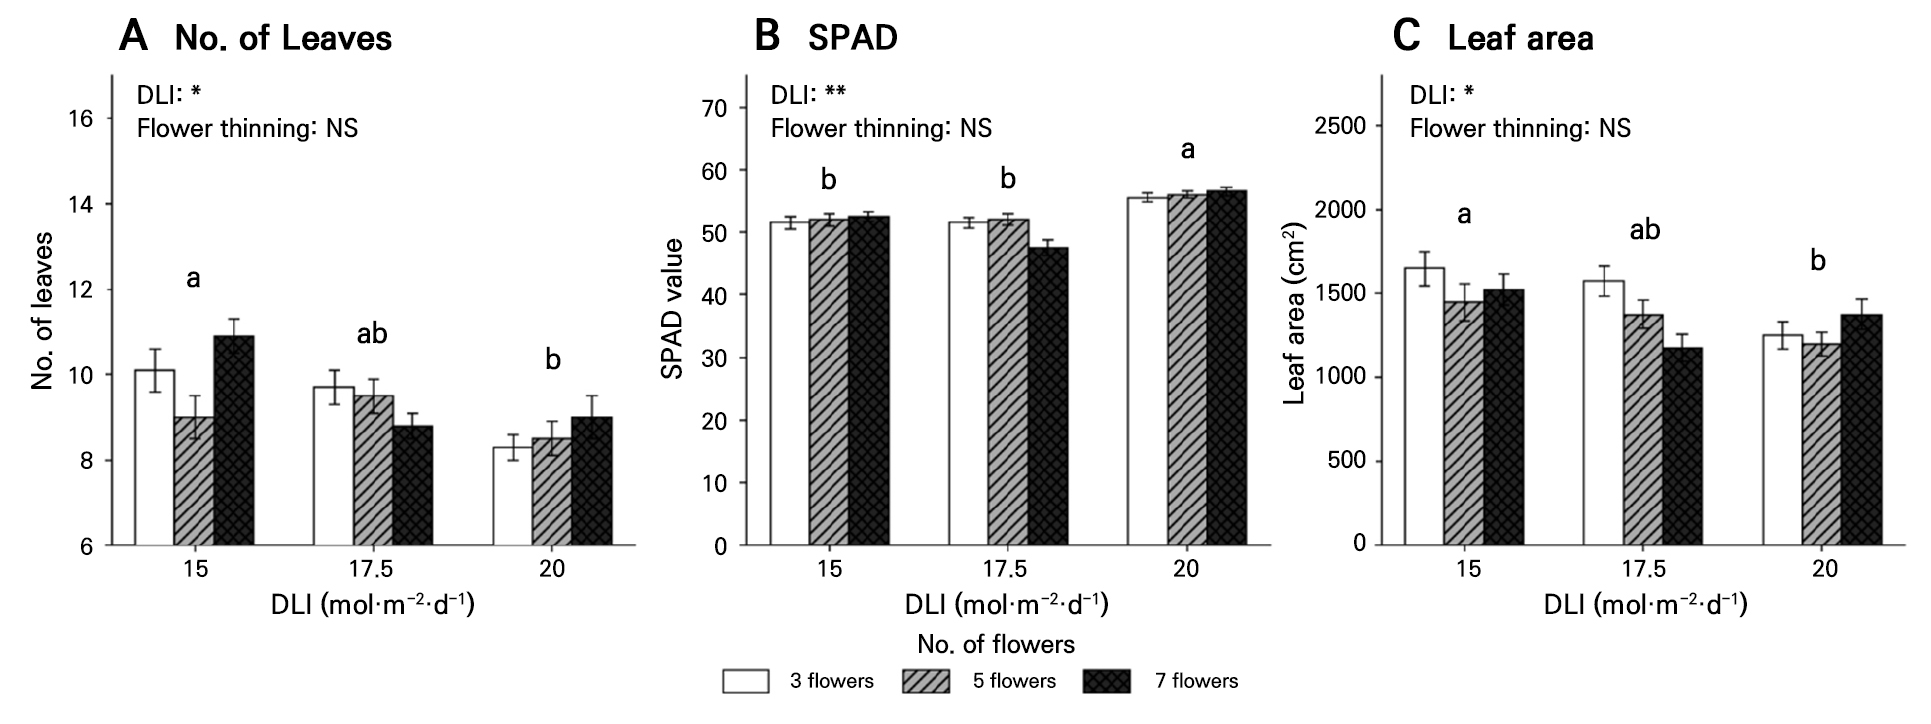
Fig. 3.
Number of leaves, SPAD value, and leaf area of ‘Kuemsil’ strawberry as affected by the daily light integral (DLI) and number of flowers per inflorescence at 82 days after the start of the reproductive stage (DAT 217) in a vertical farm: (A) Number of leaves, (B) SPAD, and (C) leaf area. Error bars represent the standard error (n = 5). Different letters above bar clusters indicate significant differences among DLI levels according to Tukey’s HSD test at p ≤ 0.05. NS, not significant. Neither the main effect of flower thinning nor the DLI × flower thinning interaction was significant for any of the three variables (NS).
Effects of the DLI and flower thinning on marketable fruit production
The DLI had a significant main effect on fruit weight (p < 0.01) and marketable fruit production, while flower thinning showed no significant main effect on either parameter. The DLI strongly influenced the fruit weight distribution as well (Fig. 4A). Under DLI 15 mol·m-2·d-1, the majority of fruits fell into the small size class (< 8 g; 53.1%), with only 18.4% classified as large (> 10 g), reflecting an insufficient carbon supply for full fruit enlargement. Increasing the DLI to 17.5 mol·m-2·d-1 markedly shifted the distribution toward larger fruits, with the highest proportion of large fruits observed pooled across all flower thinning treatments (55.4%). At DLI 20 mol·m-2·d-1, the proportion of large fruits remained high (47.8%) but was accompanied by a higher total number of harvested fruits.
The proportion of marketable fruits (fresh weight > 10 g and SSC ≥ 10 °Brix) increased markedly with the DLI, from 8.2% at DLI 15 to 32.4% at DLI 17.5 and 37.3% at DLI 20 (Fig. 4B). Flower thinning showed no significant main effect on the marketable fruit proportion; however, a clear trend was apparent under DLI 20, where thinning to three flowers per inflorescence yielded the highest marketable proportion (52.6%), compared to 35.6% at five flowers and 27.5% at seven flowers.
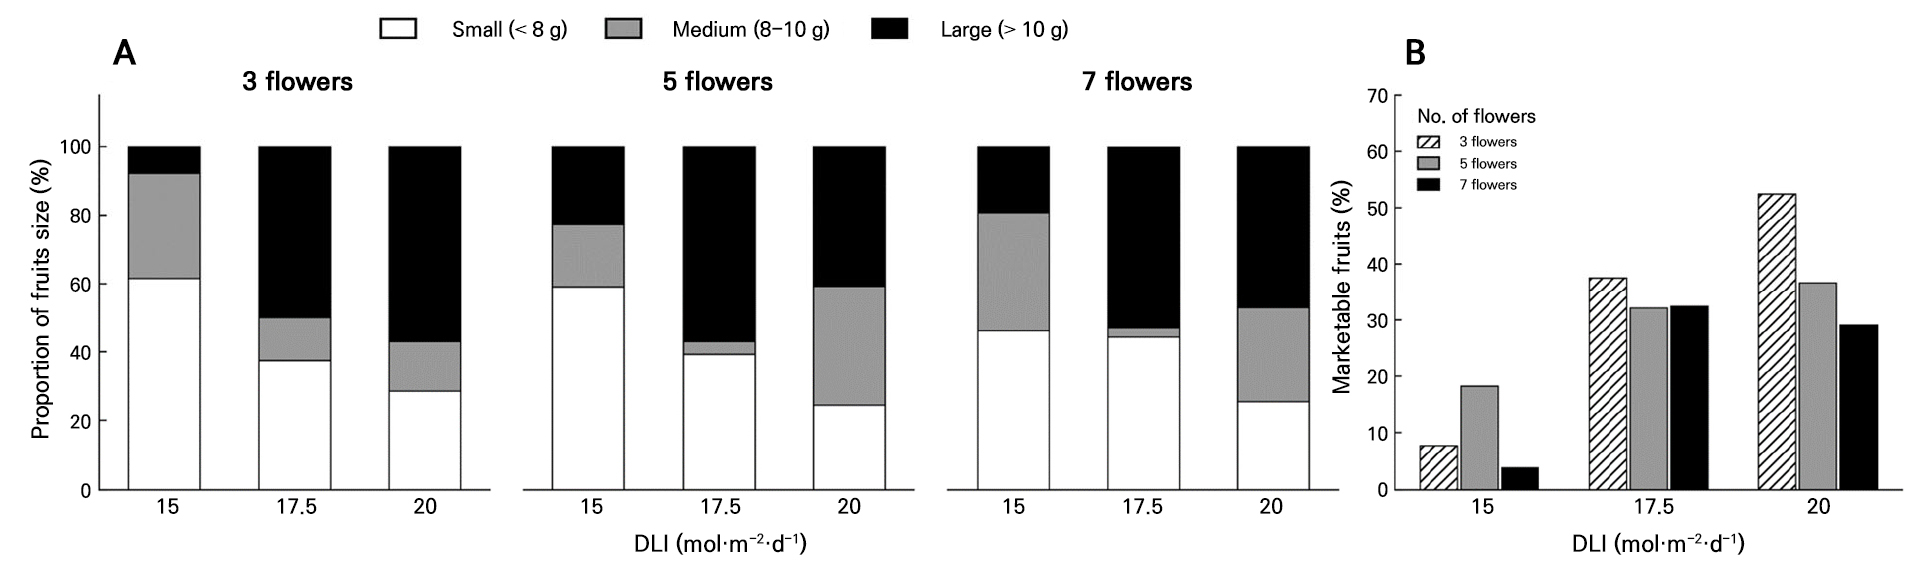
Fig. 4.
Average fruit weight distribution and marketable fruit proportion of ‘Kuemsil’ strawberry as affected by the daily light integral (DLI) and number of flowers per inflorescence in a vertical farm: (A) Proportion of fruits in each weight class (Small < 8 g, Medium 8–10 g, Large > 10 g) as affected by the DLI and flower thinning treatments (3, 5, and 7 flowers per inflorescence). (B) Proportion of marketable fruits (fresh weight > 10 g and soluble solids content ≥ 10 °Brix) out of the total number of harvested fruits per treatment.
Fruit weight and soluble solids content (SSC)
SSC increased with the DLI, ranging from 10.22 °Brix at DLI 15 to 10.78 °Brix at DLI 17.5 and 11.29 °Brix at DLI 20 (Table 1). The DLI had a significant main effect on SSC (two-way ANOVA, p < 0.01); pairwise comparisons by Tukey’s HSD test indicated that DLI 15 was significantly lower than DLI 20, while DLI 17.5 was intermediate and did not differ significantly from either extreme. Flower thinning had no significant effect on SSC, nor was a significant interaction detected.
Table 1.
Soluble solids content (SSC) and mean fresh weight of ‘Kuemsil’ strawberry fruit as affected by the daily light integral (DLI) and flower thinning in a vertical farm
|
DLI (mol·m-2·d-1) |
Flower (no.) |
SSC (°Brix) |
Fresh weight (g) |
| 15 | 3 | 10.13 bz | 7.42 b |
| 5 | 10.26 b | 8.12 b | |
| 7 | 10.21 b | 8.49 b | |
| 17.5 | 3 | 11.72 ab | 9.67 a |
| 5 | 10.18 ab | 10.87 a | |
| 7 | 10.61 ab | 10.05 a | |
| 20 | 3 | 11.51 a | 10.34 a |
| 5 | 11.76 a | 10.47 a | |
| 7 | 10.71 a | 11.02 a |
zDifferent letters within a column indicate significant differences among DLI levels according to Tukey’s HSD (Honestly Significant Difference) test at p ≤ 0.05. Two-way ANOVA showed a significant main effect of the DLI on both SSC and fresh weight (p < 0.01 for both), whereas flower thinning and DLI × flower thinning interaction were not significant (NS) for either variable.
Mean individual fruit fresh weight was significantly affected by the DLI (p < 0.01), with DLI 15 significantly lower than DLI 17.5 and DLI 20 (p < 0.05), which did not differ significantly from each other (Table 1). Flower thinning had no significant main effect on fruit weight, nor was a significant interaction detected.
Sugar composition: sucrose, glucose, and fructose
To examine the biochemical basis of these differences in fruit quality, sugar composition was analyzed by HPLC across all treatment combinations.
The HPLC analysis revealed that the DLI had a significant main effect on all three sugars (p < 0.001), while flower thinning showed no significant main effect on the fructose, glucose, or sucrose content. Significant interaction between the DLI and flower number was detected for sucrose (p = 0.027), indicating that the effect of flower thinning on sucrose accumulation is light-dependent. Individual sugar concentrations were quantified against external standard curves for glucose, fructose, and sucrose.
The sucrose content was significantly highest at DLI 20, whereas DLI 15 and DLI 17.5 did not differ significantly (p < 0.05; Fig. 5C). Conversely, fructose and glucose were highest at DLI 17.5 and lowest at DLI 20 (Fig. 5A and 5B).
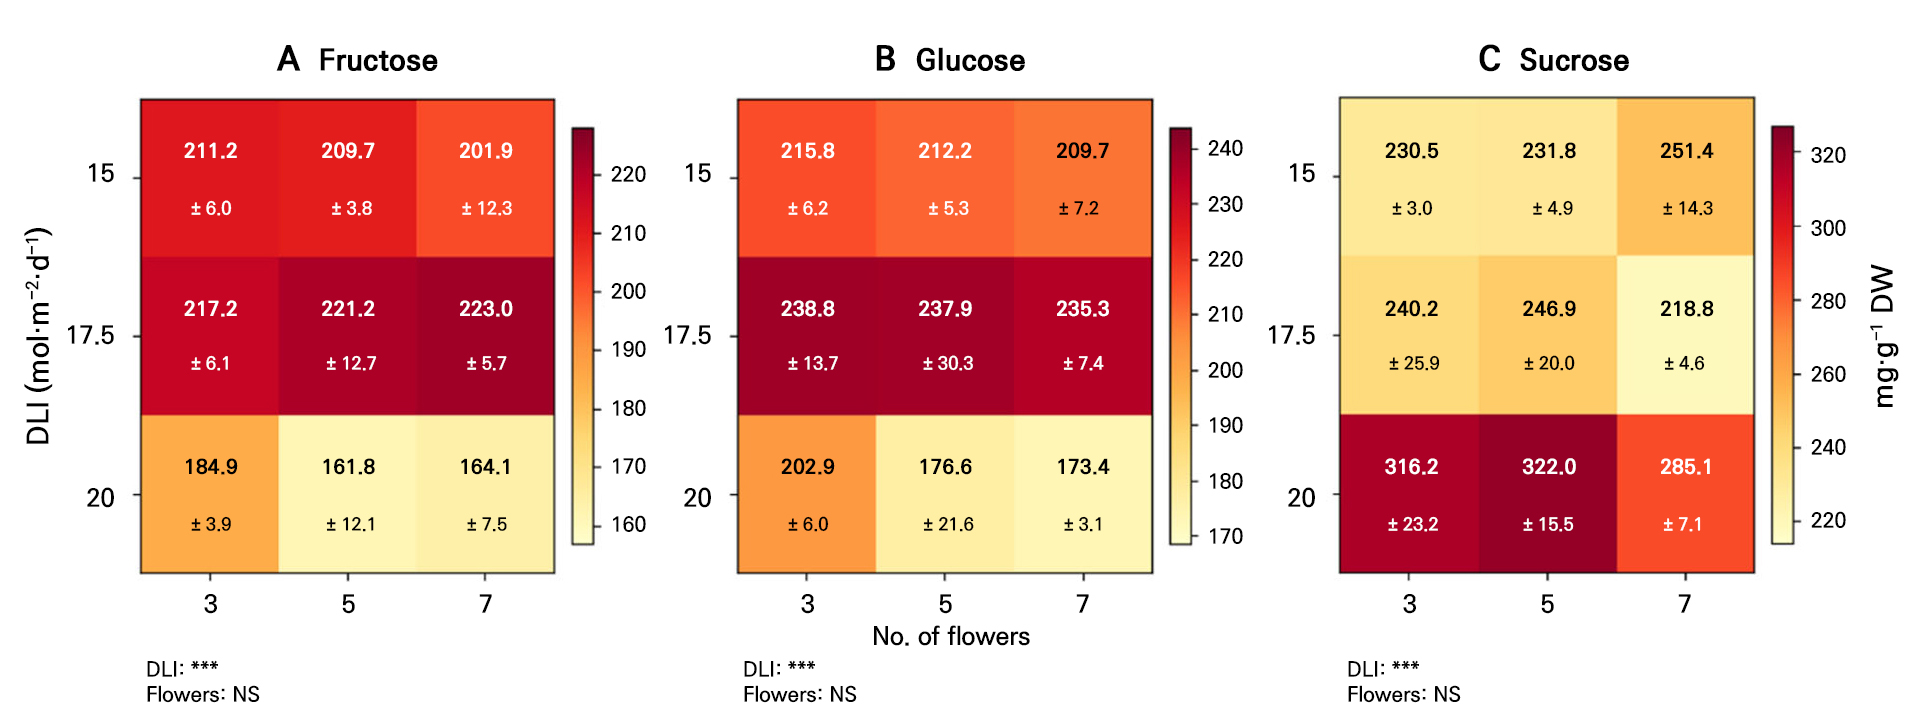
Fig. 5.
Heatmap of the free sugar content (mg·g-1 DW) in ‘Kuemsil’ strawberry fruit as affected by the daily light integral (DLI) and number of flowers per inflorescence in a vertical farm: (A) Fructose, (B) glucose, and (C) sucrose. Values represent the mean ± SD of three technical replicates (n = 3) of one composite sample per treatment. Color intensity represents the sugar concentration within each panel. Note that color scales differ across panels and are not directly comparable among sugar types. The DLI had a significant effect on all three sugars (43* p ≤ 0.001), while flower thinning had no significant effect (NS).
Under DLI 20, the sucrose content tended to be highest at five flowers (322.0 mg·g-1 DW), followed by three (316.2 mg·g-1 DW) and seven flowers (285.1 mg·g-1 DW). These treatment differences in the sugar composition are visualized in the heatmap shown in Fig. 5.
Discussion
Growth and assimilate partitioning with an increase in the DLI
Despite fewer leaves, the individual leaf chlorophyll content was enhanced under high light conditions. These results suggest that while the total leaf number and area declined under the higher DLI, the photosynthetic efficiency per leaf was maintained or enhanced, supporting adequate source capacity for fruit development across all DLI treatments. The concurrent decline in the leaf number and leaf area further indicates that as the DLI increased, assimilate partitioning shifted preferentially toward reproductive organs rather than vegetative growth, as evidenced by the concurrent reduction in the leaf number and leaf area alongside the increased marketable fruit proportion and individual fruit weight under the higher DLI (Figs. 3 and 4).
DLI and flower thinning effects on marketable fruit production
The aforementioned results are consistent with previous reports demonstrating that a higher DLI increases the photoassimilate supply and thereby supports greater fruit development in strawberry (Hidaka et al. 2013; Park et al. 2023) (Fig. 4A).
This suggests that under sufficient light conditions, reduced sink competition amplifies the positive effect of the DLI on the quality of individual fruit and that managing both the light intensity and flower number together may be more effective than either factor alone in practical strawberry production (Capocasa et al. 2008; Correia et al. 2011) (Fig. 4B).
The relatively modest numerical differences in SSC across DLI levels may reflect compensatory changes in the sugar composition rather than a change in the total SSC, as the shift from hexoses to sucrose under a higher DLI as observed in the HPLC analysis would not necessarily alter SSC as measured by refractometry (Table 1).
These results suggest that exceeding a threshold DLI of approximately 17.5 mol·m-2·d-1 is necessary to support adequate fruit enlargement in ‘Kuemsil’ grown in a vertical farm, consistent with previous reports identifying the DLI as a primary determinant of strawberry fruit size in controlled environments (Hidaka et al. 2013; Park et al. 2023) (Table 1).
Sugar metabolism and partitioning under different DLIs
This opposing pattern indicates that the DLI altered sugar partitioning among sucrose, glucose, and fructose. Although SPS and invertases are key enzymes controlling sucrose metabolism in strawberry fruit (Hubbard et al. 1991; Topcu et al. 2022), their activities were not measured in the present study. Therefore, the higher sucrose concentration at DLI 20 should be interpreted as a compositional response rather than direct evidence of SPS upregulation or invertase suppression.
The significant DLI × flower interaction for sucrose suggests that sink regulation through flower thinning amplifies sucrose accumulation only when the light supply is sufficient, with the sucrose content tending to be highest at moderate flower numbers rather than maximal thinning under high light conditions. Under DLI 15 and 17.5, flower thinning had no meaningful effect on the sucrose content, likely due to insufficient total carbon availability to drive differential sugar metabolism regardless of the crop load.
The shift toward sucrose dominance under DLI 20 is consistent with the substantial changes in carbohydrate metabolism and ripening-associated gene expression that occur during strawberry fruit development (Manning 1998; Sturm and Tang 1999; Sturm et al. 2003). Notably, fructose and glucose were highest at DLI 17.5 rather than DLI 15. This pattern may reflect differences in the carbon supply and sugar partitioning across light environments, but direct measurements of photosynthesis and sugar-metabolizing enzyme activities would be required to identify the underlying mechanism.
Study limitations and future directions
The DLI range used in this study was selected based on previously reported optimal light conditions for strawberry production under controlled-environment agriculture and indoor cultivation systems (Lee et al. 2015; Park et al. 2023) and was divided into three levels to evaluate the trade-off between energy input costs and fruit production outcomes. It was hypothesized that an optimal DLI could be identified by balancing fruit yield and quality, given that lower DLI conditions are more economically favorable in terms of electricity consumption. However, both fruit size and marketable yield showed a consistent upward trend with the DLI across all flower-thinning treatments. A clear optimum within the tested range could not be determined, which is consistent with previous reports showing positive responses in strawberry productivity to increased light availability under controlled conditions (Yoshida et al. 2016; Alvarado-Camarillo et al. 2024).
Notably, when the DLI approached the upper boundary of the tested range, a tendency toward a reduced number of leaves and reduced vegetative growth was observed, suggesting that assimilate partitioning increasingly favored reproductive organs over vegetative tissues at higher light levels. In addition, previous studies have shown that photosynthetic characteristics and the carbon assimilation capacity are strongly associated with environmental conditions and source strength in strawberry plants (Choi and Jeong 2020). With regard to the sugar composition, DLI 20 was associated with a marked increase in the sucrose concentration, reflecting enhanced photosynthetic carbon fixation and sucrose phosphate synthase activity under high light conditions (Yoshida et al. 2016; Alvarado-Camarillo et al. 2024). These findings indicate that a wider DLI range, combined with varied photoperiod and light intensity combinations, should be examined in future studies to precisely determine the optimum DLI for strawberry production in vertical farms. Additionally, the interaction between the DLI and leaf-pruning level regarding assimilate distribution and fruit quality warrants further investigation under more diverse growing conditions.
Conclusion
This study demonstrated that the DLI is a primary determinant of marketable fruit production and sugar composition in ‘Kuemsil’ strawberry cultivated in a vertical farm. Increasing the DLI to 20 mol·m-2·d-1 significantly increased marketable fruit production and shifted the sugar composition toward greater sucrose accumulation. Because SPS and invertase activities were not measured, this shift cannot be attributed directly to changes in these enzymes and should instead be interpreted as evidence that the DLI modifies fruit sugar partitioning. Flower thinning alone did not significantly influence the marketable yield, but it showed a significant interaction with the DLI for the sucrose content, indicating that sink regulation can modify sugar accumulation under sufficient light. Overall, DLI 20 mol·m-2·d-1 combined with moderate flower retention provided favorable fruit production and sugar characteristics under the conditions tested.
Supplementary Material
Supplementary materials are available at Horticultural Science and Technology website (https://www.hst-j.org).
- HORT_20260043_Table_S1.pdf
Supplementary Table S1. Factorial combination of daily light integral (DLI) and flower thinning treatments applied to ‘Kuemsil’ strawberry in a vertical farm
- HORT_20260043_Table_S2.pdf
Supplementary Table S2. Spectral characteristics of the LED lighting system as measured by a spectroradiometer at four PPFD levels within the range used for the DLI treatments in ‘Kuemsil’ strawberry cultivation
