

Introduction
Materials and Methods
Plant materials
Investigation of fruit-shape-related traits and statistical analysis
Genetic analysis
BSA sequencing and analysis
F2 population sequencing and bin marker genotyping
Genetic map construction and QTL mapping
Marker development for major-effect QTL
Results
Inheritance of bitter gourd fruit-shape-related traits
BSA mapping
SNP and bin marker genotyping in the F2 population
QTL mapping based on the genetic bin map
Closely linked marker development
Discussion
Introduction
Bitter gourd is an annual climbing herbaceous plant from the Cucurbitaceae family. It is distributed across the tropics, mainly in Africa, South Asia, Southeast Asia, and East Asia. Bitter gourd fruit is not only nutritious but also rich in various bioactive ingredients that benefit human health, including peptides, polysaccharides, flavonoids, and cucurbitane triterpenoids (Tan et al. 2016; Jia et al. 2017). In this view, bitter gourd is a widely used medicinal and culinary vegetable. In recent years, bitter gourd consumption has grown in popularity in China, resulting in a steady expansion of growing areas from south to north. Experts estimate that China's annual bitter gourd cultivation now covers over 200,000 hectares. Bitter gourd varies in fruit shape in natural populations and has rich variations, including oval, spindle, conical, stick-shaped or cylindrical (McCreight et al. 2013). Conical and stick-shaped bitter gourds are the two main types of fruit shapes in the Chinese consumer market. Fruit shape is a crucial trait influencing the product type and market segmentation of bitter gourd. With respect to product type in China, Dading bitter gourd, Pearl bitter gourd, and Smooth bitter gourd are the three main types (Cui et al. 2022). Dading bitter gourd has a conical shape and is peculiar to South China; Pearl and Smooth bitter gourd are mostly stick-shaped and are the most mainstream types in the market.
Fruit shape is measured by means of intuitive descriptions and by calculating the fruit shape index (FSI) (Qiao et al. 2011). Since the beginning of the molecular breeding stage, the discovery of genetic variants related to fruit shape has become a very popular research topic in relation to cucurbit crops. Cucumber and melon, for example, contain roughly 200 QTL loci related to fruit length (FL), fruit diameter (FD), and the fruit shape index (FSI) (Pan et al. 2020; Wang et al., 2020). Among them, cloned genetic loci related to fruit shape in cucumber include FS1.2 (Pan et al. 2017), SF1 (Xin et al. 2019), SF2 (Zhang et al. 2020), sf3 (Wang et al. 2021), and FS2.1 (Xie et al. 2023). The genetic loci related to fruit shape cloned in melon include CmFSI8/CmOFP13/ fsqs8.1 (Ma et al. 2022; Martínez-Martínez et al. 2022). However, there are limited reports on the genetic mapping of the shape of bitter gourd fruit. The first report identified two QTL for fruit length (qFrLng1, qFrLng2) and one for fruit diameter (qFrDiam1) based on a genetic map constructed using 108 AFLP (amplified fragment length polymorphism) markers (Kole et al. 2012). A subsequent investigation revealed four QTL for fruit length (fl1.1, fl2.1, fl5.1, fl9.1), five for fruit diameter (fd1.1, fd1.2, fd9.1, fd9.2, fd11.1), and five for the fruit shape index (fs4.1, fs5.1, fs5.2, fs9.1, fs11.1) based on a genetic map constructed using 194 markers, including 54 SSRs (simple sequence repeats), 124 AFLPs, and 16 SRAPs (sequence-related amplified polymorphisms) (Wang and Xiang 2013). Furthermore, three QTL for fruit length (qFL1, qFL5, qFL14) and six for fruit diameter (qFD1, qFD3, qFD13, qFD15, qFD16, qFD20) were detected based on a genetic map constructed using 2,013 SNP markers (Rao et al. 2021). A genetic map constructed using 3,144 SNP markers yielded five QTL for fruit length (qFL. pau_8.1, qFL. pau_8.2, qFL. pau_8.3, qFL. pau_10.1, qFL. pau_11.1) and five for fruit diameter (qFD. pau_3.1, qFD. pau_8.1, qFD. pau_9.1, qFD. pau_9.2, qFD. pau_11.1) (Kaur et al. 2022). The majority of the QTL related to bitter gourd fruit shapes as mentioned above have low genetic effects and lack precise chromosomal position information, making it difficult to compare the findings from different studies and develop reliable markers.
In the present study, we constructed an F2 population with fruit-shape segregation using the stick-shaped inbred line ‘K44’ as the maternal parent and the conical-shaped inbred line ‘Tan’ as the paternal parent. Four generations, P1, P2, F1, and F2, were obtained. First, fruit-shape-related traits in the four generations of bitter gourd were evaluated using the mixed major genes plus polygenes inheritance model. Second, the QTL of fruit-shape-related traits in bitter gourd was mapped by BSA (bulk segregate analysis) sequencing integrated with a genetic map constructed based on re-sequencing. This work establishes a theoretical basis for the molecular-assisted breeding of bitter gourd fruit shapes.
Materials and Methods
Plant materials
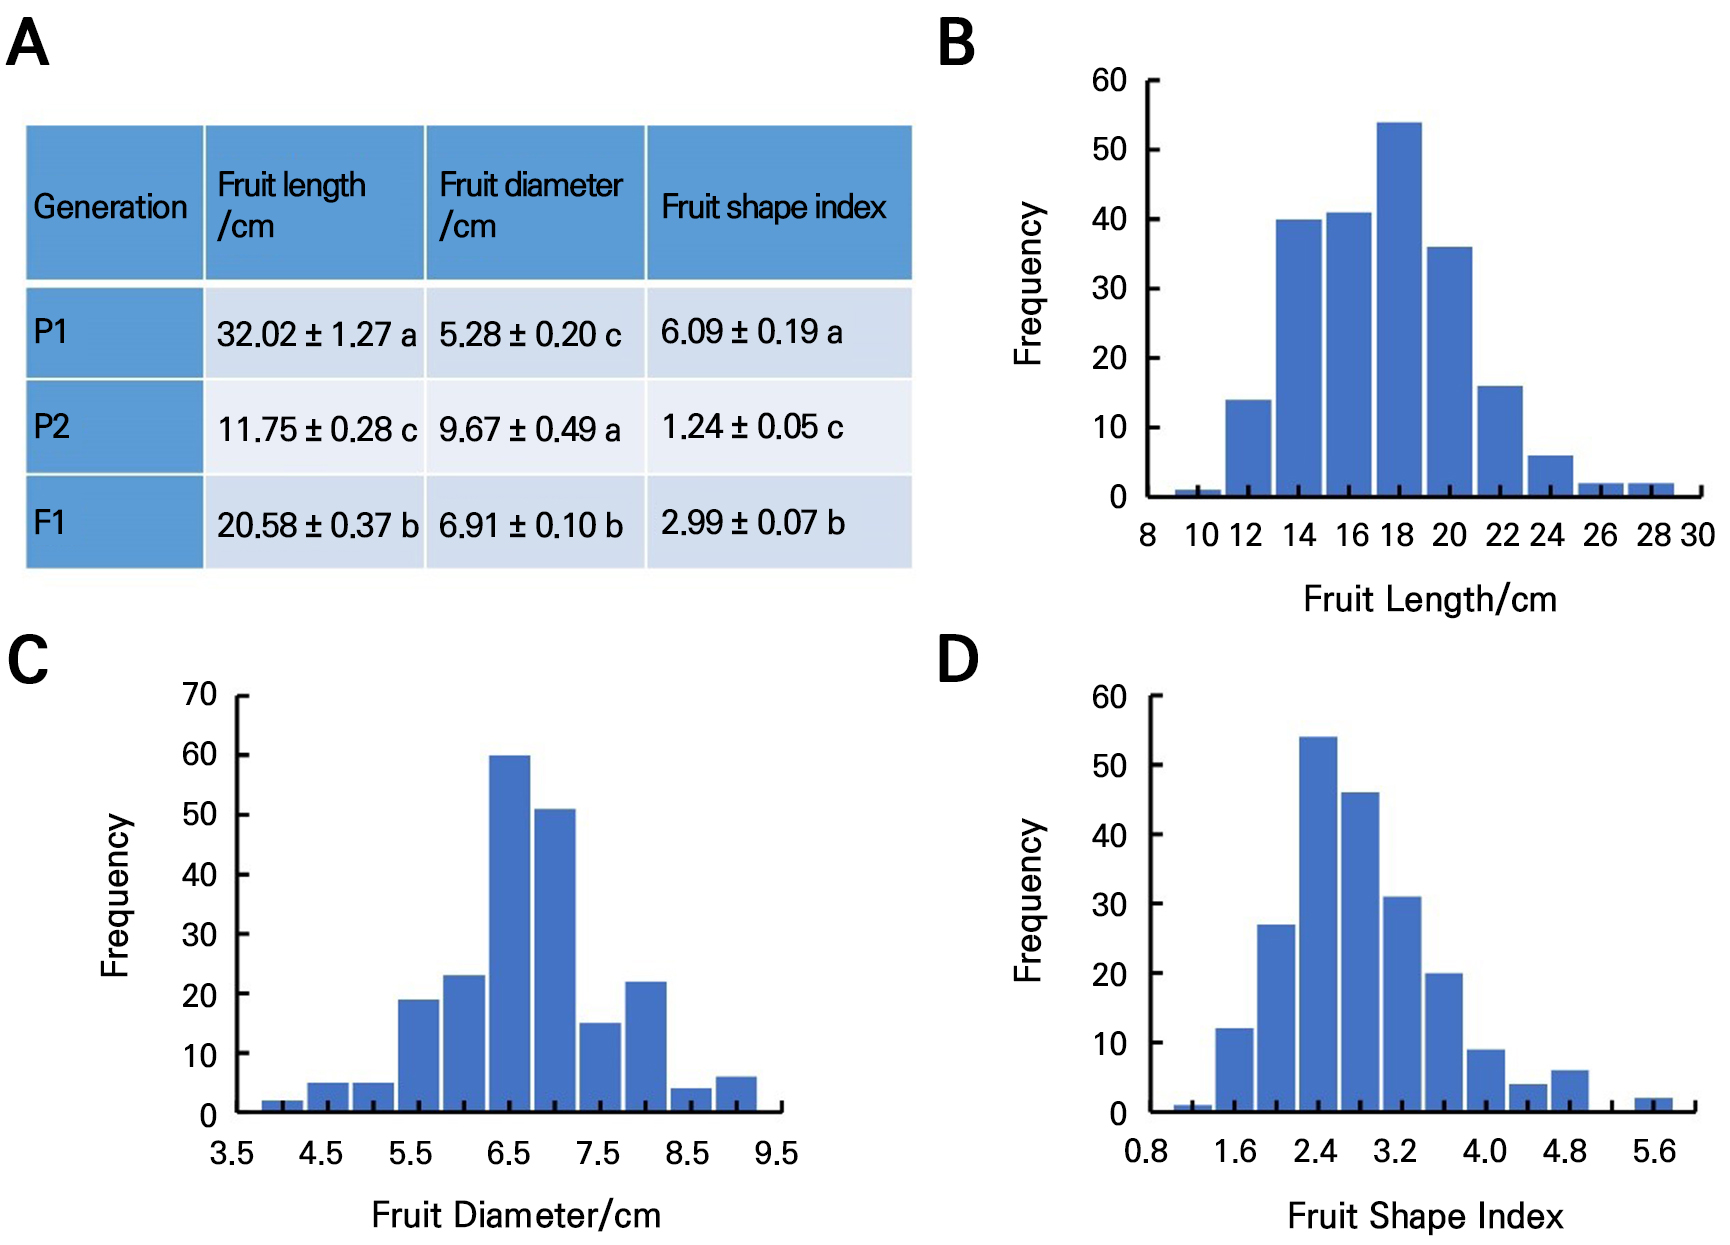
The bitter gourd inbred line ‘K44’ (FSI=6.09 ± 0.19) with a stick-shaped fruit was selected as the female parent (P1), and the inbred line ‘Tan’ (FSI=1.24 ± 0.05 cm) with a conical-shaped fruit was selected as the male parent (P2) in this investigation. F1 seeds were obtained in the autumn of 2021 by hybridizing ‘K44’ with ‘Tan’. F1 self-pollination yielded an F2 population of 303 individual plants in the spring of 2022. The P1, P2, F1, and F2 generations were all planted in the autumn of 2022. Additionally, to verify the accuracy of the genetic loci for bitter gourd fruit shape, we also constructed another F2 population consisting of 154 individual plants derived from a cross between the inbred line ‘Nan’ (FSI = 2.17 ± 0.58) with a spindle-shaped fruit and the inbred line ‘Tan’. All materials were planted at the Shapu Breeding Base in Zhaoqing City (23°17'N, 112°57'E), with agronomic management following local standards.
Investigation of fruit-shape-related traits and statistical analysis
Commercial fruits with good development on the main vine were selected for the examination. The investigated traits included the fruit length (FL), fruit diameter (FD), and the fruit shape index (FSI), which was determined as the ratio of the fruit length to the fruit diameter. In addition, the intuitive description of the fruit shape was designated as FS by recording stick-shaped fruit or a conical-shaped fruit. The basic statistics and differences of fruit-shape-related traits in different generations were analyzed using Excel and SPSS software.
Genetic analysis
This investigation employed the SEA-G4F2 software package (Wang et al. 2022) to conduct a genetic analysis of fruit-shape-related traits in the four-generation population. The optimal genetic model was determined using the Akaike Information Criterion (AIC) and tests of goodness-of-fit for the optimal genetic model, and the first-order genetic parameters and second-order genetic parameters of the optimal genetic model were estimated.
BSA sequencing and analysis
The fruit shapes of 303 individual plants of ‘K44’ × ‘Tan’ F2 generation were evaluated. Subsequently, 21 plants with an extremely high fruit shape index (stick-shaped pool; S-pool) and 21 plants with an extremely low fruit shape index (conical-shaped pool; C-pool) were selected to generate mixed pool samples. Young leaves from two parents and two mixed pools were collected for DNA extraction and quality testing. Qualified DNA samples were sequenced through BGI’s DNBseq platform.
The effective reads were aligned to the ‘Dali-11’ reference genome (Cui et al. 2020). The SNP variation in the sample was detected using GATK software (McKenna et al. 2010). The SNPs with low quality and low coverage levels were filtered. High-quality polymorphic SNPs from two pools were used to calculate the SNP index and Δ (SNP-index).
The calculation method for Δ (SNP-index) is as follows:
Δ (SNP-index) = SNP-index (S-pool) – SNP-index (C-pool)
F2 population sequencing and bin marker genotyping
DNA sequencing libraries were constructed using the VAHTS Universal Plus DNA Library Prep Kit for Illumina (Vazyme) following the manufacturer’s protocol. The libraries were then sequenced on the GenoLab M platform, yielding 150 bp paired-end reads with insert sizes of around 350 bp. The raw reads were filtered using cutadapt v 4.4 (Martin 2011) with the following criteria: “--max-n -q 20,20 -m 30 -e 0.2 -j 4 -n 10”. Clean reads were aligned to the ‘Dali-11’ reference genome (Cui et al. 2020) using BWA (Li and Durbin 2009) with the ‘mem -t 4 -k 32’ settings. The alignment files were then converted into BAM files using SAMtools (Li et al. 2009). SNP calling was performed for all samples using GATK software (McKenna et al. 2010).
A sliding window approach of collectively examining genome-wide SNPs was applied for bin marker genotyping (Huang et al. 2009). Genotypes were called based on SNP ratios by scanning a window with a size of 15 SNPs. The ratio of ‘K44’ to ‘Tan’ SNPs was computed for each window. A window with 70% or more SNPs from either parent was termed a homozygous genotype for that parent; otherwise, the window was considered a heterozygous genotype. A bin map was constructed by comparing the genotypes of F2 individuals over 100 kb intervals. Adjacent 100 kb intervals with the same genotype across all F2 individuals were pooled into a recombination bin.
Genetic map construction and QTL mapping
The acquired bin markers were loaded into the JoinMap4.1 software (Van Ooijen 2006), and extremely distorted loci were filtered via a Chi-square test. The regression mapping algorithm and the Kosambi mapping function were employed for genetic mapping. Based on the mapping results, a map file (.map), a genotype file (.loc), and a phenotype file (.qua), were generated and subsequently imported into the MapQTL6 software (Ooijen 2009). QTL detection was performed using the interval mapping (IM) method, and the significance threshold of the LOD score was tested by 1,000 permutations. The genome-wide P-value threshold was 0.05. The confidence interval was delimited by the ‘one-LOD support interval’ method (Hackett 2002; Collard et al. 2005).
Marker development for major-effect QTL
BSA and linkage mapping results revealed the major-effect QTL of bitter gourd fruit shape. SSR and InDel markers were developed based on published reference genome and genomic variation data of bitter gourd in the major-effect region (Cui et al. 2017; Cui et al. 2020). Markers with polymorphisms between ‘K44’ and ‘Tan’ were used for genotyping individuals from two BSA populations. Linkage analysis revealed markers strongly linked to the genetic loci of fruit shape.
Results
Inheritance of bitter gourd fruit-shape-related traits
A statistical and comparative analysis of the fruit-shape-related traits of the two bitter gourd inbred lines ‘K44’ (P1) and ‘Tan’ (P2) revealed significant variations in the fruit length, diameter, and shape index between the two parents. The fruit length of the F1 generation was slightly inclined to P1, while the fruit diameter and shape index of the F1 generation were slightly inclined to P2 (Fig. 1A). Fruit length, fruit diameter, and the fruit shape index varied continuously in the F2 population, consistent with quantitative trait genetics (Fig. 1B, 1C, and 1D).
Bitter gourd fruit-shape-related traits were genetically analyzed using a mixed major genes plus polygenes inheritance model, and the relevant parameters of 24 genetic models were calculated (Table 1). Suitable candidate models for fruit length were identified as 1MG-AD (one pair of additive-dominant major genes), 1MG-A (one pair of additive major genes), and 2MG-EAD (two pairs of equivalent dominant major genes) based on the principle of minimum AIC value. The candidate suitable models for fruit diameter included 1MG-AD, 1MG-A, and 2MG-EA (two pairs of equivalent additive major genes). The candidate suitable models for the fruit shape index included 1MG-A, 1MG-NCD (one pair of negatively complete dominant major genes), and 2MG-EAD.
To determine the optimal genetic model, goodness-of-fit tests were conducted on the three suitable candidate models of the fruit length, fruit diameter, and fruit shape index (Tables 2, 3, and 4). All candidate-suitable models had statistical significance levels of zero. As a result, the optimal genetic models for the fruit length, fruit diameter, and fruit shape index were identified as 1MG-A (one pair of additive major genes), 2MG-EA (two pairs of equivalent additive major genes), and 1MG-NCD (one pair of negatively complete dominant major genes), respectively, by comparing the AIC values. The major gene for the fruit shape index had variation of 0.22 and heritability of 39.56% (Table 5).
In addition, 169 F2 individual plants with distinct fruit shapes were observed in terms of FS. Of the 169 F2 plants, 124 had stick-shaped fruit and 45 had conical-shaped fruit, which fits the 3:1 segregation ratio (χ² = 0.24, P = 0.63), indicating that stick-shaped fruit is a dominant character.
Table 1.
Estimations of MLV and AIC values of the different genetic models for fruit shape-related traits
MLV: maximum likelihood-value; AIC: Akaike information criterion; A: additive; AD: additive-dominant; ADI: additive-dominant-epistasis; CD: complete dominance; EA: equal additive; NCD: negatively CD; EAD: equal additive-dominant; MG1: one major gene; MX1: one major gene plus polygenes; MG2: two major genes; MX2: two major genes plus polygenes; PG: polygenes.
Table 2.
Tests of the goodness-of-fit model of the fruit length in different generations
Table 3.
Tests of the goodness-of-fit model of the fruit diameter in different generations
Table 4.
Tests of the goodness-of-fit model of the fruit shape index in different generations
Table 5.
Estimations of genetic parameters of the fit model of the fruit shape index
| Genetic parameters | Fruit shape index | |
| Best-fitting model | 1MG-NCD | |
| First-order parameter | m | 2.93 |
| d | 0.53 | |
| Second-order parameter | δ2p | 0.56 |
| δ2G | 0.43 | |
| δ2mg | 0.22 | |
| h2mg/% | 39.56% | |
| δ2mg/δ2G (%) | 51.16% |
BSA mapping
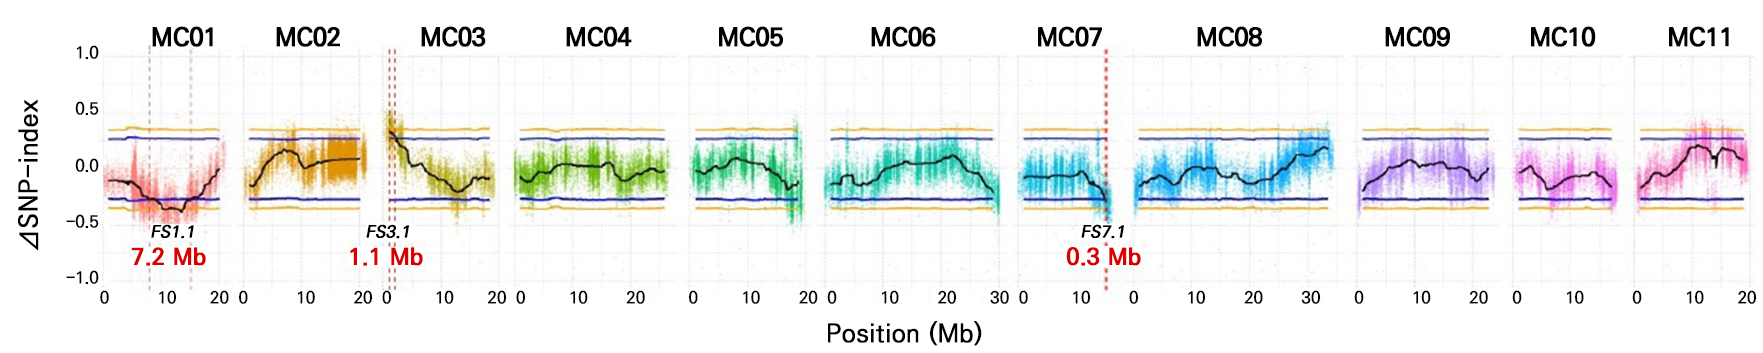
Four DNA samples (‘K44’, ‘Tan’, C-pool, and S-pool) were sequenced, yielding 756.02 million clean reads. C-pool and S-pool yielded 194.51 and 194.11 million clean reads, respectively (Table 6). Clean reads from C-pool and S-pool exhibited high sequencing depths (98.91× and 98.69×, respectively). The clean reads from both parents were aligned to the bitter gourd ‘Dali-11’ reference genome. A total of 575,400 homozygous SNPs were detected between the two parents, with 444,867 SNPs remaining after filtering out low-quality SNPs. Δ(SNP-index) was calculated and plotted by comparing the SNP index of the C-pool and S-pool on the chromosomes (Fig. 2). Three genetic loci regulating fruit shape were identified on chromosomes MC01, MC03, and MC07 with 95% confidence. The corresponding loci were FS1.1, FS3.1, and FS7.1, with interval sizes of 7.2 Mb (MC01: 8.0–15.2 Mb), 1.1 Mb (MC03: 1.0–2.1 Mb), and 0.3 Mb (MC07: 15.0–15.3 Mb), respectively (Fig. 2).
SNP and bin marker genotyping in the F2 population
We generated 754.37 Gb of clean data (∼5.03 billion reads) for 303 F2 individuals (Supplementary Table 1). The sequencing depths of F2 individuals were between 4.37 and 10.99, with an average of 7.13. The average genome coverage was approximately 90.92%%, with an average GC content of 36.77%. The average Q20 for these samples was 95.52%, demonstrating high-quality sequencing data (Supplementary Table 1). The number of called SNPs for each F2 individual is presented in Supplementary Table 2, ranging from 161,663 to 306,675, with an average of 225,830. A bin map representing recombination intervals was generated using a sliding window method, yielding 1,093 bin markers on 11 chromosomes.
Table 6.
Statistics of clean data
QTL mapping based on the genetic bin map
A total of 1,093 bin markers were used for genetic linkage mapping. After filtering out extremely distorted loci, 486 bin markers were then integrated into 11 linkage groups (Fig. 3). Combining this genetic map and fruit-shape-related traits for QTL mapping, the resultant LOD thresholds for fruit length (FL), fruit diameter (FD), the fruit shape index (FSI), and fruit shape (FS) were 3.70, 3.80, 3.90, and 3.80, respectively, corresponding to a genome-wide threshold with a P-value of 0.05 (Supplementary Table 3). For these four traits, one QTL each was identified, and all were mapped on chromosome MC01, specifically qFL1.1, qFD1.1, qFSI1.1, and qFS1.1, with corresponding LOD scores of 5.52, 4.87, 5.09, and 5.85 (Table 7). Overall, four major-effect QTL, qFSI1.1, qFS1.1, qFL1.1, and qFD1.1, were identified, with explained variances of 10.50%, 14.70%, 11.30%, and 10.00%, respectively. The physical regions of the four QTL varied from 2.22 to 5.62 Mb (Table 7).

Table 7.
QTL of fruit-shape-related traits identified in the ‘K44’ × ‘Tan’ F2 population
Closely linked marker development
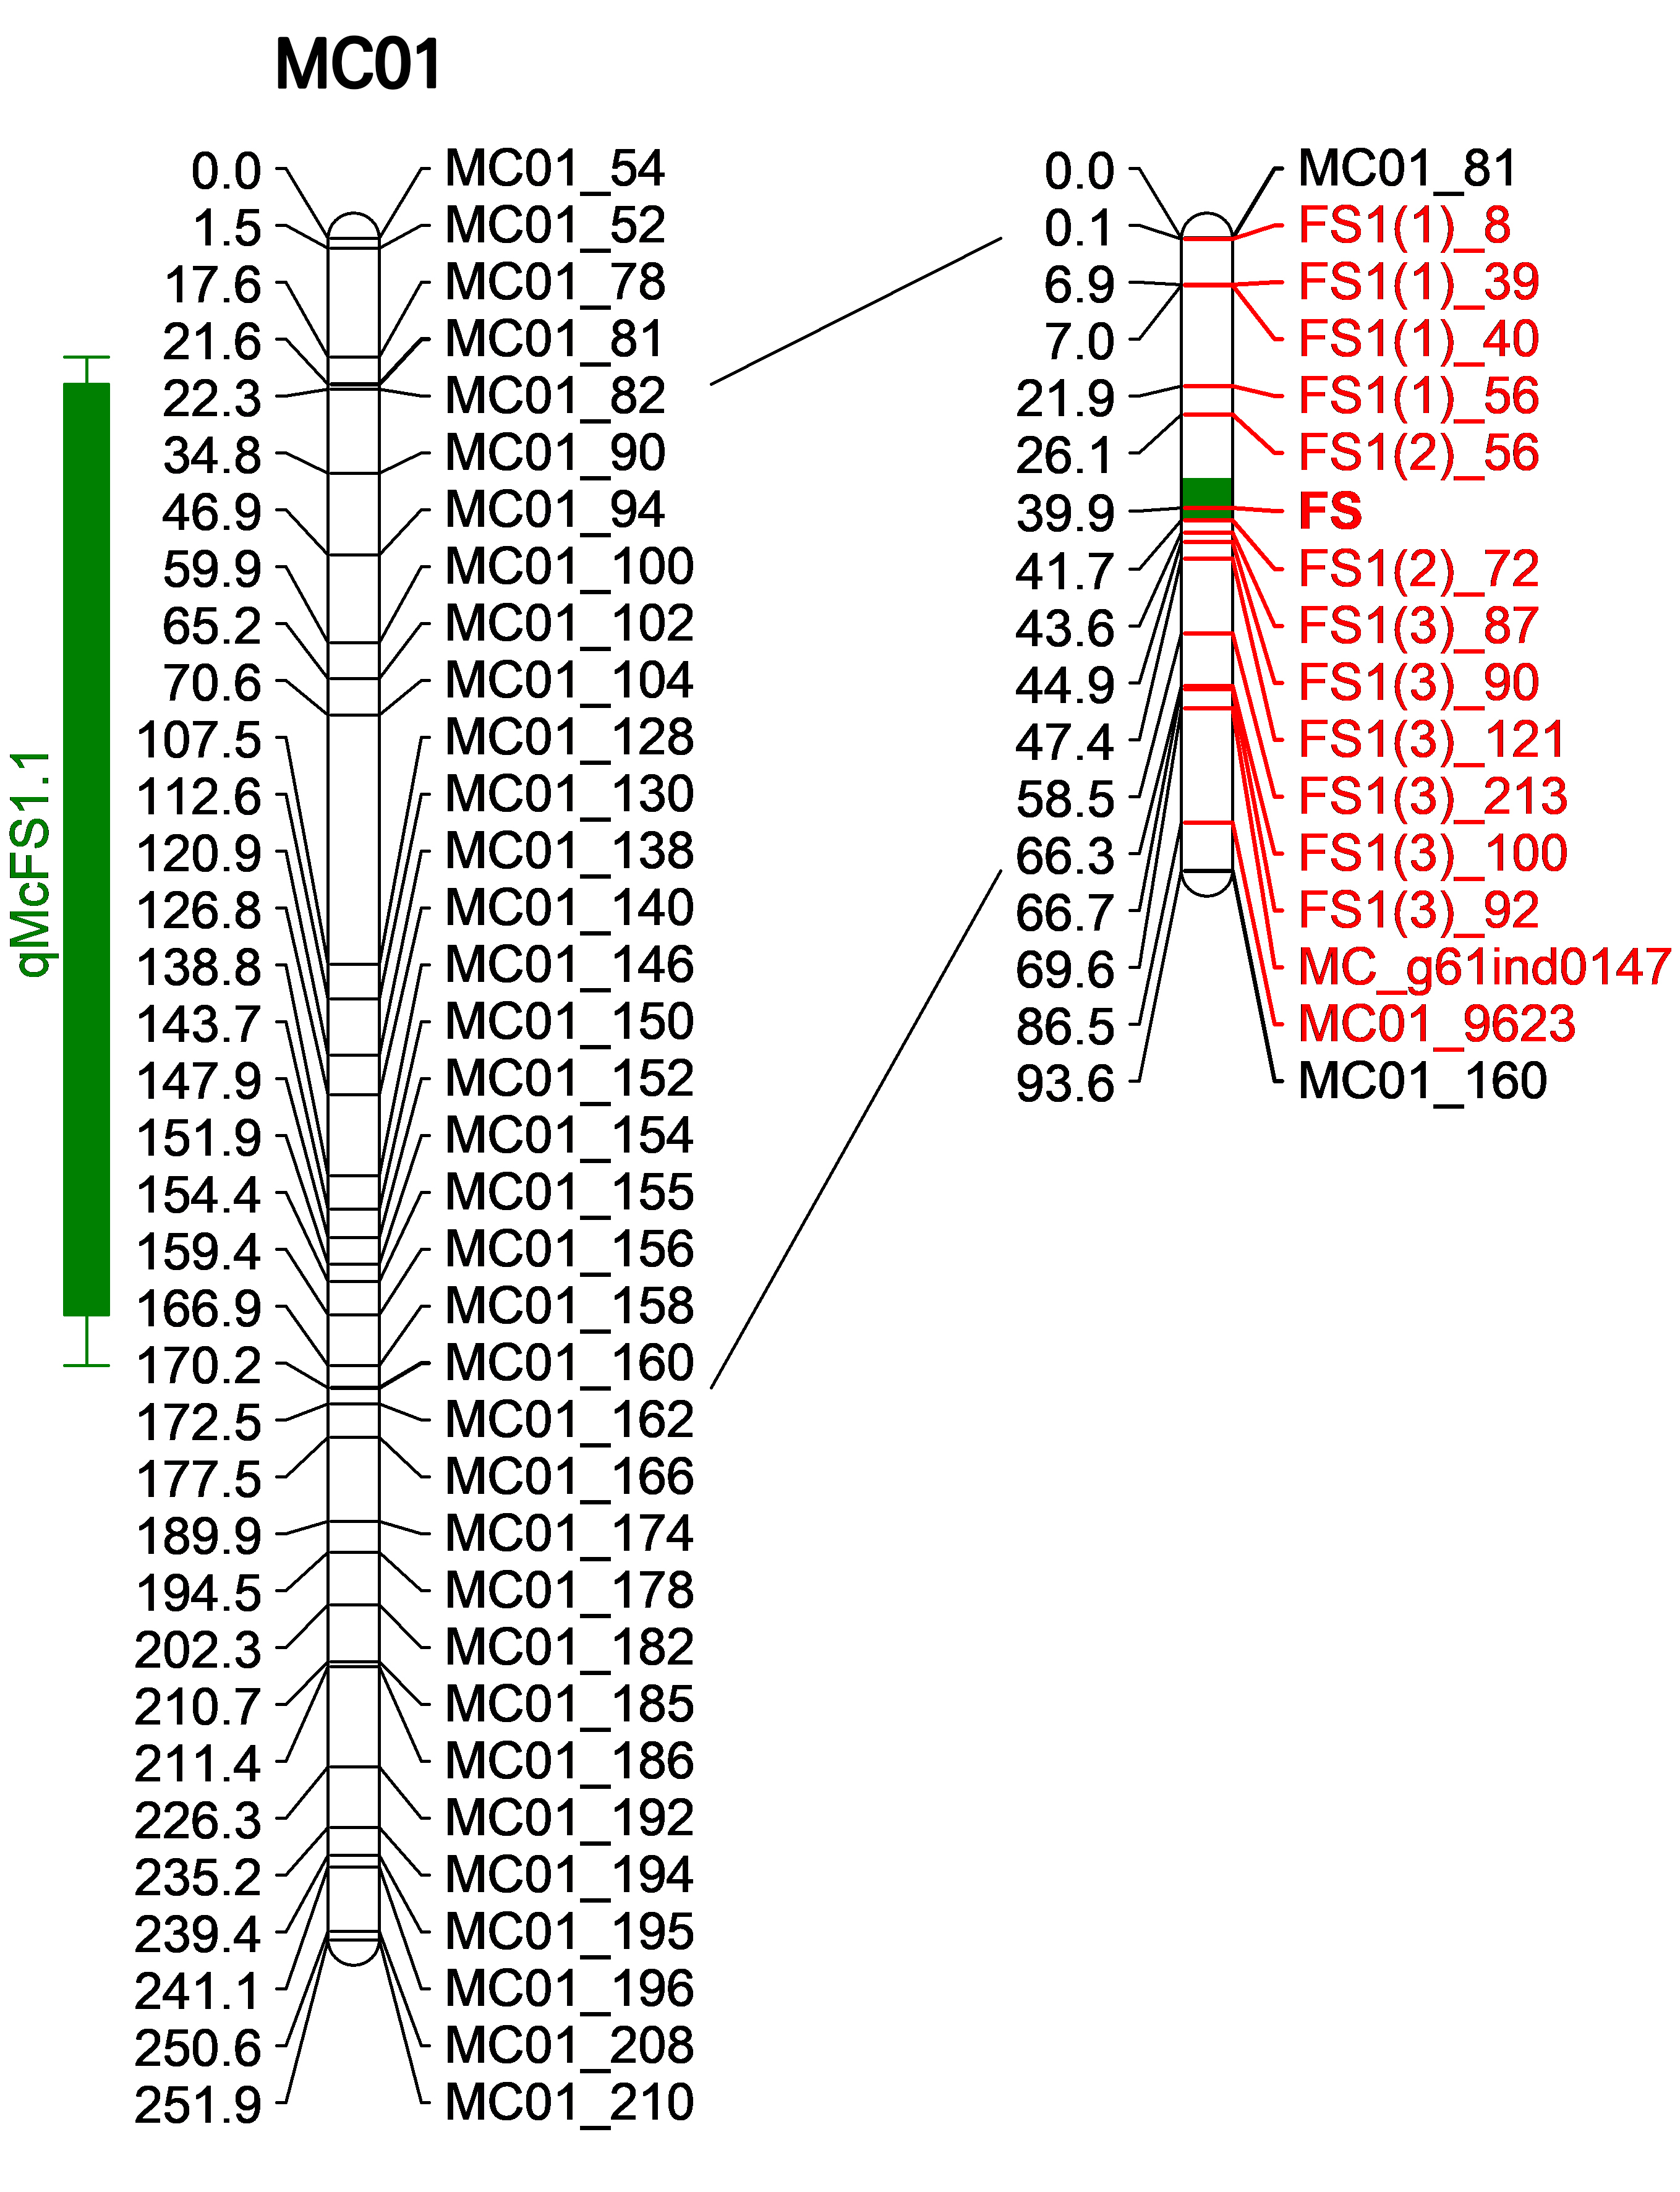
Combining the results of BSA mapping and genetic linkage mapping, we discovered a consensus and major-effect QTL region (designated as qMcFS1.1) on MC01, spanning about 93.15 cM (31.46 cM–124.61 cM) and 7.02 Mb (9.04 Mb–16.06 Mb) with regard to the genetic and physical intervals, respectively (Fig. 4). Surprisingly, the major-effect QTL for FSI identified using the ‘Nan’ × ‘Tan’ F2 population also overlapped with this region (Supplementary Table 4). To narrow down the candidate region further, we designed 192 SSR and 653 InDel markers within this region. Polymorphic markers between ‘K44’ and ‘Tan’ were utilized to genotype 21 S-pool (stick-shaped pool) individuals and 21 C-pool (conical-shaped pool) individuals. The fruit shape of individuals in the two BSA populations served as a phenotypic marker, denoted by FS. Finally, one SSR and 13 InDel markers (Supplementary Table 5) delimited the qMcFS1.1 locus into a significantly reduced region (designated as FS), with 15.66 cM and 452.63 kb for the genetic and physical intervals, respectively. A closely linked marker, FSI(2)_72, located merely 1.80 cM from the FS locus, was identified.
Discussion
Fruit is the main edible organ of cucurbit crops and comes in various shapes (Pan et al. 2020). The enormous variation of fruit shape in cucurbits provides a valuable study setting for investigating the genetic basis that influences fruit shape formation, which aids in effectively regulating fruit shape in breeding programs. Several fruit-shape genes have been reported in model plant tomatoes, such as the SUN (Xiao et al. 2008), OVATE (Liu et al. 2002), FAS (Cong et al. 2008), LC (Muños et al. 2011), and GLOBE types (Sierra-Orozco et al. 2021). Homologs regulating fruit shape were recently identified in cucurbits. Researchers have identified Ovate and SUN genes underlying fruit shape in cucumber (Pan et al. 2017), wax gourd (Cheng et al. 2021), melon (Ma et al. 2022; Martínez-Martínez et al. 2022), and watermelon (Duan et al. 2022). In addition, certain other genes influencing fruit shape in cucumber were identified, such as SF1 (encoding a RING-type E3 ligase) (Xin et al. 2019), SF2 (encoding a histone deacetylase protein) (Zhang et al. 2020), Sf3 (encoding a katanin p60 subunit) (Wang et al. 2021), and FS2.1 (encoding a TONNEAU1 recruiting motif protein) (Xie et al. 2023). These findings demonstrate that the genetic variants influencing cucurbit fruit shape are diverse. Therefore, identifying the underlying QTL sites is crucial for fine mapping and cloning of these fruit-shape genes.
The mixed major genes plus polygenes inheritance model was used to investigate the genetic model of fruit-shape-related traits in bitter gourd. Except for FD, the optimal genetic models of FL and FSI were regulated by one pair of major genes. The optimal genetic model of FSI was 1MG-NCD (one pair of negatively complete dominant major genes). In addition, Mendelian genetic analysis revealed that the stick-shaped fruit was a dominant trait over the conical-shaped fruit. These results demonstrate that the inheritance of bitter gourd fruit shape is regulated by one pair of major genes, consistent with previous studies of watermelon (Li et al. 2021), wax gourd (Cheng et al. 2021), and cucumber (Xie et al. 2023). The major gene for FSI had 39.56% heritability, which accounted for 53.66% of the total genetic variance, indicating that this trait is suitable for genetic mapping.
For the genetic mapping of agronomic traits, approaches such as BSA mapping, linkage mapping, whole-genome association analysis, or a combination of these methods for joint mapping are commonly used. The latter strategy allows for reciprocal verification of mapping results, which increases the accuracy. The joint mapping strategy has been applied in the genetic mapping of husk traits in maize (Cui et al. 2018), fruit-related traits in pepper (Lee et al. 2020), early flowering of female flowers in zucchini (Shu-Ping et al. 2023), seed coat color (Zhong et al. 2022) and gynoecy (Zhong et al. 2023) in bitter gourd, and all of the mapping results showed consistency and stability. Several previous studies have identified certain QTL loci for fruit length and fruit diameter in bitter gourd, but there is a lack of information pertaining to the fruit shape index (Kole et al. 2012; Rao et al. 2021; Kaur et al. 2022). Wang and Xiang (2013) identified four QTL loci for fruit length, five for fruit diameter, and five for fruit shape index, but there was a lack of consistency or correlations among these loci. The present work discovered four QTL loci (qFSI1.1, qFS1.1, qFL1.1, qFD1.1) on MC01 related to bitter gourd fruit shape using a linkage mapping method. All four QTL loci were consistent with the FS1.1 locus identified through BSA mapping, and the genetic effect values of qFSI1.1, qFS1.1, qFL1.1, and qFD1.1 loci were relatively high (Expl. > 10%), indicating that this consensus QTL locus was a major-effect candidate influencing bitter gourd fruit shape.
Many consensus QTL loci, particularly those with major effects, have been discovered in cucumber, melon, and watermelon (Pan et al. 2020), and the physical intervals between many consensus QTL loci were large. Similarly, the major-effect QTL qMcFS1.1 discovered in this study spanned approximately 7.02 Mb with a large physical interval. Although this region was reduced to a 452.63 kb interval by developing molecular markers in this interval, additional research is required to fine-map and clone this locus.
Supplementary Material
Supplementary materials are available at Horticultural Science and Technology website (https://www.hst-j.org).
- HORT_20250040_Table_S1.xlsx
Supplementary Table 1. The mapping rate and coverage of clean reads statistics for each sample
- HORT_20250040_Table_S2.xlsx
Supplementary Table 2. The statistics of SNPs detected in each sample
- HORT_20250040_Table_S3.xlsx
Supplementary Table 3. Permutation test and significance threshold of the QTL
- HORT_20250040_Table_S4.xlsx
Supplementary Table 4. QTL of fruit shape index identified in ‘Nan’ × ‘Tan’ F2 population
- HORT_20250040_Table_S5.xlsx
Supplementary Table 5. Primers for linked marker development
