

Introduction
Materials and Methods
Plant materials
Thermal stress treatments
Extraction and quantitative high-performance liquid chromatography of cannabinoids
Identification of cannabinoid biosynthesis genes
Total RNA isolation and quantitative RT-PCR analysis
Results and Discussion
Cannabinoid content in different organs of C. sativa L.
Cannabinoid contents under thermal stress
Expression levels of cannabinoid biosynthetic genes in C. sativa L.
Conclusion
Introduction
Industrial hemp (Cannabis sativa L.), belonging to the Cannabaceae family, is a dicotyledonous species that serves as a primary source of human food products, medicine, oil, and fiber (Quimby et al. 1973; Kriese et al. 2004). Cannabis plants contain a diverse array of primary and secondary metabolites, including steroids, fatty acids, amino acids, terpenoids, alkaloids, cannabinoids, flavonoids, stilbenoids, and lignans (Flores-Sanchez and Verpoorte 2008). Cannabinoids are unique, biologically active secondary metabolites found in C. sativa L., and nearly 150 types have been identified. These include cannabidiol (CBD), Δ9-tetrahydrocannabinol (Δ9-THC), cannabichromene (CBC), cannabigerol (CBG), and cannabinol (CBN), along with corresponding propyl homologs such as cannabidivarin, tetrahydrocannabivarin, cannabichromevarin, and cannabigerivarin (Radwan et al. 2009; De Meijer and Pertweem 2014; Hanuš et al. 2016). Large quantities of the acidic forms of these cannabinoids, specifically tetrahydrocannabinolic acid (THCA) and cannabidiolic acid (CBDA), are present in these plants (De Meijer et al. 2009; Swift et al. 2013). In hemp, these pharmaceutically valuable compounds are primarily synthesized in the secretory cells of glandular trichomes, which are found in female flowers and fruits (Russo 2011; Small 2015). Cannabinoids have shown significant potential, attracting interest from various medical fields for their applications in treating sleep disorders, epilepsy, cancer, and other conditions (Taura et al. 1996).
C. sativa L. plants exhibit variability in the relative proportions of THCA, CBDA, and cannabigerolic acid (CBGA), leading to the classification of different chemotypes. Based on these chemotypes, these plants can be categorized into five distinct groups with regard to the differential production of cannabinoids (De Meijer and Hammond 2005; De Meijer et al. 2009). Classification of C. sativa L. plants into distinct chemotypes relies on their cannabinoid profiles. “Type I” plants are characterized by high levels of THCA and low levels of CBDA. “Type II” plants show balanced amounts of THCA and CBDA. “Type III” plants produce high levels of CBDA and lower levels of THCA. “Type IV” plants predominantly contain CBGA, the precursor of both CBDA and THCA (Lazarini-Lopes et al. 2020). Lastly, “Type V” plants, referred to as “cannabinoid-free”, lack detectable amounts of any of the three previously mentioned cannabinoids (De Meijer and Hammond 2005; De Meijer et al. 2009).
CBGA is a pivotal precursor in cannabinoid biosynthesis. The production of CBGA involves an alkylation reaction between olivetolic acid (OLA) and geranyl diphosphate (GPP), catalyzed by the enzyme geranyl pyrophosphate: olivetolate geranyl transferase, also known as prenyltransferase or cannabigerolic acid synthase (Fellermeier and Zenk 1998). GPP is synthesized in the plastid via the 2-C-methyl-D-erythritol 4-phosphate pathway, which is a non-mevalonate pathway. Conversely, OLA is derived from hexanoic acid, which is initially converted into hexanoyl-CoA by hexanoyl-CoA synthetase (Stout et al. 2012). The transformation of hexanoyl-CoA into OLA requires the incorporation of three malonyl-CoA molecules in a process mediated by polyketide synthase and olivetolic acid cyclase (OAC) (Gagne et al. 2012). In the subsequent stages of cannabinoid biosynthesis, three crucial oxidocyclases—tetrahydrocannabinolic acid synthase (THCAS), cannabidiolic acid synthase (CBDAS), and cannabichromenic acid synthase (CBCAS)—are responsible for the stereo-specific cyclization of CBGA. These enzymes lead to the formation of different cannabinoids: THCA, cannabidiolic acid, and cannabichromenic acid (CBCA) (Sirikantaramas et al. 2004; Taura et al. 2007; Degenhardt et al. 2017).
The cannabinoid content of hemp is primarily determined by genetic factors; however, environmental conditions also play a significant role (Chandra et al. 2013; Namdar et al. 2018; Kovalchuk et al. 2020). The production of cannabinoids, such as THC and CBD, is greatly affected by various environmental factors and stressors, such as light, temperature, water deficit, nutrients, heavy metals, plant hormones, and soil bacteria as well as by biotic stressors, such as insects and microbial pathogens (Magagnini et al. 2018; Eichhorn Bilodeau et al. 2019; Caplan et al. 2019; Bernstein et al. 2019; Husain et al. 2019; Burgel et al. 2022). Cannabinoids can be affected by abiotic environmental stressors, particularly by the temperature (Qaderi et al. 2023). Temperature stress significantly affects the production of secondary metabolites in plants, particularly cannabinoids (Gorelick and Bernstein 2017). Therefore, temperature stress can have a crucial impact on the cannabinoid content in plants. Hence, understanding and controlling these changes is important for ensuring consistent drug quality.
In this study, we conducted quantitative comparisons of primary cannabinoid components (THCA, CBDA, CBD, and CBN) in three distinct cultivars of industrial hemp (C. sativa L.) across different organs and developmental stages after subjecting these samples to thermal stress conditions. Moreover, we analyzed the expression profiles of nine genes linked to the synthesis of cannabinoids, which are highly valuable bioactive compounds, in hemp plants. Additionally, we assessed the interconnections between metabolic pathways and transcriptional regulation of these genes.
Materials and Methods
Plant materials
Seeds of the Cannabis sativa L. cultivars Hot Blonde, Cherry Blossom, and Queen Dream were procured from Blue Forest Farms (https://blueforestfarms.com/). Initially, the seeds were germinated in soil under light intensity of 100 µmol·m-2·s-1. Approximately two weeks after germination, the seedlings were transplanted into larger pots and grown indoors in a growth chamber in Daejeon, Korea, under standard conditions for eight weeks. The growth chamber maintained a 16-hour light/8-hour dark cycle with fluorescent lights at an intensity of 200 µmol·m-2·s-1, a constant temperature of 24°C, and approximately 80% relative humidity. After repotting, the plants were subjected to a 12-hour light/12-hour dark cycle with a photon flux density of 200 µmol·m-2·s-1, maintaining a temperature of 24°C. At 75 days of age, samples were collected from the leaves, roots, and stems, with all samples collected under the same temperature condition of 24°C. Leaves were categorized based on their position and length to represent distinct developmental stages: upper leaves (UL) measured 3–5 cm, middle leaves (ML) measured 8–10 cm, and lower leaves (LL) measured 13–15 cm (Fig. 1A and 1B), whereas terminal flowers were harvested from 130-day-old plants (Fig. 1C). These samples were immediately frozen in liquid nitrogen and stored at –80°C until total RNA isolation and cannabinoid extraction.
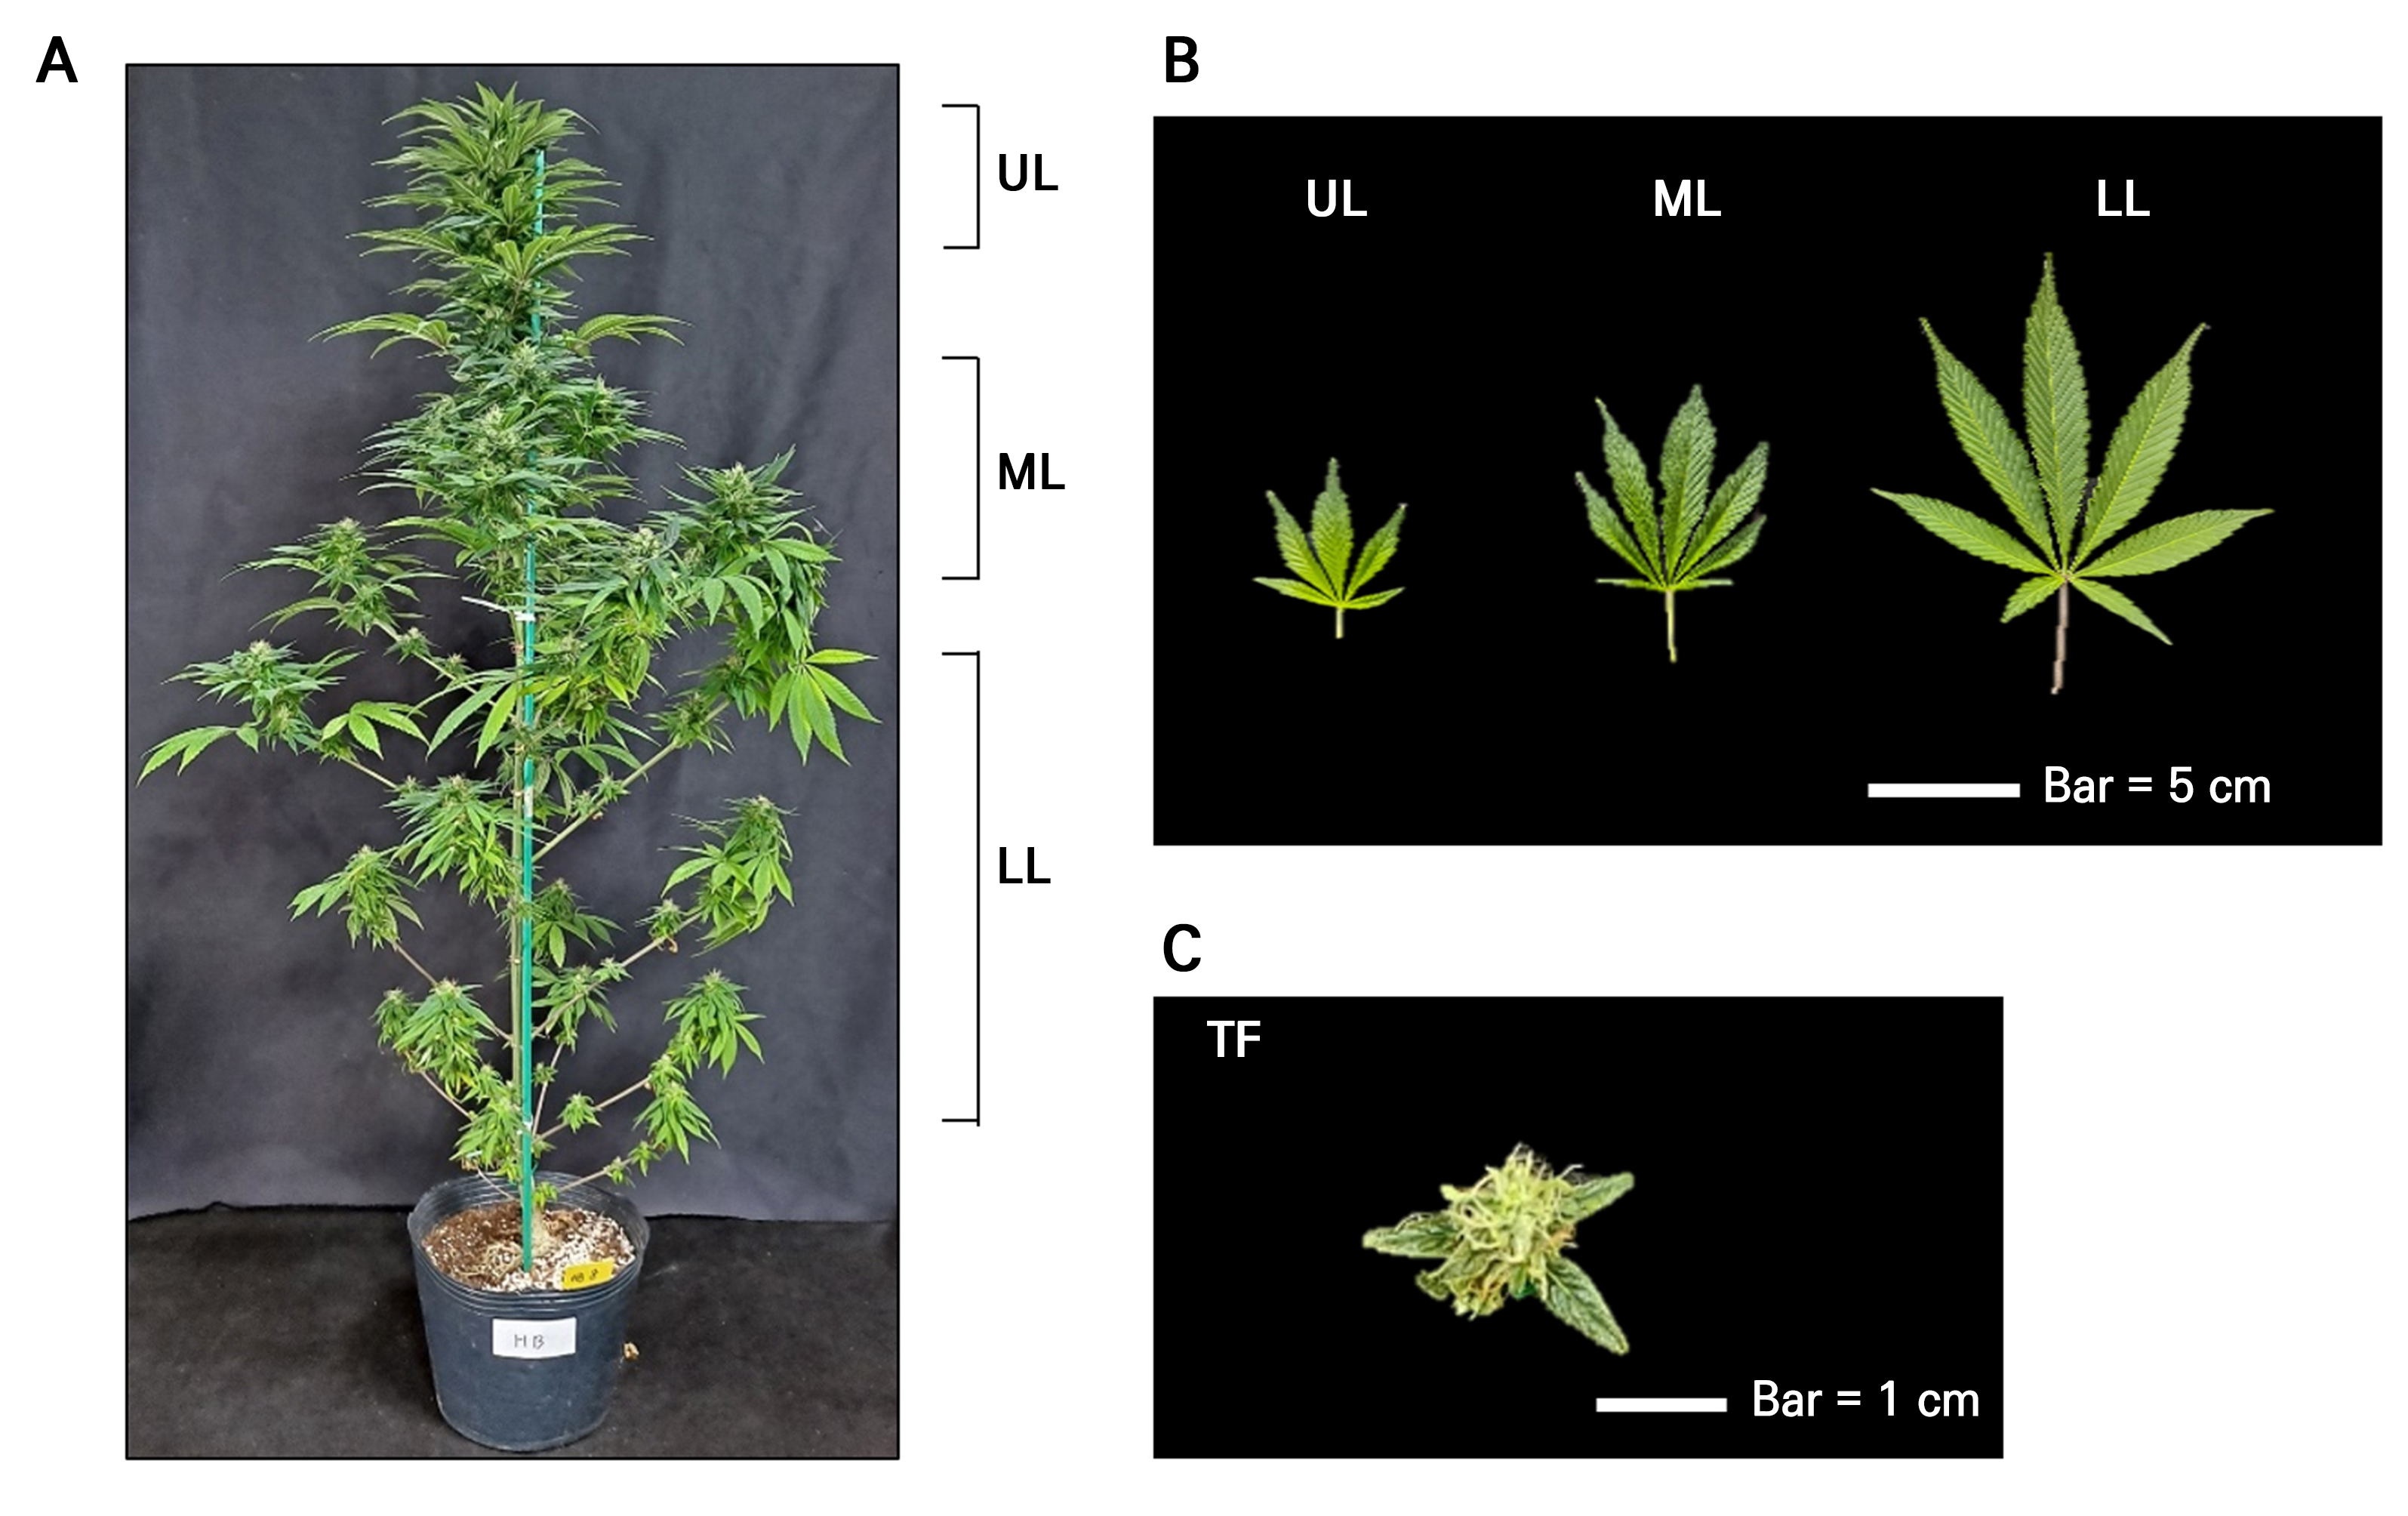
Fig. 1.
Cannabis plant architecture and different vegetative parts of hemp: A, Plant architecture of 75 day-old plants. B, experimentally collected leaves of 75-day-old plants. UL, upper leaf; ML, middle leaf; LL, lower leaf. Bar = 5 cm. C, Experimentally collected terminal flowers of 130-day-old plants. TF, terminal flower. Bar = 1 cm.
Thermal stress treatments
To assess the effects of thermal stress, we used leaf discs with a diameter of 1 cm obtained from 75-day-old plants of the three cultivars. The leaf discs were subjected to two different stress conditions: cold stress (4°C in the absence of light) and heat stress (45°C in the absence of light). Samples were collected at various time intervals (0, 6, 12, 24, and 48 h) following the treatments. At each time point, a single sample comprising 30 leaf discs was collected. Subsequently, the samples were rapidly frozen in liquid nitrogen and stored at –80°C until further analyses.
Extraction and quantitative high-performance liquid chromatography of cannabinoids
The plant samples were subjected to high-performance liquid chromatography (HPLC) to determine the cannabinoid content using an Agilent 1260 HPLC system (Agilent, Santa Clara, CA, USA). The chemical analysis conducted here followed the procedure outlined by Hädener et al. (2019). Initially, the plant materials were freeze-dried and ground into a fine powder. The powdered samples were extracted through sonication for 20 min using a methanol/hexane mixture at a ratio of 9:1 (v/v). To prepare the extracts for HPLC, they were diluted 20-fold using the extraction solvent. Chromatographic separation was achieved using an Agilent Poroshell 120 EC-C18 column (4.6 × 50 mm, 2.7 µm) and gradient elution. The mobile phases consisted of 0.1% formic acid in water (mobile phase A) and 0.1% formic acid in acetonitrile (mobile phase B). The HPLC system was operated at a flow rate of 1 mL/min. The gradient elution conditions were as follows: from 0 to 5 min, 55% mobile phase B; from 5 to 25 min, 85% mobile phase B; from 25 to 30 min, maintained at 85% mobile phase B; from 30 to 30.1 min, 55% mobile phase B; and from 30.1 to 35 min, maintained at 55% mobile phase B. A 10 µL injection volume was used, and spectra were recorded from 200 to 800 nm. The detection wavelength was set to 210 nm for quantification. Cannabinoid standards for cannabidiolic acid (CAS No. CBD-1735), cannabidiol (CAS No. THC-303), cannabinol (CAS No. THC-377), and Δ9-tetrahydrocannabinolic acid (CAS No. THC-741) were obtained from Lipomed (Arleisheim, Switzerland). The retention times for each cannabinoid were determined using these standards and were used to create a six-point calibration curve. Calibration verification standards were injected at the beginning of each day to ensure accurate retention times and quantification. Quantification was performed using calibration curves ranging from 50 to 1,000 µg·mL-1. The linear equations for quantification were: y = 32.251x + 19.131 for CBDA, y = 83.907x − 24.125 for CBD, y = 59.725x − 58.522 for CBN, and y = 31.180x + 35.423 for THCA.
Identification of cannabinoid biosynthesis genes
Sequences of cannabinoid biosynthesis genes in C. sativa L. produced in previous studies were retrieved from GenBank (https://www.ncbi.nlm.nih.gov/genbank/). Additional sequences available in databanks were identified using CannabisGDB (https://gdb.supercann.net/). Full-length cDNAs encoding THCAS, CBCAS, CBDAS, GPPS, OLS, OAC, PT, AP2, and MYB1 in C. sativa L. were selected (GenBank accession numbers: CsCAN_00G0198470, CsPK_00G0121830, CsCAN_00G0257910, CsCAN_00G0073620, CsJLD_00G0306020, CsLAC_00G0215960, CsCBD_01G0018110, CsCAN_00G0000660, and CsCAN_00G0002730, respectively). Gene-specific primers were designed using Primer Quest (http://eu.idtdna.com/Scitools/Applications/Primerquest/) to produce fragments of 90–100 base pairs (Supplementary Table 1).
Total RNA isolation and quantitative RT-PCR analysis
Total RNA was extracted using the TRIzol reagent (Gibco-BRL, Carlsbad, CA, USA) according to the manufacturer’s guidelines, and 1 μg of the isolated RNA was processed for reverse-transcription using the ReverTra Ace-α kit (TOYOBO, Osaka, Japan) according to the manufacturer’s protocol. The resulting cDNA was diluted ten-fold, and 1 µL of this diluted cDNA was used in a 20 µL PCR reaction. Quantitative RT-PCR was performed using a SYBR® Green SuperMix RT-PCR kit (IQ SYBR Green Super Mix, Bio-Rad, Hercules, CA, USA) on a MiniOption detection system (Bio-Rad), and data analysis was conducted using the comparative threshold cycle (Ct) method with Bio-Rad GeneXpression Macro Chromo4 software. The EF1a gene served as an internal reference for normalization, and the statistical analysis was conducted using Duncan’s multiple range test in SAS software (version 9.2).
Results and Discussion
Cannabinoid content in different organs of C. sativa L.
Owing to the versatility of hemp, high-quality cellulose can be obtained from the stems, nutrient-rich oils and proteins from the seeds, and valuable essential oils and resins from the inflorescences and leaves which contain numerous glandular trichomes (Baldini et al. 2018). To explore the cannabinoid levels in different organs and developmental stages, we analyzed the roots, stems, terminal flowers, and leaves of three C. sativa L. cultivars: Hot Blonde, Cherry Blossom, and Queen Dream. Leaves were categorized based on their position and length, representing distinct developmental stages. Our findings reveal the presence of four compounds in hemp: THCA, CBDA, CBD, and CBN. The data indicated that the cannabinoids were primarily concentrated in the terminal flowers and leaves. Across the cultivars, CBDA was the predominant cannabinoid, with the highest accumulation observed in the terminal flowers: 54.1 mg·g-1 dry wt. in Hot Blonde, 47.2 mg·g-1 dry wt. in Cherry Blossom, and 49.3 mg·g-1 dry wt. in Queen Dream (Fig. 2 and Supplementary Table 2). Considerable amounts of CBDA were also detected in UL, ML, and LL, ranging from 22.7 to 44.0 mg·g-1 dry wt. in all three hemp cultivars (Supplementary Table 2). THCA was predominantly found at high levels within the terminal flowers, ranging from 5.5 to 6.7 mg·g-1 dry wt. Moreover, UL plants exhibited higher amounts of CBDA and THCA than older leaves (ML and LL). CBD and CBN are present in relatively small quantities in C. sativa. Among the cultivars, Cherry Blossom had the highest CBD accumulation, particularly in the terminal flowers (8.6 mg·g-1 dry wt.). The roots of the three cultivars exhibited the lowest THCA, CBDA, CBD, and CBN contents (Fig. 2 and Supplementary Table 2). Ahmed et al. (2015) reported similar findings and noted that CBDA and THCA were the most abundant phytocannabinoids in C. sativa. These compounds were also identified as having the greatest impact on the observed variations in the metabolite profiles of the trichomes. According to the HPLC results, cannabinoids were predominantly present in the terminal flowers and leaves, and CBDA was the predominant cannabinoid in the three cultivars. Conversely, the concentrations of all four cannabinoid compounds were lowest in the roots.
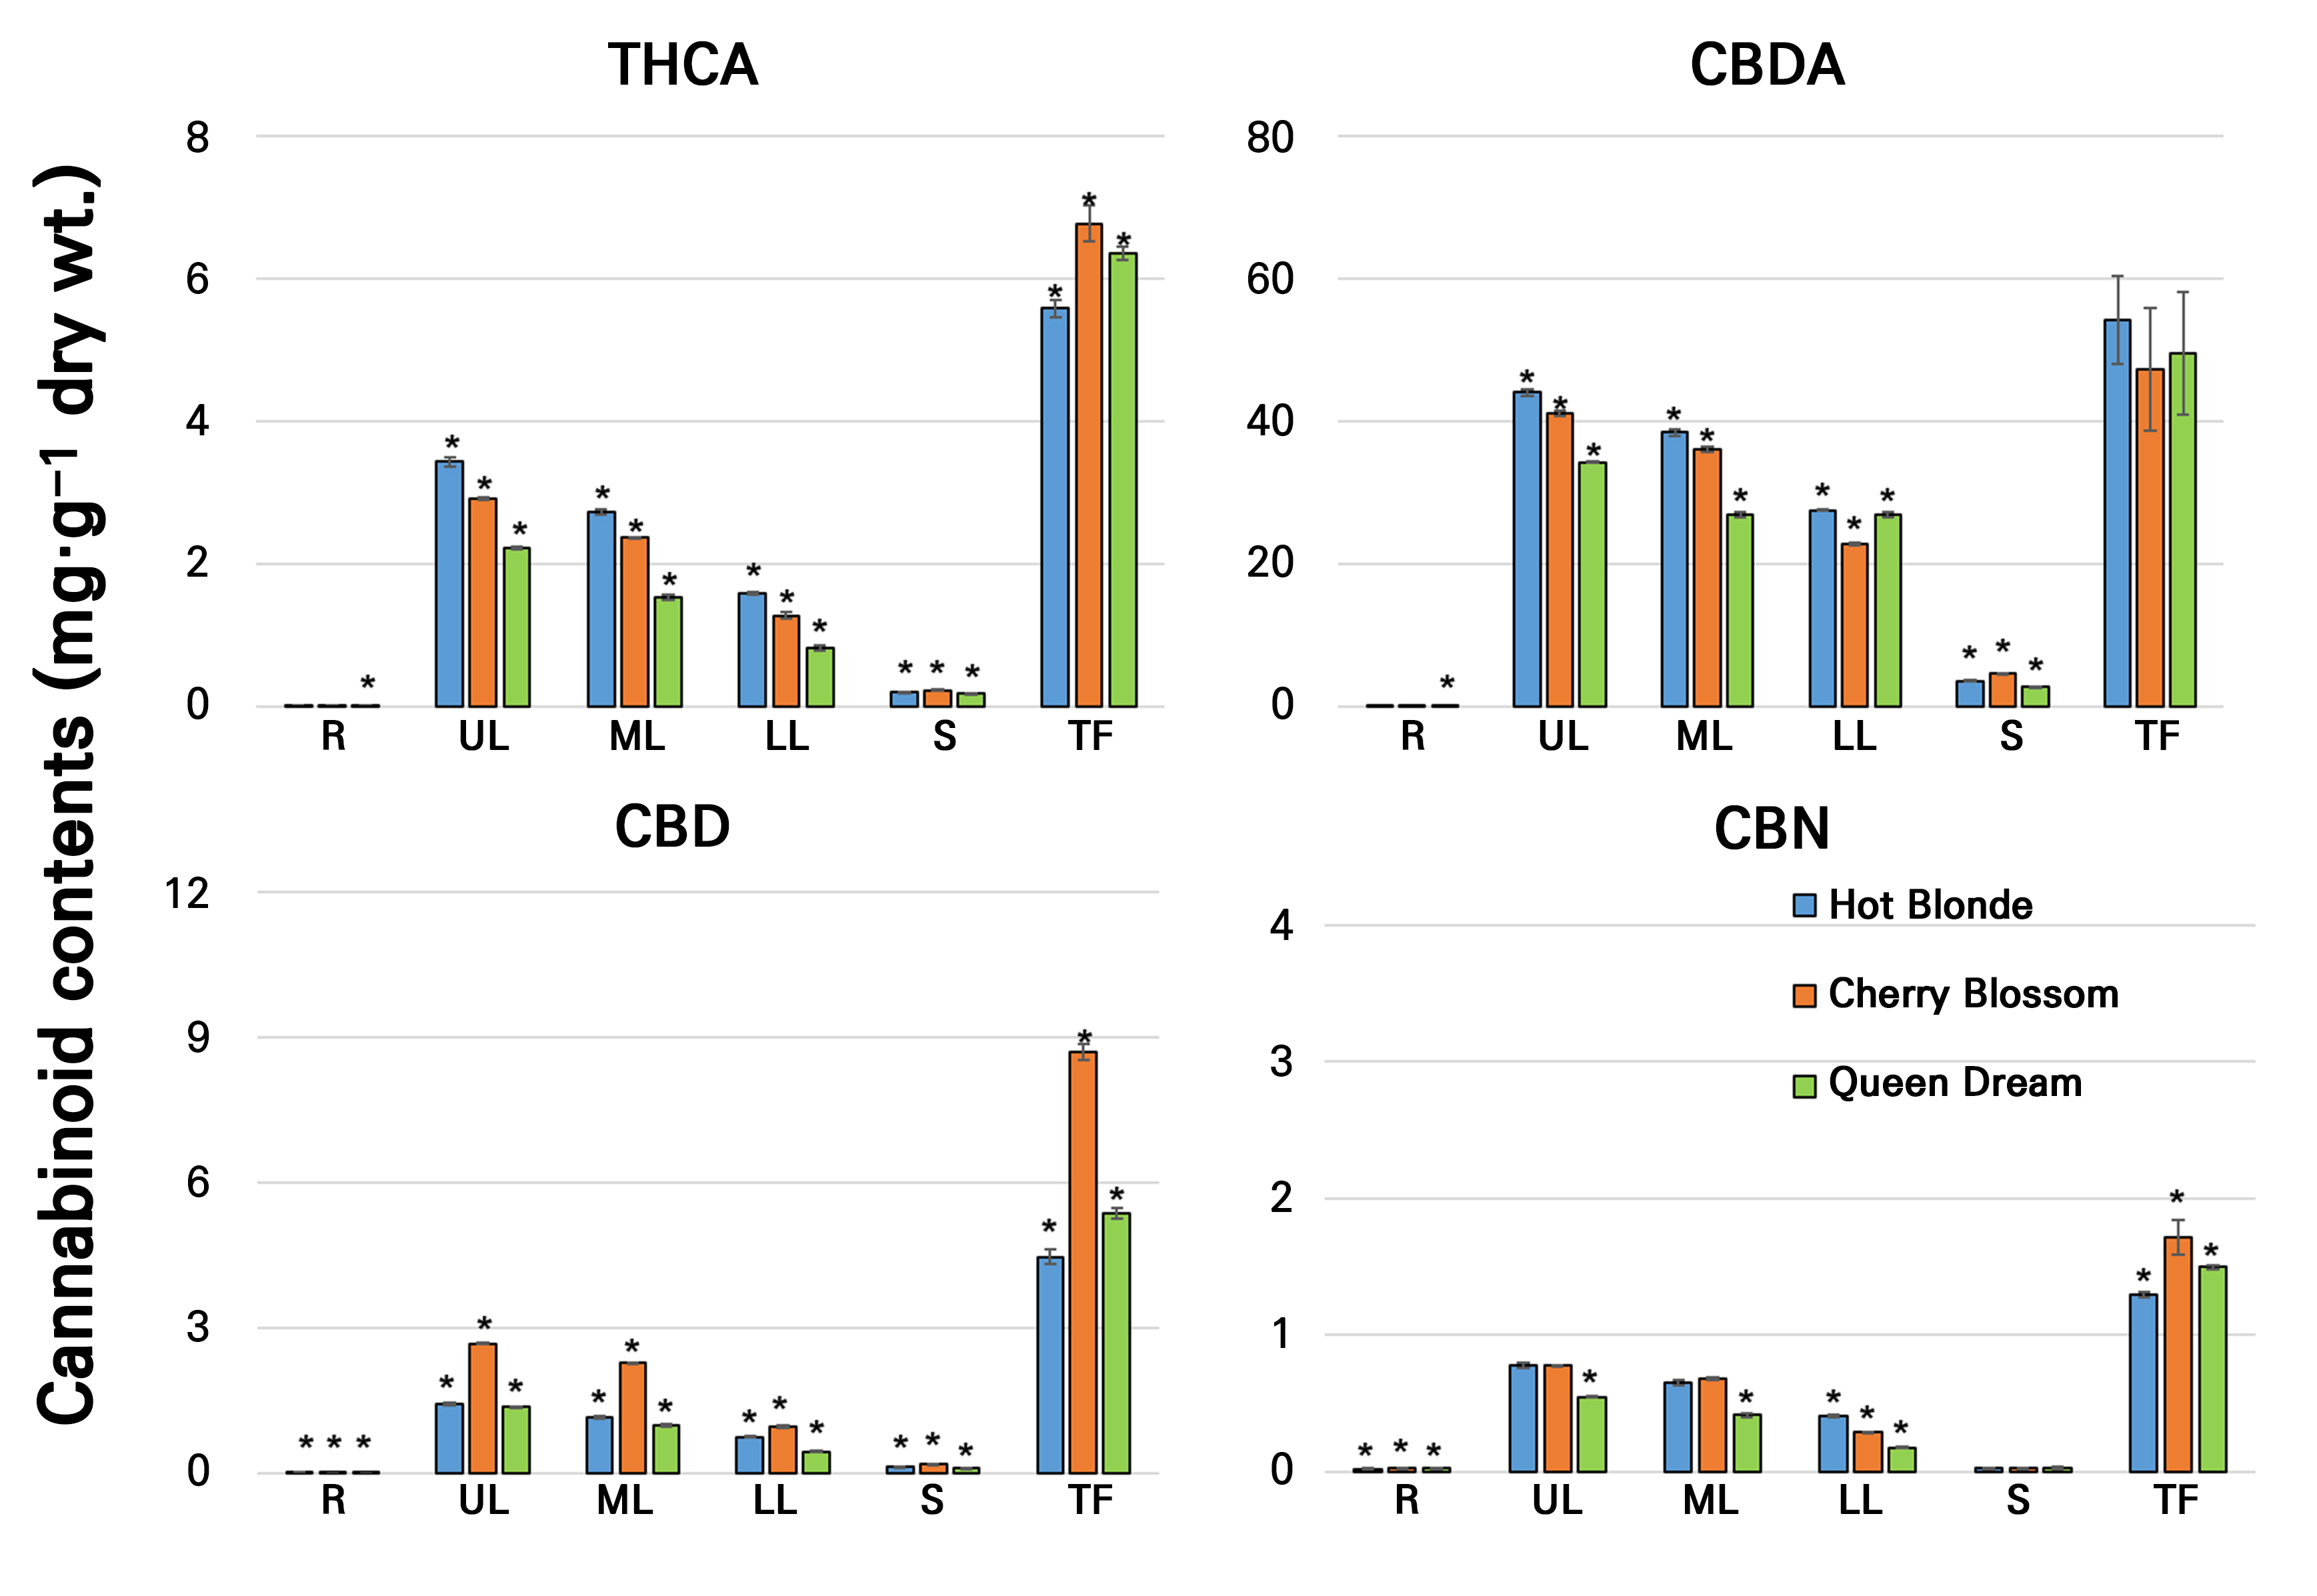
Fig. 2.
Cannabinoid contents of different organs of hemp in the cultivars Hot Blonde, Cherry Blossom, and Queen Dream. Values (mean ± standard deviation [SD]) are the average of duplicate samples analyzed individually in triplicate for the cannabinoid concentration. Bars indicate the SD of the mean and asterisks indicate significant differences. THCA, tetrahydrocannabinolic acid; CBDA, cannabidiolic acid; CBD, cannabidiol; CBN, cannabinol; R, roots; UL, upper leaves; ML, middle leaves; LL, lower leaves; S, stems; TF, terminal flowers.
Cannabinoid contents under thermal stress
The chemical composition of plant materials is significantly influenced by environmental factors such as light, temperature, relative humidity, water availability, and salinity, which impact the production of secondary metabolites in plants (Nascimento and Fett-Neto 2010). Although limited studies have explored the relationship between temperature and cannabinoid biosynthesis in hemp, the existing findings are somewhat contradictory. For example, Bazzaz et al. (1975) reported an increase in the cannabinoid content with elevated temperatures, whereas other studies have indicated a decrease under similar conditions, suggesting that the response to thermal stress is complex and modulated by multiple factors (Pate 1999). In the present study, we examined the effects of both low-temperature (4°C) and high-temperature (45°C) stress on cannabinoid contents across different hemp cultivars. Our results revealed that CBDA was the predominant cannabinoid in all cultivars under both temperature conditions, followed by THCA. Under the low-temperature treatment, CBDA levels increased in Hot Blonde and Cherry Blossom by 1.11-fold and 1.12-fold, respectively, after 12 hours, while in Queen Dream, a 1.17-fold increase was observed after six hours of exposure. Similarly, THCA levels increased in Hot Blonde and Cherry Blossom by 1.20-fold and 1.18-fold, respectively, after 12 hours, and by 1.25-fold in Queen Dream after six hours of low-temperature exposure. In contrast, CBD levels showed a consistent increase in all three cultivars, varying according to the duration of exposure: after six hours in Hot Blonde, 12 hours in Cherry Blossom, and 24 hours in Queen Dream. Notably, the CBN content in Hot Blonde and Queen Dream remained relatively stable under low-temperature conditions. However, Cherry Blossom exhibited a 2.06-fold increase in the CBN content after 12 hours, followed by a gradual decline over the next 24 and 48 hours (Fig. 3A and Supplementary Table 3). These findings suggest that low-temperature stress can enhance specific cannabinoid levels, but the response is highly dependent on the cultivar and duration of exposure, consistent with previous studies emphasizing the complex role of temperature in cannabinoid biosynthesis (Chandra et al. 2008; Tahir 2021).
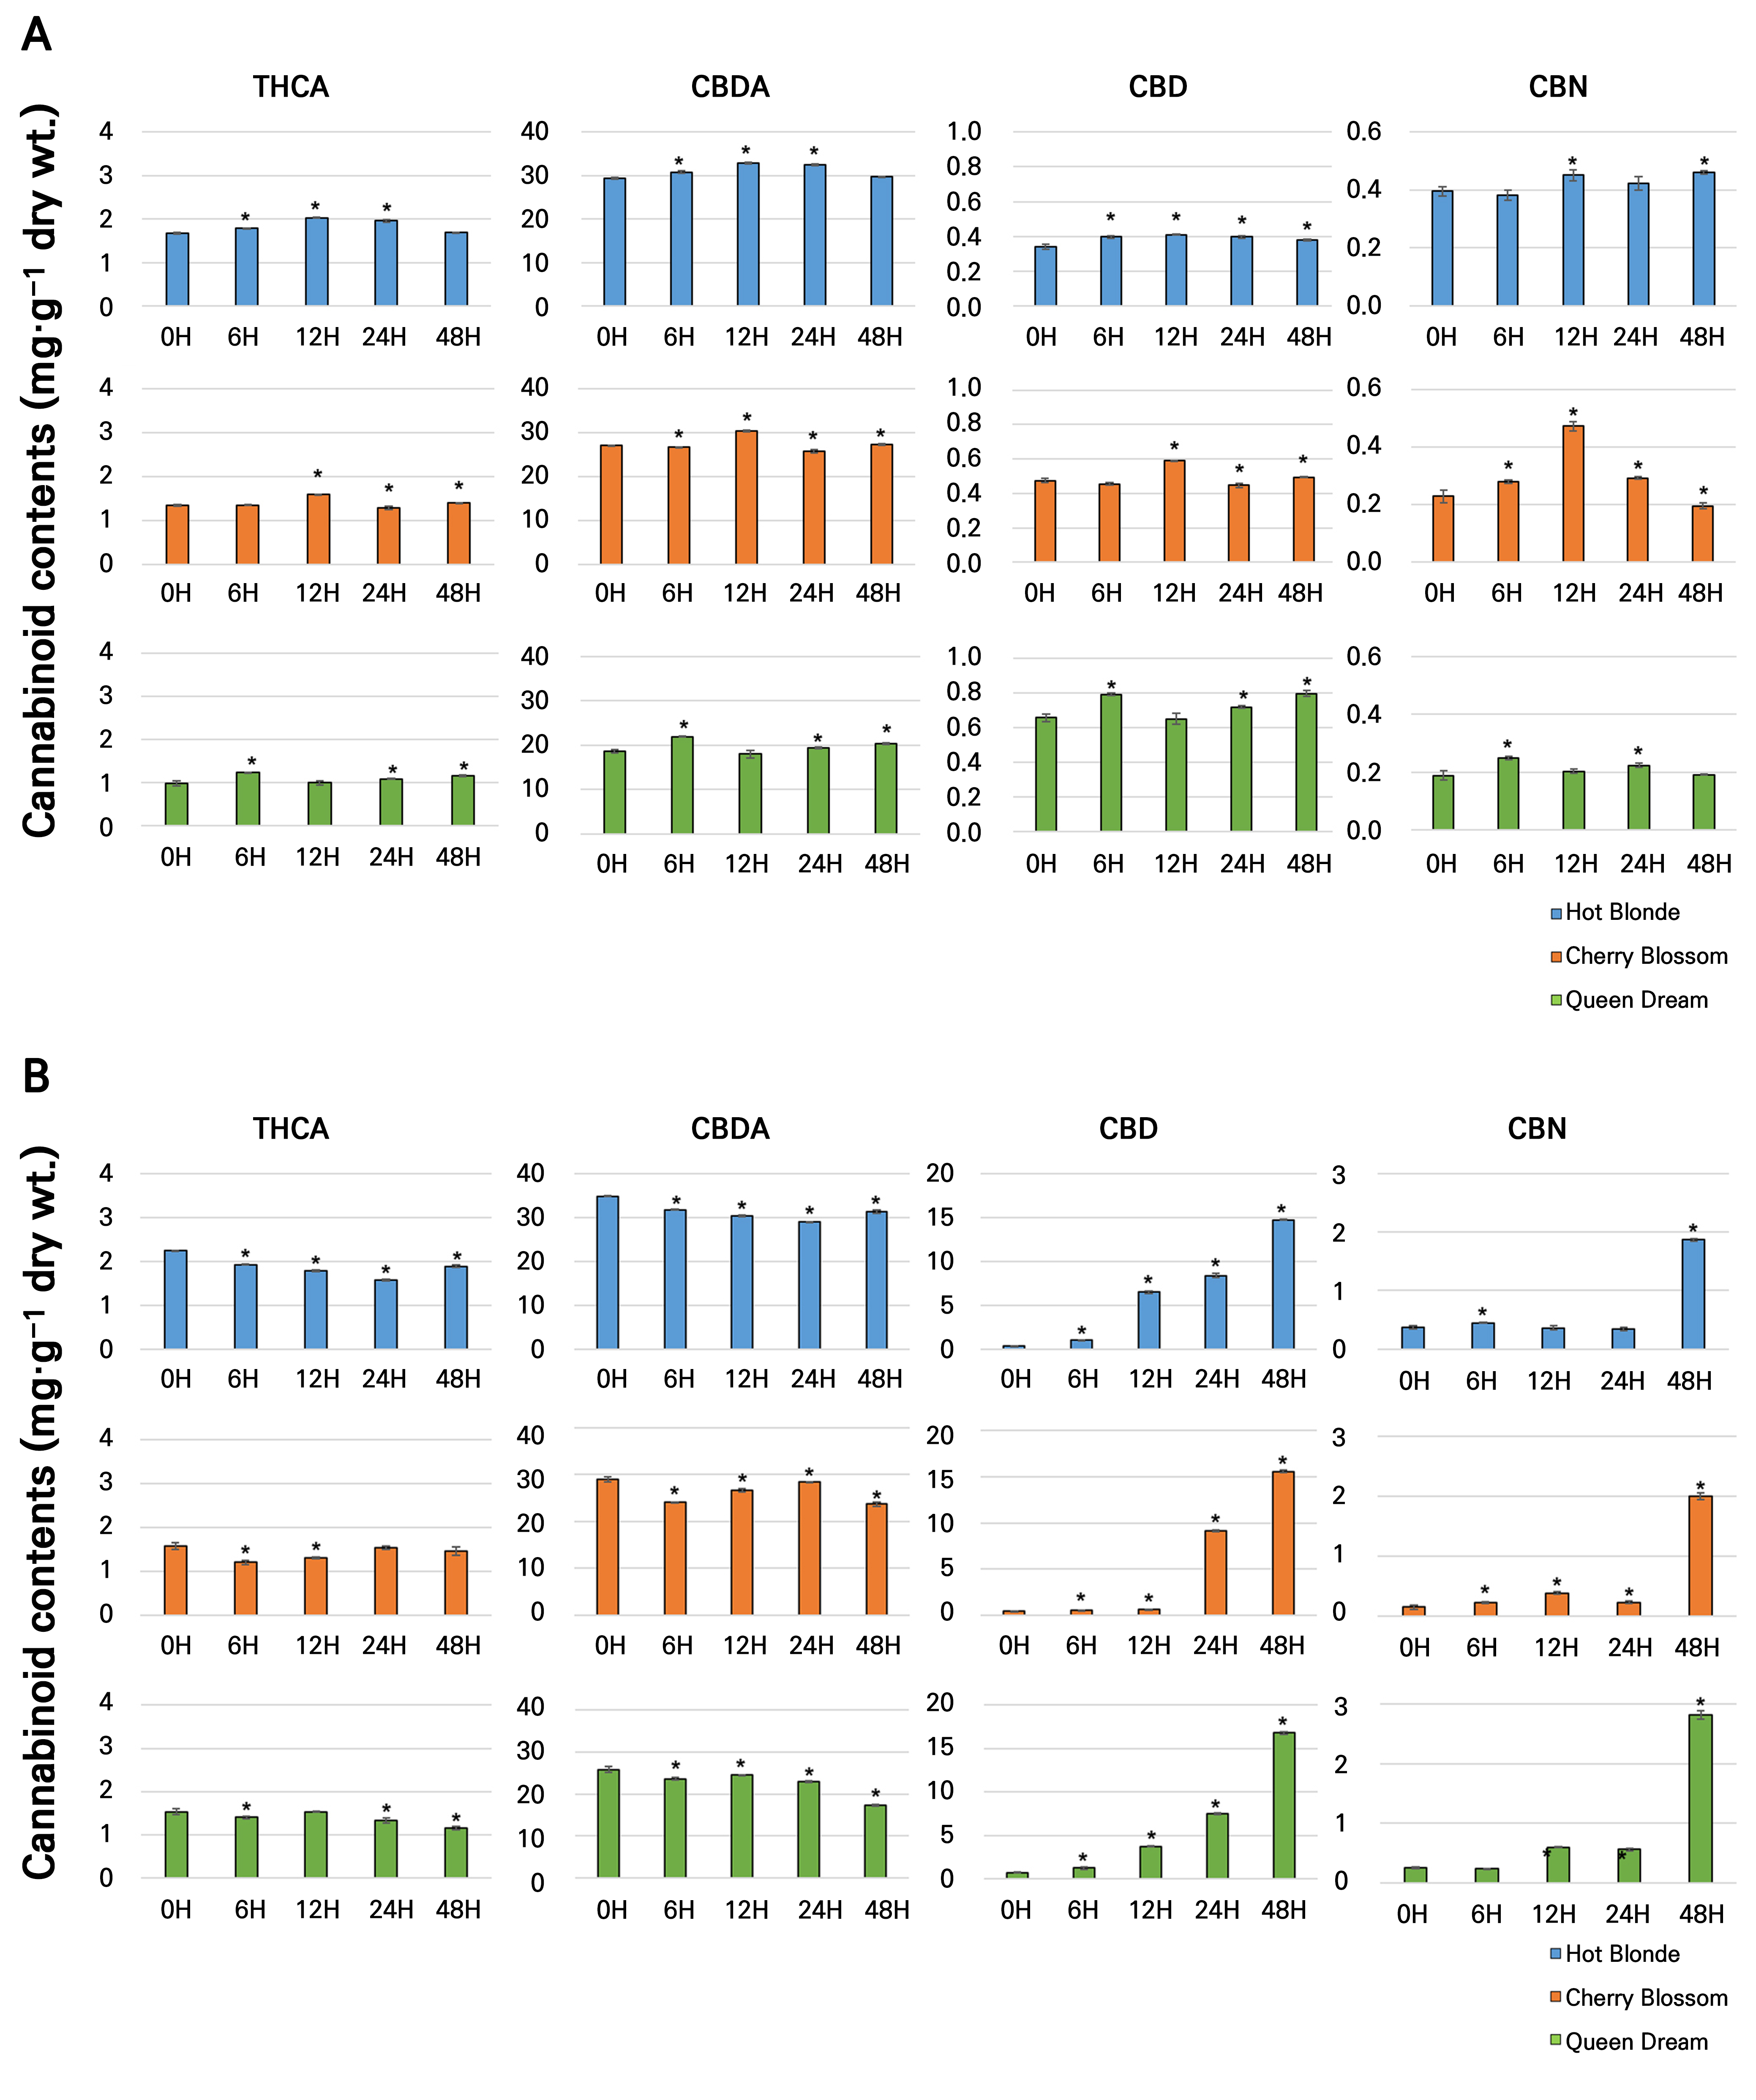
Fig. 3.
Cannabinoid amounts in 75-day-old plant leaves in the cultivars Hot Blonde, Cherry Blossom, and Queen Dream under a thermal stress treatment. Samples were collected at 0, 6, 12, 24, and 48 hours after 4°C (A) and 45°C (B) treatments. Biological triplicates, each with technical duplicates, were averaged and statistically analyzed by means of Student’s t-tests (p < 0.05). Bars indicate the standard deviation (SD) of the mean, and asterisks indicate significant differences. THCA, tetrahydrocannabinolic acid; CBDA, cannabidiolic acid; CBD, cannabidiol; CBN, cannabinol.
The results presented in Fig. 3B show that exposure to 45°C led to a slight decrease in both the THCA content and the CBDA content in the hemp cultivars Hot Blonde, Cherry Blossom, and Queen Dream. In contrast, the CBD and CBN contents exhibited a consistent increase across all three cultivars under the same conditions (Fig. 3B). Significant statistical differences were observed between the temperature treatments of 4°C and 45°C, particularly for CBD and CBN, which reached their maximum and minimum levels at different temperature ranges. Notably, after 48 h of treatment at 45°C, the CBD content increased markedly by 38.43-fold in Hot Blonde, 35.07-fold in Cherry Blossom, and 22.92-fold in Queen Dream. Similarly, CBN levels increased by 5.08-fold, 13.40-fold, and 11.05-fold in Hot Blonde, Cherry Blossom, and Queen Dream, respectively, after 48 hours at 45°C. The measured concentrations of CBN were 1.8 mg·g-1, 2.0 mg·g-1, and 2.8 mg·g-1 dry weight in Hot Blonde, Cherry Blossom, and Queen Dream, respectively (Fig. 3B and Supplementary Table 4). Our findings suggest that heat stress enhances the decarboxylation rate in C. sativa, causing the cannabinoid contents to increase, particularly with regard to CBD and CBN. The increase was more pronounced for CBD than for CBN. Cannabinoids such as THCA and CBDA are initially synthesized from CBGA as carboxylic acids. They undergo decarboxylation through heating, exposure to light, or natural aging of hemp plants, converting them into their neutral forms THC and CBD, which involves oxidative processes (Citti et al. 2018). Before decarboxylation, CBDA and THCA were the predominant cannabinoids. Decarboxylation is a temperature-induced process, and under heat stress, the CBD and CBN contents increase in C. sativa. The rates of decarboxylation of THCA and CBDA increased with longer durations of the high-temperature treatment. CBD, the primary cannabinoid in industrial hemp, is highly valued for its diverse pharmacological properties, including its antioxidant, anti-inflammatory, neuroprotective, anxiolytic, antiepileptic, antifungal, and antibacterial activities (Taura et al. 1996; Brighenti et al. 2017). According to our results, heat stress treatments can enhance the high-value CBD content. These findings highlight the complex interactions between environmental conditions and cannabinoid biosynthesis, suggesting that temperature manipulation could be a viable strategy for optimizing the production of specific cannabinoids in industrial hemp.
Expression levels of cannabinoid biosynthetic genes in C. sativa L.
C. sativa L. harbors a multitude of primary and secondary metabolites. It is noteworthy that the compositions and levels of these metabolites differ between tissues and developmental stages and are affected by environmental conditions and according to when they are harvested (Flores-Sanchez and Verpoorte 2008). The regulatory mechanisms underlying cannabinoid biosynthesis during the maturation of female flowers and decarboxylation under high-temperature conditions have received limited research attention thus far. To investigate the expression of genes involved in cannabinoid biosynthesis during different developmental stages and under thermal stress in hemp, we conducted a gene expression analysis using quantitative RT-PCR. We assessed the expression levels of cannabinoid biosynthesis genes in various plant parts, including the roots, UL, ML, LL, stems, and terminal flowers of the hemp cultivars Hot Blonde, Cherry Blossom, and Queen Dream (Fig. 4). Based on the gene expression profiles, most genes exhibited higher expression levels in the terminal flowers, whereas lower expression levels were found in the roots or stems. Specifically, MYB, AP2, OLS, OAC, PT, THCAS, CBCAS, and CBDAS were most highly expressed in the terminal flowers. Consistent with these gene expression patterns, HPLC revealed a similar trend in its cannabinoid content, with elevated levels of THCA, CBDA, CBD, and CBN detected primarily in the terminal flowers (Fig. 2). In work by Livingston et al. (2020), glandular trichomes, which are abundant in the later stages of flower development, were found to serve as the primary site for cannabinoid accumulation. Based on our analysis, we observed an upregulated expression of biosynthetic genes in the terminal flowers. This finding supports the hypothesis that glandular trichomes act as the primary reservoir for cannabinoid accumulation.
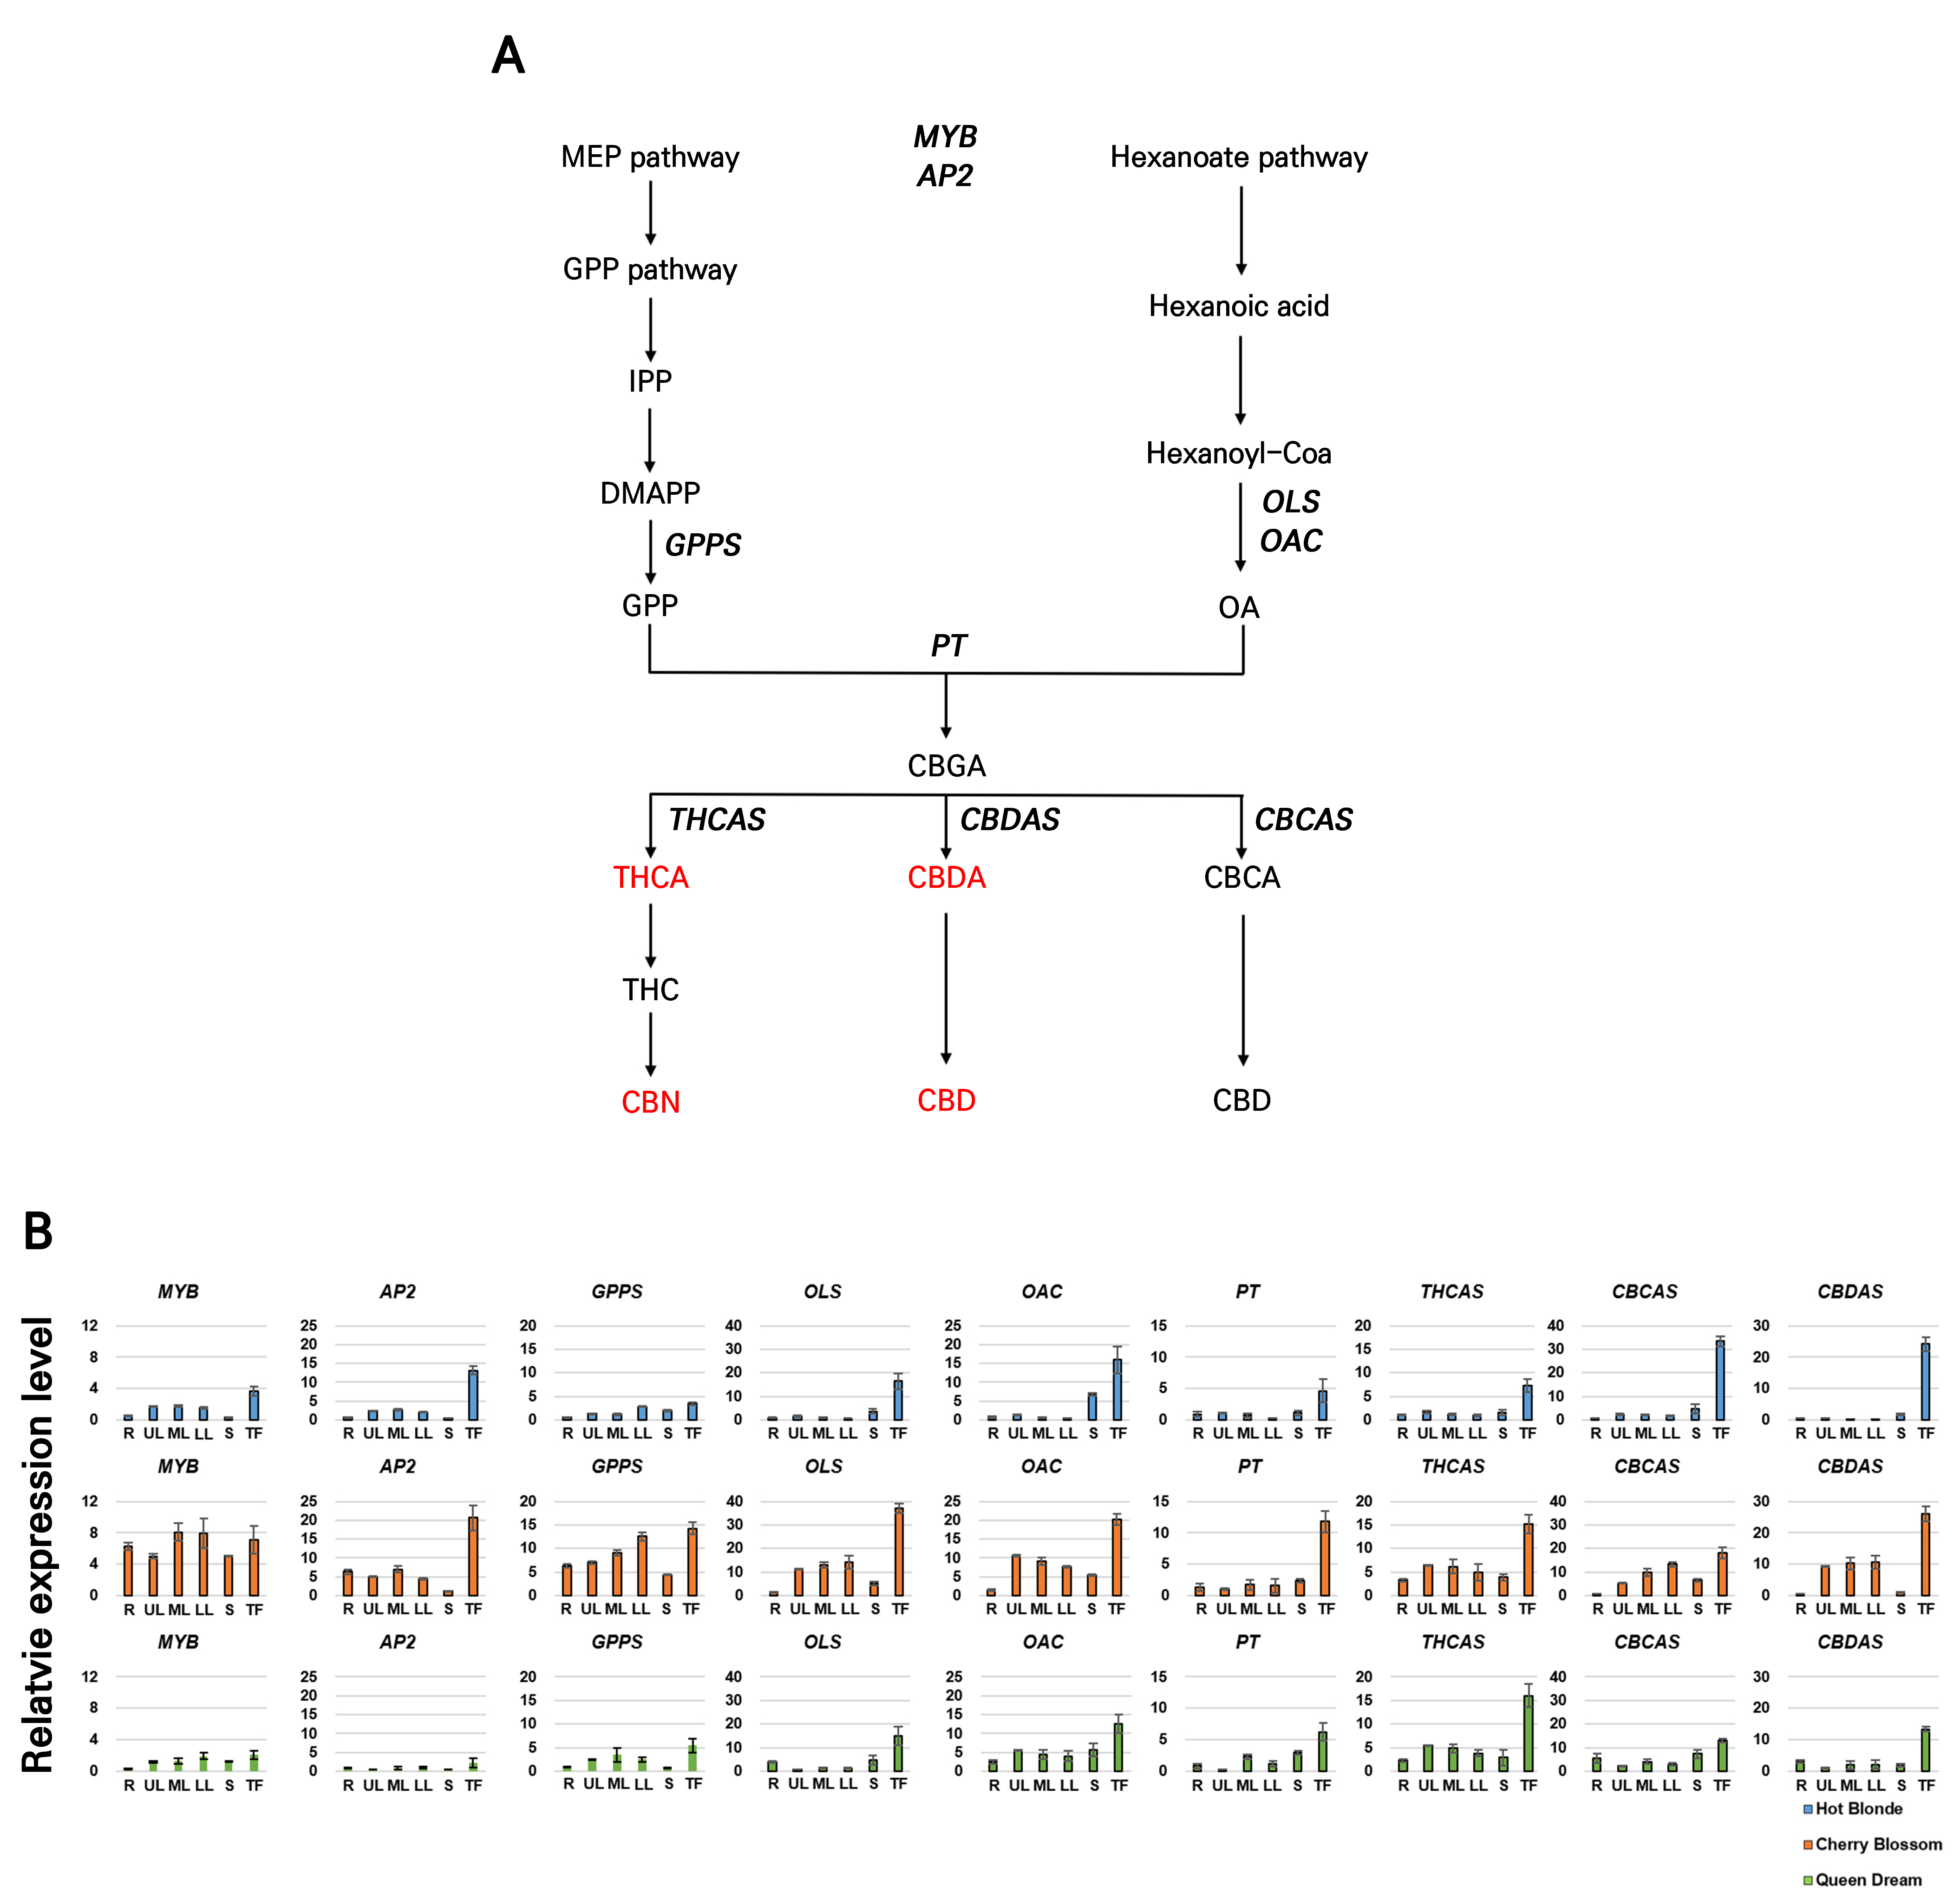
Fig. 4.
Expression of cannabinoid biosynthesis genes: A, A schematic presentation of the general cannabinoid biosynthetic pathway. Multiple arrows indicate two or more steps in the pathway, and the cannabinoids analyzed in this study are highlighted in red. Expressions of the genes analyzed in this study are presented in bold font. THCAS (tetrahydrocannabinolic acid synthase); CBCAS (cannabichromenic acid synthase); CBDAS (cannabidiolic acid synthase); GPPS (geranyl pyrophosphate synthase); OLS (olivetol synthase); OAC (olivetolic acid cyclase); PT (prenyltransferase); AP2 (APETALA2-related transcription factor); MYB1 (transcription factor MYB1). B, Quantitative real-time PCR analysis of the cannabinoid biosynthesis genes in different organs of the cultivars Hot Blonde, Cherry Blossom, and Queen Dream. EF1α was used as the internal control. The values and error bars represent the average and standard error from three independent reactions. R, roots; UL, upper leaves; ML, middle leaves; LL, lower leaves; S, stems; TF, terminal flowers.
Under cold stress, the cultivar Hot Blonde exhibited the highest expression levels of OLS, OAC, PT, THCAS, CBCAS, and CBDAS at 12 h. In contrast, Cherry Blossom showed a significant increase in gene expression at 48 h, although decreases in AP2, GPP synthase, and OLS expression were observed at 24 h owing to cold stress. Notably, PT expression in Cherry Blossom increased significantly at 12 h. In Queen Dream, cold stress led to significant increases in the expression levels of OLS, OAC, PT, CBCAS, and CBDAS at 6 h, followed by a gradual decrease in all levels (Fig. 5A). After the heat stress treatment, MYB and AP2 expression levels decreased slightly in Cherry Blossom; however, THCAS, CBCAS, and CBDAS expression levels increased steadily over 48 h in the Hot Blonde, Cherry Blossom, and Queen Dream cultivars (Fig. 5B). Interestingly, the expression pattern of CBDAS closely mirrored that of PT, suggesting the importance of upregulating CBDAS to enhance CBD production. A significant negative correlation was observed between THCAS expression and THCA levels, indicating that higher THCAS transcript levels did not promote THCA synthesis. This negative association between THCAS gene expression and THCA production aligns with the results of previous studies, which suggested that THCAS is downregulated during flower development despite an increase in THC levels at later stages (Richins et al. 2018; Liu et al. 2021). In contrast to previous findings, Muntendam et al. (2012) reported a minimal correlation between synthase enzymes and their corresponding products. Our findings in conjunction with earlier studies indicate that synthase gene expression levels may not significantly influence cannabinoid production in C. sativa. Notably, our results showed significant increases in PT, GPPS, and OAC expression levels during high-temperature-treatment-induced decarboxylation. PT expression exhibited a slight positive correlation with the THCA content, whereas GPPS expression was notably associated with THCA production in hemp. OAC plays a vital role in the cannabinoid biosynthetic pathway, and we observed a positive correlation between OAC expression levels and cannabinoid production across the three cultivars (Figs. 4 and 5). Our study provides evidence that the high expression levels of THCAS and CBDAS during heat stress significantly affect CBD and CBN accumulation. Manipulating the expression of THCAS and CBDAS may enhance the production of desired cannabinoids or alter the CBD-to-THC ratio. These findings underscore the complex interplay between environmental stressors and gene expression during cannabinoid biosynthesis and highlight opportunities to optimize cannabinoid production through genetic and environmental factors.
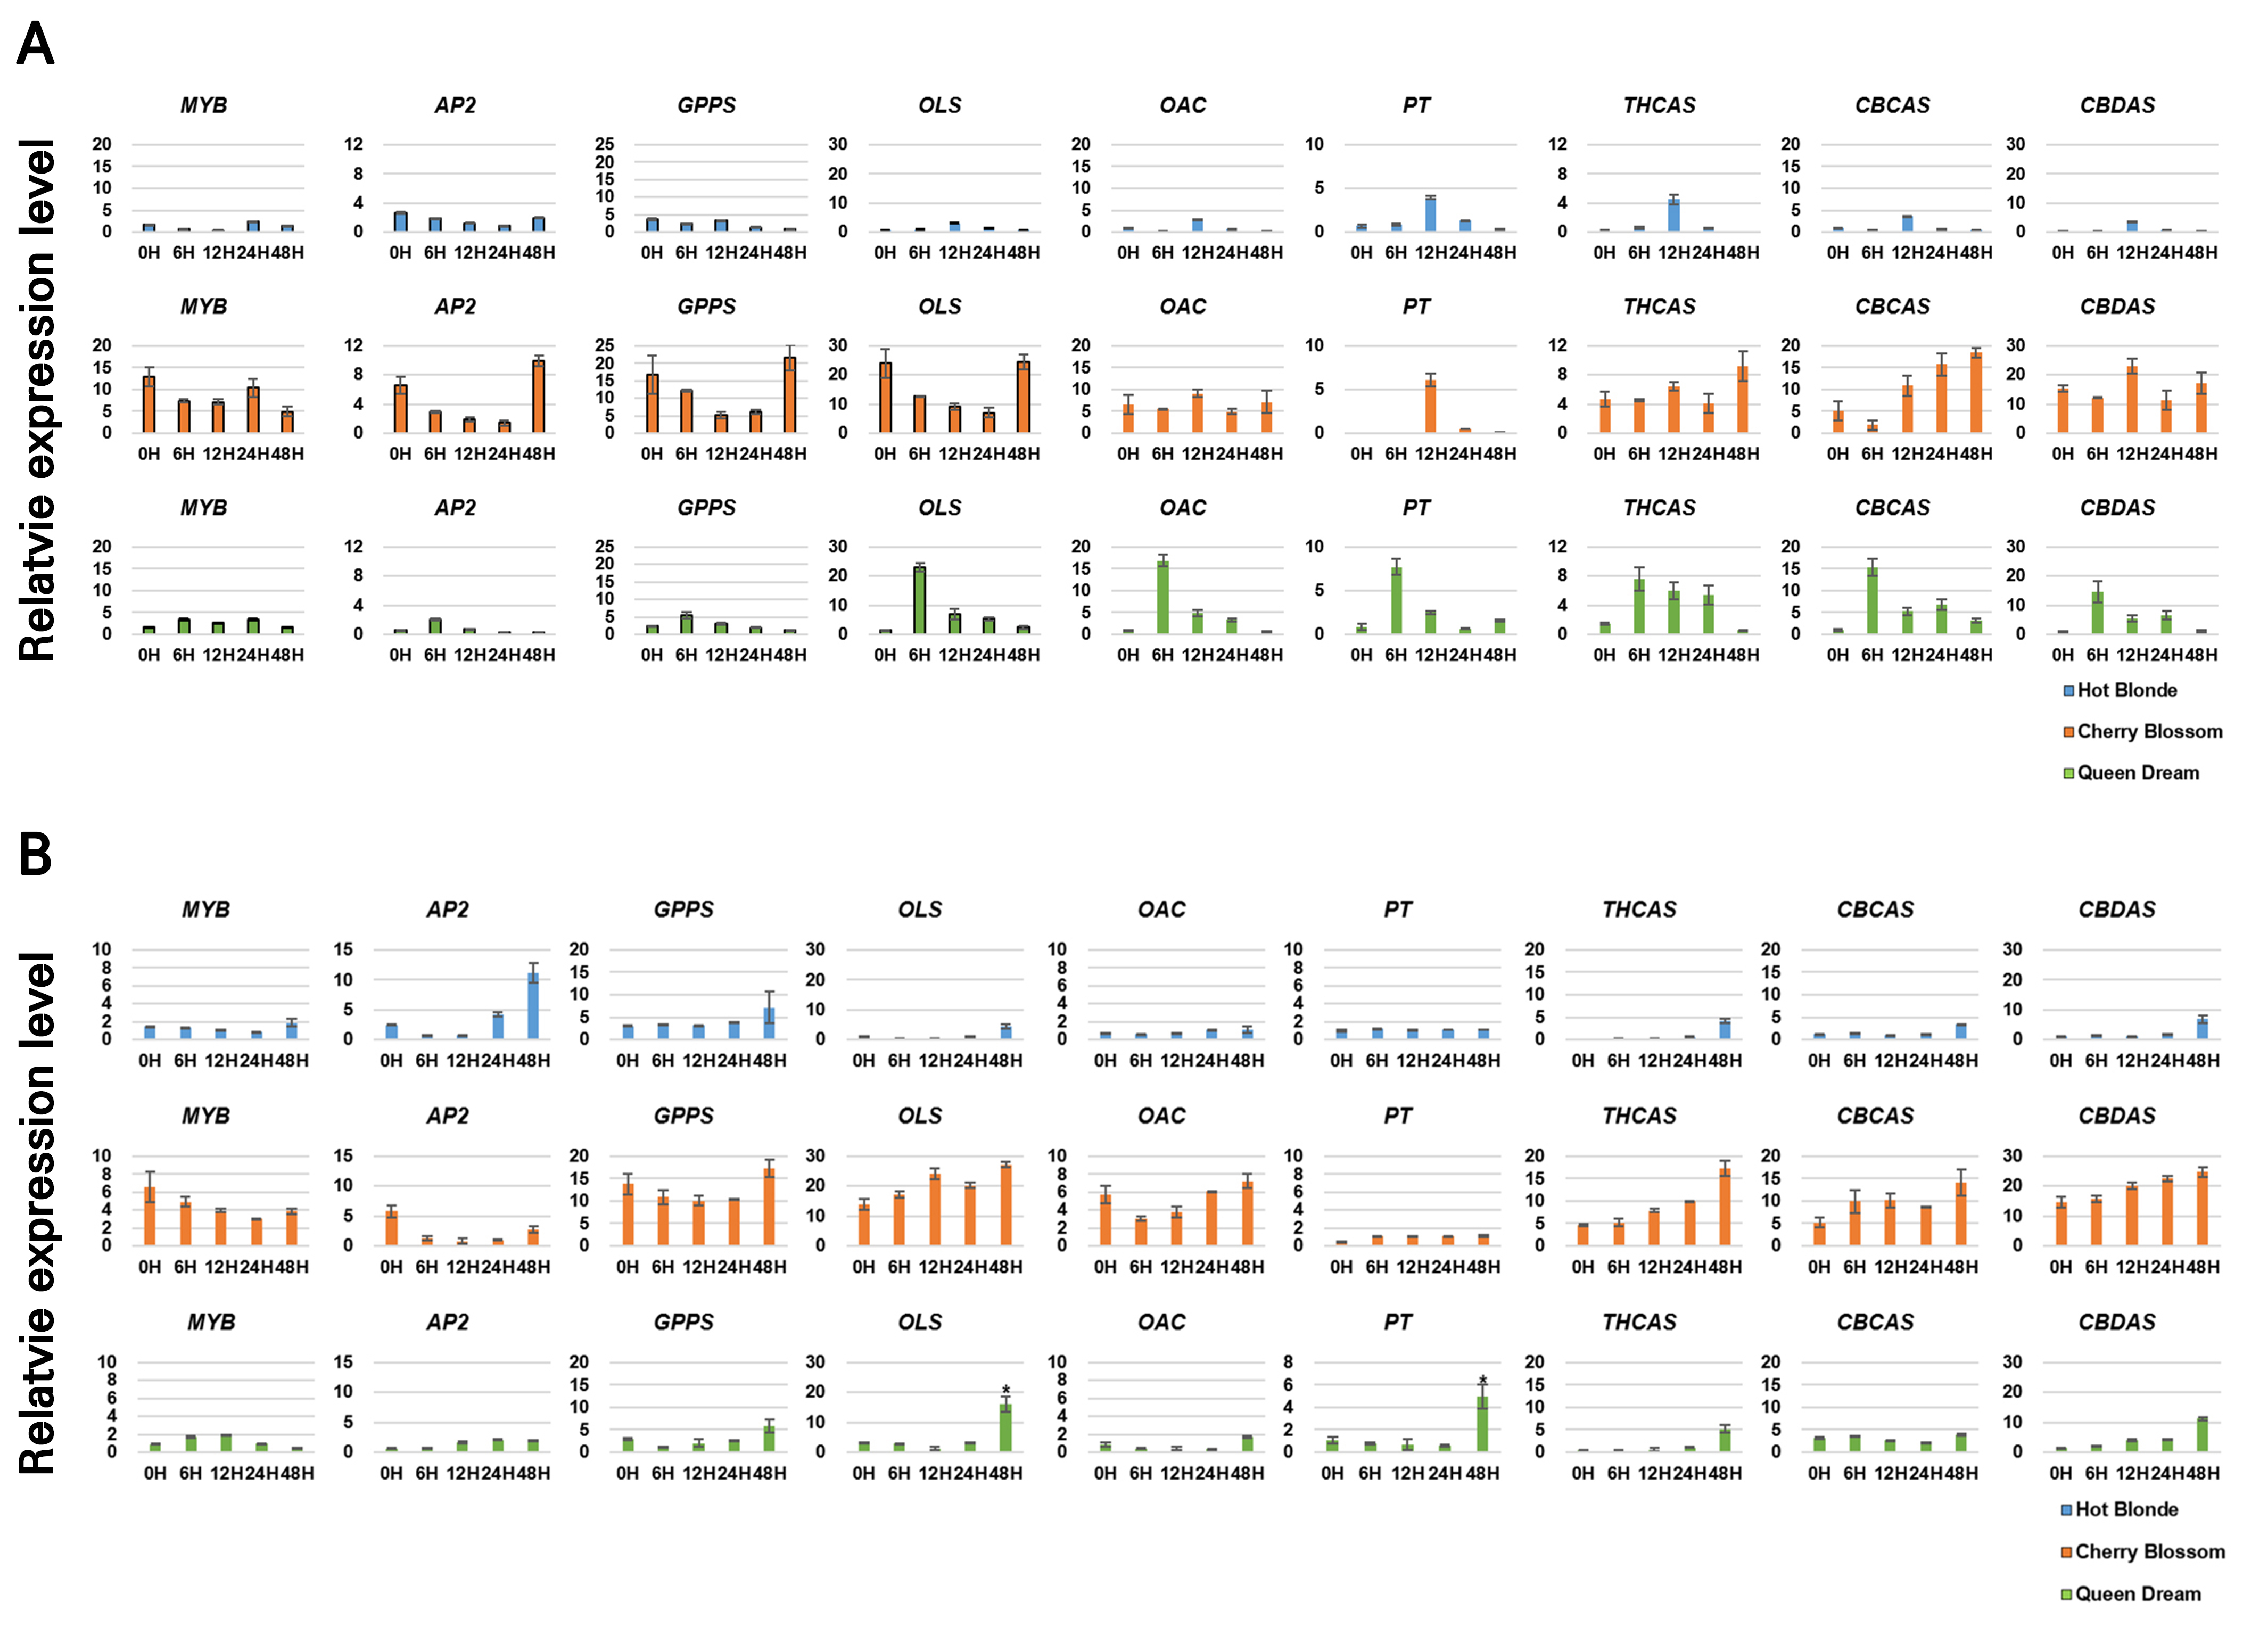
Fig. 5.
Quantitative reverse-transcription PCR analysis of cannabinoid biosynthesis genes in three hemp cultivars under abiotic stress conditions: A, Cannabinoid biosynthesis gene expression under cold stress. Total RNAs were isolated from 30 leaf discs (1 cm in diameter) exposed to 4°C for 0 to 48 hours. B, Cannabinoid biosynthesis gene expression under heat stress conditions. Total RNAs were isolated from 30 leaf discs (1 cm in diameter) and exposed for 48 hours to 45°C. EF1α was used as the internal control; bars represent the standard error from three independent measurements. The relative expression level was statistically analyzed using Student’s t-test (p < 0.05).
Conclusion
In contemporary botanical research, the significance of environmental stressors, with particular emphasis on thermal stress, has attracted significant attention. Plant species exhibit heightened sensitivity to alterations in their environmental milieu, and such perturbations profoundly influence their growth dynamics, ontogeny, and metabolic processes. Among these environmental factors, temperature is pivotal for modulating plant metabolic pathways and physiological functions. In the present study, we performed a comprehensive analysis to determine the effects of thermal stress on the primary cannabinoid constituents of C. sativa. Our findings revealed notable fluctuations in cannabinoid concentrations, which correlated with thermal variations. These modulations have implications with regard to the adaptive and survival mechanisms employed by plants. It is important to note that thermal stress is not the sole determinant influencing plant physiology. Many environmental adversities, including desiccation, salinity, and mechanical injury, accentuate plant stress responses. These responses are essential in shaping the evolutionary survival and adaptive strategies of plants. In light of these findings, we advocate for the expansion of research endeavors, not limited to thermal stress but encompassing diverse environmental conditions, to gain a deeper understanding of the unique responses of C. sativa.
Supplementary Material
Supplementary materials are available at Horticultural Science and Technology website (https://www.hst-j.org).
- HORT_20250024_Table_S1.pdf
Supplementary Table 1. Primers used for the quantitative reverse-transcription PCR analysis
- HORT_20250024_Table_S2.pdf
Supplementary Table 2. Cannabinoid compositions and contents in different parts of hemp (mg·g-1 dry weight) . The results are expressed as the means ± standard error from three independent measurements. R: roots; UL: upper leaves; ML: middle leaves; LL: lower leaves; S: stems; TF: terminal flowers; THCA, tetrahydrocannabinolic acid; CBDA, cannabidiolic acid; CBD, cannabidiol; CBN, cannabinol
- HORT_20250024_Table_S3.pdf
Supplementary Table 3. Cannabinoid compositions and contents (mg·g-1) of 75-day-old plant leaves in the cultivars Hot Blonde, Cherry Blossom, and Queen Dream under cold stress. Samples were collected at 0, 6, 12, 24, and 48 hours after the 4°C treatment. The results are expressed as the means ± standard error from three independent measurements. THCA, tetrahydrocannabinolic acid; CBDA, cannabidiolic acid; CBD, cannabidiol; CBN, cannabinol
- HORT_20250024_Table_S4.pdf
Supplementary Table 4. Cannabinoid compositions and contents (mg·g-1) of 75-day-old plant leaves in the cultivars Hot Blonde, Cherry Blossom, and Queen Dream under the heat stress treatment. Samples were collected at 0, 6, 12, 24, and 48 hours after the 45°C treatment. The results are expressed as the means ± standard error from three independent measurements. THCA, tetrahydrocannabinolic acid; CBDA, cannabidiolic acid; CBD, cannabidiol; CBN, cannabinol
