

Introduction
Materials and Methods
Plant Growth and Environmental Conditions in the Plant Factory
Polyphenol Extraction and Analysis
Radical Scavenging Activity (DPPH assay)
Extraction and Analysis of Essential Oil Content in Sweet Basil
Statistical Analysis
Results and Discussion
Growth Characteristics of O. basilicum L. by LED Condition
Polyphenolic Compound Level and Antioxidant Activity in Sweet Basil Leaves
Essential Oil Levels and Composition in Sweet Basil Leaves
Introduction
Sweet basil (Ocimum basilicum L.) is one of the most common functional herbs (Hakkim et al., 2007; Makri and Kintzois, 2008). Herbs and medicinal plants are typically cultivated in open fields, resulting in yearly variance in the biomass production as well as in the content of secondary metabolites, which are affected by factors such as soil fertility, weather, cultivation practices, diseases, and pests (Orcutt and Nilsen, 2000).
Sweet basil contains a secondary metabolite called rosmarinic acid (RA). RA is a caffeic acid (CA) ester with crucial biological properties, including antioxidant, anti-viral, and anti-inflammatory effects and the ability to reduce pollen and other allergens. RA also protects plants via insect repellent and antibacterial activities (Bais et al., 2002; Petersen and Simmonds, 2003; Sanbongi et al., 2004). Both CA and RA are synthesized through the phenylpropanoid pathway, a fairly well established series of enzymatic reactions. RA is an ester of CA and 3,4-dihydroxy phenylalanine, which originates from L-phenylalanine and L-tyrosine (Petersen et al., 1993; Petersen and Simmonds, 2003). In cell cultures of Coleus blumei, RA content correlates with phenylalanine ammonium lyase (PAL) activity (Razzaque, 1977). Recently, irradiation of blue and UV-B light was reported to stimulate the phenylpropanoid pathway via PAL in lettuce (Ebisawa et al., 2008) and to increase the production of phenolics in basil (Nitz and Schnitzler, 2004).
Sweet basil is one of the main aromatic plants. In previous studies, it was found that the growth of sweet basil and the essential oil content of its leaves were affected by temperature, light intensity, and irrigation levels (Amaki et al., 2011). The essential oil composition changes through a constant spontaneous transformation during the harvest and post-harvest process (Carvalho et al., 2006). Based on more than 200 kinds of essential oils extracted from basil, Lawrence et al. (1988) established four essential oil chemical types (methyl cavicol, linalool, methyl eugenol, and methyl-cinnamate) and numerous subtypes.
In particular, linalool is a terpenoid compound that shows antioxidant and antimicrobial activity (Simon et al., 1990), and methyl-cinnamate has a strong aroma that contributes to the fragrance of essential oils (Viña and Murillo, 2003). It is known that light quality affects secondary metabolites, such as polyphenols and essential oils. However, previous studies have not reported on the ways that light quality affects the contents of aromatic compounds and the growth of sweet basil (Amaki et al., 2011). Variations in the light spectrum can be used to promote the biosynthesis of target substances such as essential oils and polyphenols in plants grown under artificial lighting sources (Ivanitskikh and Tarakanov, 2014). We studied changes in polyphenol content and sweet basil by altering the light spectrum in an industrial plant factory.
Plant factories are currently of interest for use as next-generation agricultural production systems. A completely controlled plant factory can be sustained as an eco-friendly agricultural production system that is managed using various artificial light sources. In many plant factories, fluorescent lights and light-emitting diodes (LEDs) provide the necessary lighting for plants and improve light energy utilization (Kozai, 2007). LEDs were used by adjusting the ratio of white, red, and blue according to each plant, also UV lamp was used for various purpose. In previous experiments, it was suggested that red LED promotes growth (Bae et al., 2019) but blue LED aids in the accumulation of pytochemical concentration (Kim et al., 2018). In addition, UV lamps affect plants under stressful environmental conditions (Jeon et al., 2018).
Therefore, there is increased interest in improving the functionality of special crops using plant factories. This study was conducted to optimize LED conditions for year-round production of quality sweet basil with high polyphenol and essential oil content.
Materials and Methods
Plant Growth and Environmental Conditions in the Plant Factory
Sweet basil (Ocimum basilicum L.) was purchased from Asia Seed Korea (Seoul, Korea). This study was conducted using the nutrient film technique (NFT) and hydroponic cultivation in a plant factory (Insungtec. Co., Yongin, Korea). The environmental conditions in the plant factory were maintained at 22.5 ± 2.5°C and 80 ± 5% relative humidity. The light cycle was 14/10 h light/dark. Sweet basil plants were transplanted into the NFT beds and grown using Yamazaki nutrient solution (EC 2.0 dS·m-1, pH 6.5; Yamazaki, 1982) (Table 1) in the plant factory at 3 weeks after sowing.
Table 1.
The nutrient solution optimized for basil by Yamazaki (1982)
| EC (dS·m-1) | pH | Concentration (me·L-1) | ||||||
| NO3-N | NH4-N | PO4-P | K | Ca | Mg | SO4-S | ||
| 2.0 | 6.5 | 16 | 1.3 | 4.0 | 8.0 | 8.0 | 4.0 | 4.0 |
Due to their low cost of operation, white LEDs were chosen as the main LEDs of the combination treatments; blue lights were used for enhancing functional substances, and red lights were used for good crop growth. The LEDs (DMLED Co., Ltd., Ansan, Korea) consisted of three colors (B: blue; R: red; W: white) that were combined to make the following four combinations: B0:R1:W9 (128 µmol·m-2·s-1), B2:R3:W5 (119 µmol·m-2·s-1), B0:R5:W5 (128 µmol·m-2·s-1), and B0:R1:W12 (136 µmol·m-2·s-1). The nutrient solution was supplied in a circular manner to each of the four bays, and four LED treatments were installed with four blocks per bay. At 3 weeks after sowing, 21 seedlings per block were planted in four blocks to achieve 84 seedlings per LED treatment.
Polyphenol Extraction and Analysis
Briefly, 50 mL of 70% MeOH/water (0.5% Formic acid) was added to 1 g of freeze-dried basil leaves per treatment. After additional shaking for 30 min at 750 rpm, the fraction was filtered with a 0.2-µm filter. The filtered samples were analyzed using a HPLC-PDA (Shimadzu Nexera, Japan) and with an analytical column (Phenomenex Gemini NX C18; 250 mm × 4.6 mm i.d., 3-µm particles).
The mobile phase consisted of (A) methanol:water:formic acid (70:426:4) and (B) acetonitrile. The gradient program was as follows: from 5:95 (0 ‑ 5 min) to 30:70 (30 ‑ 35 min) and then 80:20 (45 min), followed by the original condition (5:95, 46 min). The flow rate of the mobile phase was 0.8 mL·min-1, and the sample injection volume was 10 µL. The content of caffeic acid, chicoric acid, and RA was identified by UV absorption comparison with authentic standards and quantified by the peak absorption area at 325 nm after preparing a standard solution (Suppl. Table 1s).
Radical Scavenging Activity (DPPH assay)
A sample (100 µL) used for HPLC analysis was diluted in a 96-well plate, and 100 µL of 0.5 mM DPPH solution (in ethanol) was added and incubated at 37°C for 30 min. Then, the absorbance was measured at 517 nm and the antioxidant activity was calculated using the following equation:
In addition, the antioxidant activity was measured after 10-fold dilution to determine the exact difference in the antioxidant activity at each treatment.
Extraction and Analysis of Essential Oil Content in Sweet Basil
After crushing 50 g of freeze-dried basil leaves, the mixture was placed in a 3-L round flask and 500 mL of distilled water was added and extracted by steam distillation at 120°C for 3 h. Anhydrous sodium sulfate was added to the extracted essential oil and stored in a freezer for 12 h to obtain essential oil from which water was removed. After weighing the extracted essential oil, 10 µL of essential oil was dissolved in 1 mL of hexane and quantitatively analyzed using a gas chromatography-flame ionization detector (GC-FID) (Shimadzu GC-2010, Japan), and qualitative identification was performed using a gas chromatography/mass selective detector (GC/MSD) (HP5890-5973, Japan). DB-Wax (30 m × 0.25 mm, 0.25 µm film thickness) was used as the column. The temperature of the inlet was 260°C, and the column temperature, maintained at 70°C for 2 min, was raised to 200°C by 3°C·min-1 and maintained at 200°C for 10 min; thereafter, the temperature was raised to 250°C by 10°C·min-1 and continued for 3 min.
The 1-µL sample was injected in split/splitless (20:1 split) mode. Quantitative data were obtained electronically from the GC-FID as area percent. Identification of oil components was accomplished by comparing Kovat retention index with hydrocarbon and GC/MSD followed by library comparison with NIST ADMIS version 2.1 software.
Statistical Analysis
Twenty plants located in the middle of each treatment were harvested at 3 weeks after transplanting and investigated for their growth characteristics, which included total fresh weight (FW), shoot FW, root FW, plant height, and the number of leaves per individual. To analyze the polyphenols and essential oil per LED treatment, the sweet basil leaves at 3 weeks after transplanting were lyophilized using a freeze-dryer (Ilshin Bio Base Co., Ltd., Dongducheon, Korea) for 48 h. Data were assessed using analysis of variance (ANOVA) with SAS 9.2 software (SAS Institute Inc., Cary, NC, USA), and means were compared by Duncan's multiple range test with a significance level of 5%. Graphs were generated with SigmaPlot 10.0 (USA).
Results and Discussion
Growth Characteristics of O. basilicum L. by LED Condition
All four LEDs exerted a significant effect on total fresh weight (FW), shoot FW, and root FW but not on plant height and number of leaves (Table 2). B0:R5:W5 resulted in the largest increases in both total FW and shoot FW of 43.2 and 34.4 g, respectively, compared to other LEDs; however, both plant height and the number of leaves did not change significantly based on LEDs but did show the best average growth with B0:R5:W5.
Table 2.
Influence of various LEDs on growth characteristics of sweet basil at 3 weeks after transplanting (the harvest stage)
Lim and Eom (2013) reported that growth of sweet basil using red or blue monochromatic LEDs was similar at 2 weeks during a total of 6 weeks of growth, but sweet basil at 4 weeks after transplantation showed higher shoot growth under red light than under blue LEDs, fluorescent light, and sunlight. Matysiak and Kowalski (2019) also reported that red LEDs resulted in better growth characteristics of sweet basil than blue LEDs; in particular, the shoot FW of sweet basil exposed to red LEDs was 29% heavier than that noted with blue LEDs. In this study, the high percentage of red LED (B0:R5:W5) treatment increased the total FW and shoot FW.
Rooting of sweet basil increased when exposed to blue LEDs and was 3-fold faster than that noted when exposed to sunlight (Lim and Eom, 2013). Although blue light did not contribute to plant height of sweet basil (Naznin et al., 2019), a dwarfing tendency was observed when compared to LEDs of other wavelengths (Matysiak and Kowalski, 2019). In this study, the blue LEDs did not promote root growth, but the high percentage of white LEDs caused the best increase in root FW. In addition, there were no significant changes in plant height and number of leaves with any of the LED treatments.
Recently, many studies have suggested that combining different colors of LEDs to produce a specific wavelength range, rather than using monochromatic LEDs, may be desirable for growing basil and increasing its functional content at the harvest stage (Carvalho et al., 2016; Schwend et al., 2016; Naznin et al., 2019). Pennisi et al. (2019) suggested that scientific evidences was often constrained by inconsistencies in the experimental setups, often resulting in simultaneous changes of several spectral parameters (e.g., including white, green, orange, and lime portions), lack of clear description of the spectral properties of the LEDs used, or the adoption of limiting lighting conditions (e.g., low PPFDs).. Furthermore, the optimal ratio of blue and red light for the growth of sweet basil indoors was reported as B3:R7:W0 (215 µmol·m2·s-1). Naznin et al. (2019) reported that B1:R9:W0 (200 µmol·m2·s-1) was suitable for increasing shoot FW in lemon basil because it is 1.4-fold heavier than other LEDs.
In conclusion, none of the LED combinations used in this study inhibited the growth of sweet basil, and it is recommended that B0:R5:W5 with a high red LED ratio is suitable for promoting the growth of sweet basil.
Polyphenolic Compound Level and Antioxidant Activity in Sweet Basil Leaves
As shown in HPLC profiles (Fig. 1), we identified three major peaks corresponding to the polyphenols of sweet basil influenced by LEDs. These major polyphenols were consistent with the polyphenols reported in a previous study (Shiga et al., 2009). Rosmarinic acid accounted for the highest percentage of the polyphenols, followed by chicoric acid and caffeic acid (Fig. 1). By comparing the contents of polyphenolics using LED treatment, we found that the B2:R3:W5 treatment led to the highest content of chicoric acid (392.4 mg·g-1) and rosmarinic acid (424.5 mg·g-1) in sweet basil leaves; however, caffeic acid content ranged from 95 ‑ 101 mg·g-1 for all LEDs, indicating that caffeic acid is not affected by LED wavelength (Fig. 2).
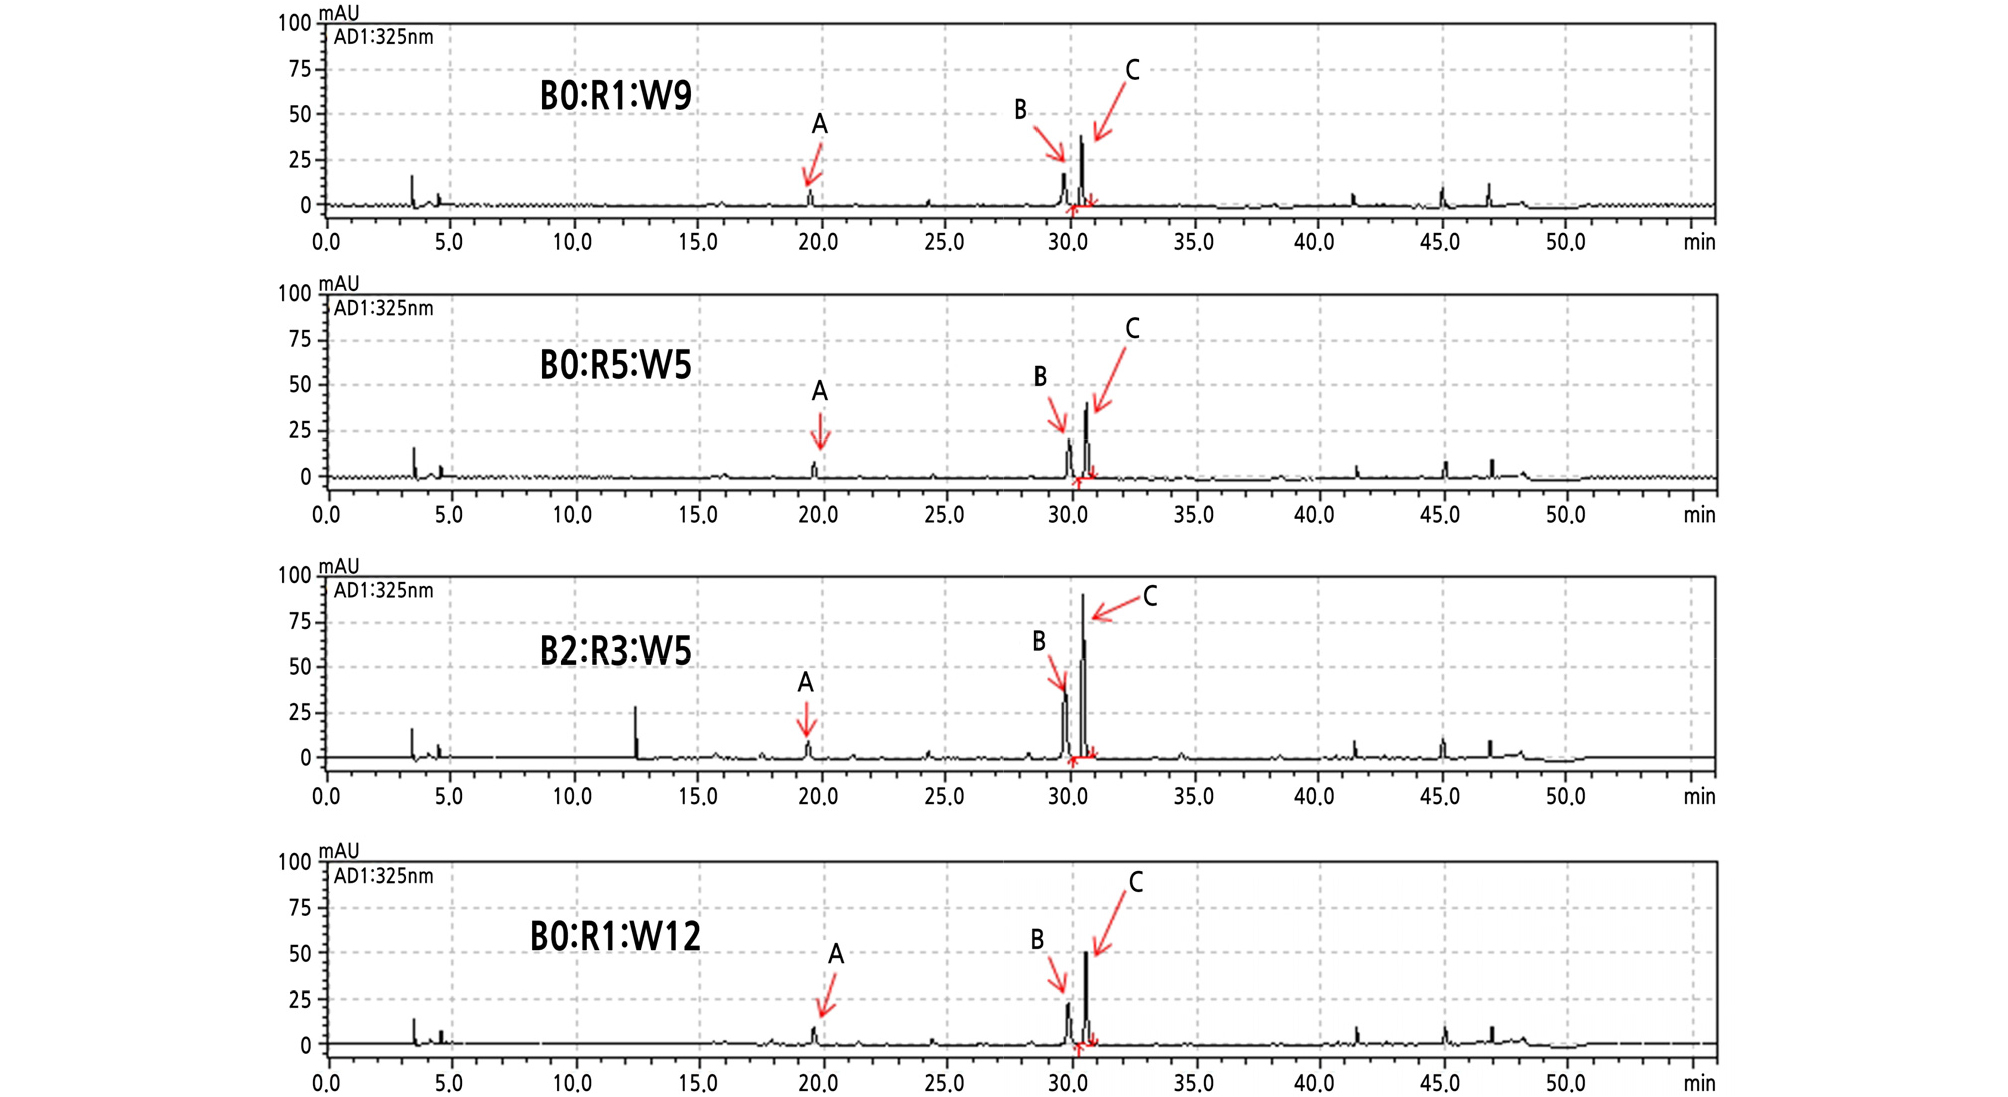
Fig. 1.
HPLC chromatogram of polyphenols in freeze-dried leaves of sweet basil as influenced by four different LEDs in a plant factory. (A) Caffeic acid; (B) chicoric acid; (C) rosmarinic acid. B0:R1:W9 (128 µmol·m-2·s-1, 20W); B2:R3:W5 (119 µmol·m-2·s-1, 20W); B0:R5:W5 (128 µmol·m-2·s-1, 20W); B0:R1:W12 (136 µmol·m-2·s-1, 24W).
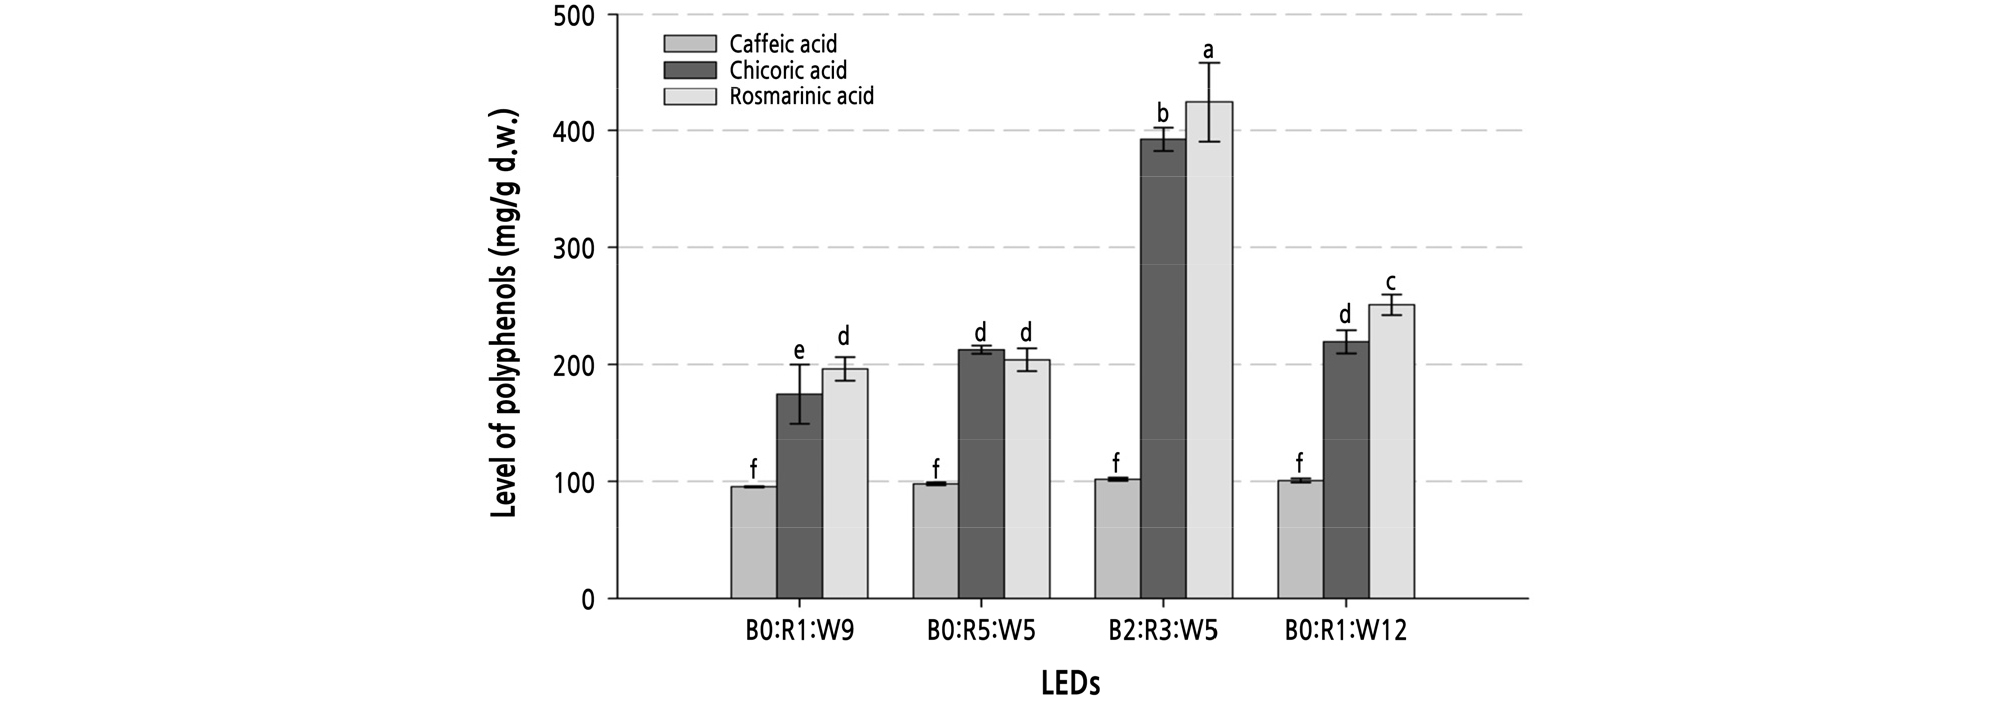
Fig. 2.
Level of three major polyphenols (mg·g-1 d.w.) in freeze-dried leaves of sweet basil as influenced by various LEDs. X-numeric was B0:R1:W9 (128 µmol·m-2·s-1, 20W); B2:R3:W5 (119 µmol·m-2·s-1, 20W); B0:R5:W5 (128 µmol·m-2·s-1, 20W); and B0:R1:W12 (136 µmol·m-2·s-1, 24W). Vertical bars represent the standard error of the mean (n = 3). Different letters in the same column indicate significant differences based on Duncan’s multiple range test (p ≤ 0.05).
Schwend et al. (2016) suggested that the caffeic acid content of sweet basil was not affected by red LEDs. Furthermore, there was no significant difference in the caffeic acid content after exposure to red, blue, or white LEDs (Shoji et al., 2011). The caffeic acid content depends on caffeate O-methyltransferase activity (Gang et al., 2002).
The content of rosmarinic acid has been reported to be affected by white LEDs more than red and blue LEDs (Shiga el al., 2009). In this study, however, the highest amount of rosmarinic acid was detected after B2:R3:W5 LED exposure, and there was no significant difference upon exposure to other LEDs. In previous study of ice plants, a herb plant such as basil, blue LEDs react positively to phytochemaical concentration (Kim et al., 2018) PAL is a well-known precursor for phenol biosynthesis, and Pal was also remarkably upregulated after exposure to blue LEDs (Koukol and Conn, 1961; Son et al., 2012). This increased expression compared to that after exposure to red and white LEDs could be because blue LEDs have the highest energy per proton of visible light (Shoji et al., 2011).
The radical scavenging ability of sweet basil after exposure to different LEDs was examined using the samples employed for HPLC analysis; there was no significant difference in radical scavenging ability after exposure to different LED treatments because more than 80% of this activity was detected in undiluted samples treated with any LED treatment (data not shown). Therefore, samples were 10-fold diluted and then the radical scavenging activity was re-investigated to determine the exact influence of the LED treatments.
In terms of antioxidant activity, we found that the sample subjected to the B2:R3:W5 LED treatment had the highest antioxidant activity, followed by B0:R1:W12, B0:R1:W9, and B0:R5:W5 (Fig. 3). The sample subjected to the B2:R3:W5 LED treatment also had the highest content of chicoric acid and rosmarinic acid, which could have been the reason for the high antioxidant activity of this sample. Shoji et al. (2011) assumed that rosmarinic acid acts as an antioxidant in leaves and protects the leaf tissue against free radicals. Other studies found that exposure to combined red and blue LEDs enhanced the antioxidant activity of basil (Manivannan et al., 2015, Naznin et al., 2016), and UV-B and blue LEDs stimulated phenol synthase (Ebisawa et al., 2008; Sakalauskaitė et al., 2012). A previous study on the antioxidant activity of basil according to LED exposure reported that the sample exposed to a combination of red and blue LEDs (B1:R9:W0, 200 µmol·m-2·s-1) had 1.2 times higher antioxidant activity than that exposed to monochromatic red LEDs (Naznin et al., 2019).
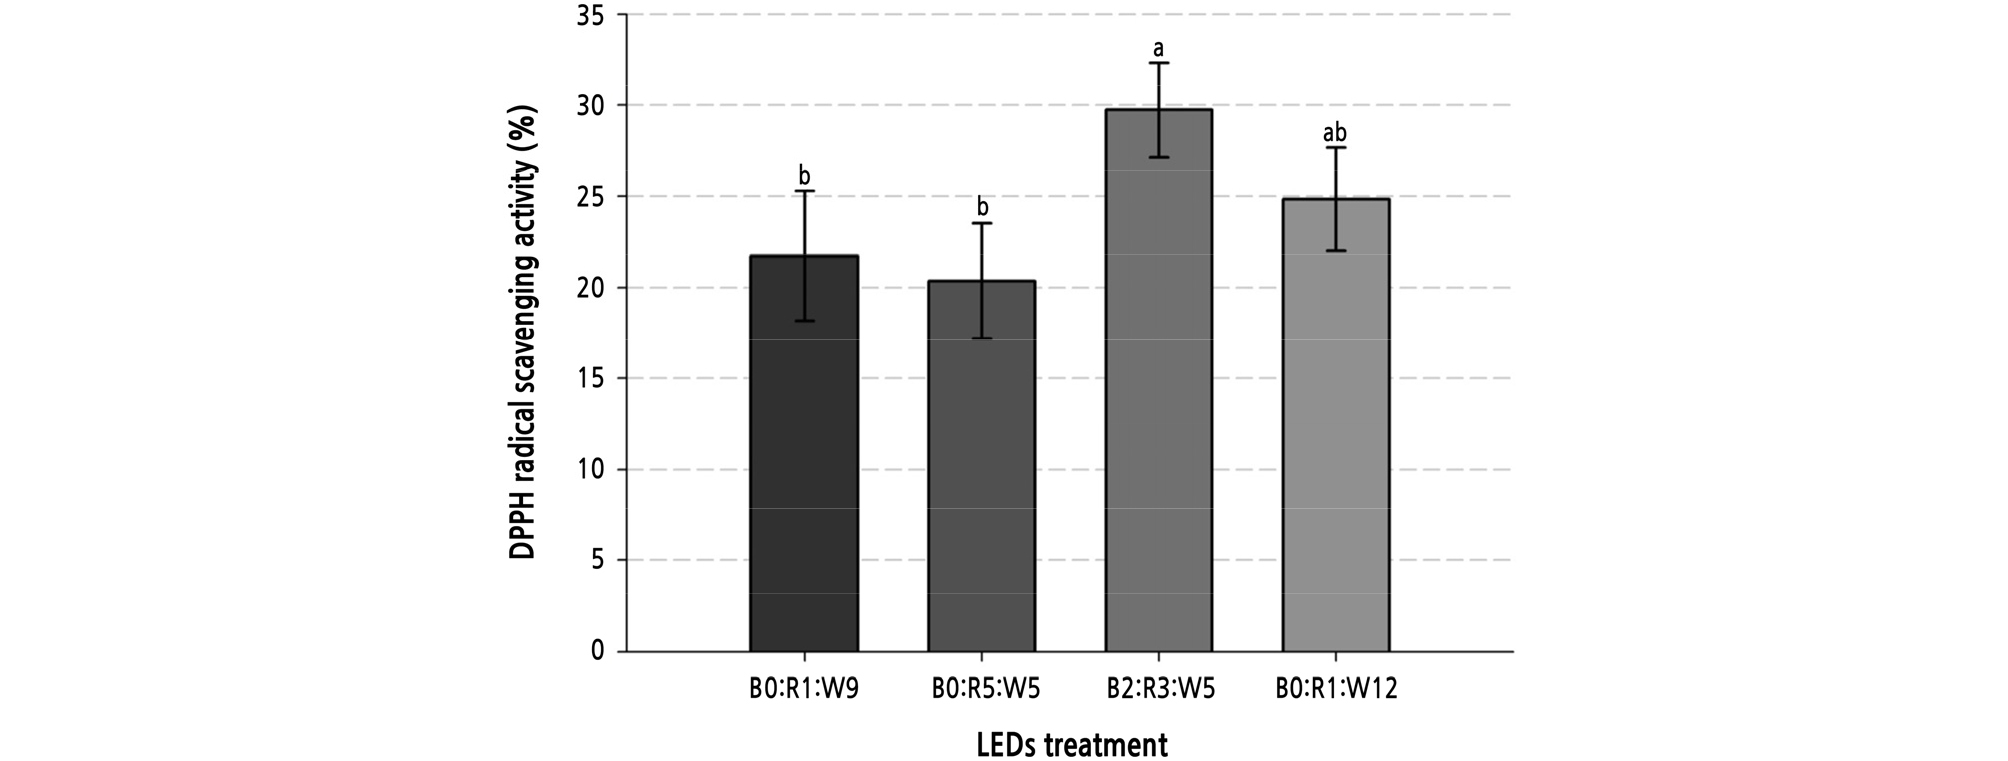
Fig. 3.
DPPH radical scavenging activity diluted 10 times of sweet basil grown under various LED treatments at 3 weeks after transplanting. B0:R1:W9 (128 µmol·m-2·s-1, 20W). B2:R3:W5 (119 µmol·m-2·s-1, 20W). B0:R5:W5 (128 µmol·m-2·s-1, 20W). B0:R1:W12 (136 µmol·m-2·s-1, 24W). Vertical bars represent the standard error of the mean (n = 3). Different letters in the same column indicate significant differences based on Duncan’s multiple range test (p ≤ 0.05).
This study showed that B2:R3:W5LED exposure increased the content of chicoric acid and rosmarinic acid and increased the antioxidant activity of sweet basil. To produce sweet basil with abundant functional polyphenols, exposure to LEDs, including blue LEDs, was recommended. In conclusion, we suggest that B2:R3:W5 LED exposure improves the accumulation and antioxidant activity of polyphenols in sweet basil cultured in a plant factory.
Essential Oil Levels and Composition in Sweet Basil Leaves
The yield of essential oils after the LED treatments was 0.1 ‑ 0.7%, and the extracted absolute content of each essential oil after exposure to B0:R1:W9, B0:R5:W5, B2:R3:W5, and B0:R1:R12LED combinations was 65.50, 213.52, 365.61, and 131.75 mg, respectively (Table 3).
The yield range of essential oils in the LED treatments was 0.1 ‑ 0.7%, and the absolute content of each essential oil at each LED combination (B2:R3:W5; B0:R5:W5; B0:R1:W12; B0:R1:W9) was 365.61, 213.52, 131.75, and 65.50 mg from each 50 g of freeze-dried leaves (Table 3). GC analysis of essential oils revealed 28 peaks in the sample. We identified four major compounds including linalool, estragole, methyl-cinnamate, and eugenol in this study. These same four compounds in basil were reported previously (Lawrence et al., 1988).
Table 3.
Influence of LEDs on essential oil yield of sweet basil
| (𝜇mol·m2·s-1) | Contentz (mg) | Content (%) |
| B0:R1:W9 (128) | 65.50 | 0.1 |
| B0:R5:W5 (119) | 213.52 | 0.2 |
| B2:R3:W5 (128) | 365.61 | 0.7 |
| B0:R1:W12 (136) | 131.75 | 0.2 |
Methyl-cinnamate was the most abundant essential oil (27.6 ‑ 39.4%), followed by linalool (19.2 ‑ 33.1%), estragole (10.1 ‑ 19.6%), and eugenol (1.6 ‑ 4.4%), regardless of the LED combination. When the B0:R1:W12 combination was used, methyl-cinnamate content was the lowest (27.6%), whereas linalool (33.1%) and estragole (19.6%) contents were higher than those obtained with other treatments (Table 4).
Table 4.
Influence of LEDs on the proportion of each essential oil in sweet basil influenced by LEDs
For other compounds, the B2:R3:W5 combination resulted in a higher percentage of eugenol (4.35%) in the essential oil than in other LEDs. However, although 1,8-cineol was identified as a major essential oil component (Marotti et al., 1996; Amaki et al., 2011), the proportion of 1,8-cineol in total essential oils was very low in the present study.
PAL is activated by blue light and catalyzes conversion of L-phenylalanine to methyl-cinnamate via trans-cinnamate, and eugenol is synthesized via ρ-coumaroyl-CoA, starting from PAL. In the present study, as high quantities of methyl- cinnamate and eugenol were detected as a result of using various LED combinations with blue LEDs, we suggest that treatment with blue light increases methyl-cinnamate and eugenol content.
Composition of volatile compounds in essential oils of sweet basil varies depending on the region of production [e.g. Australia (Lachowicz et al., 1996) and Iran (Sajjadi, 2006)], cultivar used (Marotti et al., 1996; Viña and Murillo, 2003), drying condition, and extraction method (Carvalho et al., 2006; Calín-Sánchez, et al., 2012). Amaki et al. (2011) reported that 1,8-cineol was the most abundant component of essential oil, when essential oils were extracted without drying and when basil was harvested 70 days after transplanting. Further, exposure to blue light resulted in the highest yield of the essential oil. Thus, blue light treatment is suggested to be suitable for increasing the content of essential oil components and fragrance compounds in basil.
Terpenoids are the major components of essential oils extracted from herbs. In the present study, the sweet basil grown under B0:R1:W9, with a high ratio of white LEDs, showed a higher amount of sesquiterpene group (C15) compounds such as germacrene-D, β-elemene, α-bisabolene, α-bergamotene, γ-cardinene, and nerolidol. In contrast, sweet basil grown under B0:R1:W12, with the highest ratio of white LEDs, showed a higher content of monoterpene group (C10) compounds such as linalool, estragole, and camphor. However, the content of methyl-cinnamate and eugenol, which belong to the monoterpene group, was the highest under B0:R5:W5 and B2:R3:W5 combinations, respectively.
Noguchi and Amaki (2016) assumed that the direction of terpenoid biosynthesis would be determined during the evolutionary process. They also proposed that the wavelength of LED used affects the direction of essential oil biosynthesis in Mexican mint (Plectranthus amboinicus). Essential oil extracted from Mexican mint exposed to blue LEDs mainly contained large amounts of sesquiterpene group (C15) compounds such as β-panesene, germanicen-D, and elemental, whereas that extracted from Mexican mint exposed to red LEDs contained large amounts of monoterpene group compounds (C10) such as α-pinene, β-pinene, and limonene.
Thus, controlling the wavelength of the light used with various LED combinations within a plant factory is expected to modulate the yield and specific composition of essential oils in sweet basil. In conclusion, the B2:R3:W5 treatment increased polyphenol and essential oil content in sweet basil.
Supplementary Material
Supplementary materials are available at Horticultural Science and Technology website (https://www.hst-j.org).
- HORT_20200057_Table_1s.pdf
Special Issue
