

Introduction
Materials and Methods
Plant materials and DNA extraction
In silico analysis
GBS library preparation and quality assessment
Results and Discussion
In silico evaluation of enzyme strategies
Chromosomal distribution of in silico enzyme sites
GBS library construction and sequencing
Implications for SNP calling and allele dosage estimations
Conclusions
Introduction
Persimmon (Diospyros kaki Thunb.) is an economically important fruit crop that was initially cultivated throughout East Asia (Yonemori et al. 2000). As a hexaploid species (2n = 6x = 90), it has a complex genome that shows significant challenges for genome-wide SNP discovery, genotype calling, and allele dosage estimations (Li et al. 2023; Park et al. 2023). In addition, the persimmon genome is relatively large, with an estimated haploid genome size of approximately 4.52 Gb, and comprises 90 chromosome-level pseudomolecules (Li et al. 2023). Compared with diploid species, polyploid genomes require a greater sequencing depth to distinguish between homologous and homeologous alleles accurately. Thus, careful selection of genotyping-by-sequencing (GBS) parameters, particularly restriction enzymes that determine how much the genome complexity is reduced and the sequencing depth, is important when conducting a genomic analysis and in breeding applications in persimmon (Wang et al. 2022; Li et al. 2023).
To overcome these challenges, GBS has become a widely used and cost-effective approach for genome-wide SNP discovery, genomic selection (GS), haplotype identification, genome-wide association studies (GWAS), and quantitative trait locus (QTL) analyses in both model and non-model plant species (Elshire et al. 2011; Poland et al. 2012; Fu et al. 2014; Fu et al. 2016). This approach offers a rapid, high-throughput, and cost-effective method for genome-wide analyses of genetic variations and association mapping (Poland and Rife 2012; He et al. 2014; Fu et al. 2014; Fu et al. 2016; Kagale et al. 2016; Scheben et al. 2017). In Korea, GBS has been extensively employed in genome studies to improve new cultivar development, pure line selection, and phylogenetic analysis outcomes in various major crops (Eun et al. 2016; Lee et al. 2016; Heo et al. 2017).
The success of GBS studies depends largely on the selection of restriction-enzymes, which determines genome simplification, the fragment size distribution, marker density, and the sequencing depth (Poland et al. 2012; Scheben et al. 2017). The original GBS protocol used the methylation-sensitive restriction enzyme ApeKI, whereas subsequent double-digest strategies, such as PstI–MspI, were developed to improve genome representation and to realize a more controlled reduction in the genome complexity in barley and wheat (Poland et al. 2012). A previous optimization study further demonstrated that different restriction enzyme combinations can substantially influence marker recovery and the SNP discovery efficiency in chrysanthemum (Nguyen et al. 2018).
Genome-wide SNP analyses in persimmon remain relatively limited but have expanded with the development of genomic resources. Akagi et al. (2020) assembled the first chromosome-scale reference genome of Diospyros kaki, providing an essential framework for genome analysis and marker development. Subsequently, Ma et al. (2021) developed kompetitive allele-specific PCR (KASP) markers from GBS-derived SNPs for persimmon cultivar identification. In earlier work, a PstI–MspI-based GBS strategy was applied for a population genetic analysis of 93 Korean Diospyros kaki cultivars (Park et al. 2023). Although that study demonstrated the feasibility of GBS for SNP discovery and genetic analysis in persimmon, the performance of the PstI–MspI strategy relative to alternative restriction-enzyme strategies has not been systematically evaluated under equivalent genomic and sequencing conditions. In particular, differences in the predicted fragment-size distribution, retained fragment number, genome representation, and expected sequencing depth remain unclear. Rather than simply confirming the performance of PstI–MspI, a comparative in silico evaluation is needed to provide a quantitative basis for restriction-enzyme selection by evaluating the trade-off between the number of genomic fragments retained and the expected sequencing depth, which is particularly relevant for GBS design in the complex hexaploid persimmon genome.
The primary objective of this study was to evaluate restriction-enzyme strategies based on the in silico digestion of the Diospyros kaki cv. Xiaoguo-tianshi genome. The predicted fragment-size distribution, retained fragment number, genome representation, and expected sequencing depth were evaluated to identify a suitable enzyme strategy for GBS library construction in persimmon. The selected enzyme strategy was subsequently applied to construct and sequence an experimental GBS library to evaluate its practical applicability.
Materials and Methods
Plant materials and DNA extraction
A total of 295 F1 individuals derived from a cross between ‘Ro-19’ × ‘Taishu’ and parental plants were collected in 2025 from an experimental orchard located in Yeongam province, South Korea. The youngest leaves from each plant were collected, and immediately stored at ‒80°C until DNA extraction. Genomic DNA (gDNA) was extracted using a DNeasy Plant Mini Kit (QIAGEN, Valencia, CA, USA) according to the manufacturer’s instructions. The concentration and purity of the DNA were measured using a DS-11 spectrophotometer (DeNovix Inc., Wilmington, DE, USA). Samples with an A260/280 ratio between 1.8 and 2.0 were considered to have optimal purity. The gDNA samples were subsequently stored at ‒80°C until further analysis.
In silico analysis
Prior to GBS library preparation and sequencing, the reference genome of Diospyros kaki cv. Xiaoguo-tianshi (GenBank assembly accession: GCA_028777405.1; assembly version: ASM2877740v1; Li et al. 2023) was subjected to an in silico analysis. Seven restriction-enzyme strategies were evaluated: ApeKI, PstI–MspI, ApeKI–PstI, ApeKI–EcoRI, ApeKI–MseI, ApeKI–HindIII, and ApeKI–TfiI. The reference genome was used to determine the frequency of restriction sites for each enzyme across individual chromosomes through an in silico analysis. The genome-wide distribution of predicted restriction sites was evaluated based on their physical positions and cut-site frequencies along the chromosomes. For each restriction-enzyme strategy, fragments of 201–500 bp were retained. This size interval was defined as the analytical window because fragments within this range were generally considered suitable for efficient amplification and Illumina sequencing during the GBS library preparation step. The number and proportion of fragments retained within this interval were calculated for the expected sequencing depth; and for genome representation. The input parameters and values used in the calculations are summarized in Supplementary Table S1, and the equations are described below.
Number, total length, and mean length of selected fragments
For each enzyme combination, only fragments within the specified size-selection range (201–500 bp) were selected from the in silico digestion results. For enzyme combination ‘i’, the number of selected fragments was defined as ‘Ni’, and the length of each fragment was defined as ‘Lj’.
The total length of the selected fragments, ‘Ti’, was calculated as the sum of the lengths of all selected fragments.
The mean length of the selected fragments was calculated as follows:
Genome representation (%)
Genome representation was defined as the physical proportion of the entire reference assembly employed by restriction fragments selected through an in silico digestion and size selection, rather than the proportion covered by sequencing reads. ‘G’ represents the length of the entire reference assembly actually used for digestion (G = 4,500,528,094 bp); therefore, the 4.06-Gb attached sequence alone was not used either in the denominator, or in a separate haploid-equivalent genome. Because genome representation is an essential criterion of enzyme digestion and size selection, the sequencing output, read length, and usable-read proportion were not included in this calculation.
Usable read pairs per sample
The total sequencing output of 100 Gb was defined as the total nucleotide yield combining R1 and R2. For PE151, one read pair corresponds to 302 bp; therefore, the number of usable read pairs per sample was calculated as follows:
Here, ‘Qtotal’ represents the total sequencing output (bp), ‘n’ represents the number of multiplexed samples, ‘r’ represents the length of one read (bp), and ‘u’ represents the usable sequencing proportion.
Expected read-pair depth per selected fragment
Under the theoretical assumption that each selected restriction fragment is sequenced at an equal proportion, the expected mean read-pair depth for enzyme combination ‘i’ was calculated by dividing the number of usable read pairs per sample by the number of selected fragments.
This value is not equivalent to conventional whole-genome base coverage, instead representing the expected mean number of read pairs per selected restriction fragment. In actual experiments, the locus-specific depth may vary owing to be restriction digestion efficiency, PCR bias, size-selection efficiency, library pooling, mapping loss, and other factors.
Because GBS involves a trade-off between the number of genomic loci sampled and the sequencing depth per locus, enzyme strategies were evaluated based on predicted fragment characteristics, genome representation, and the expected read-pair depth per selected fragment. For hexaploid persimmon, a relatively high value for the expected depth was considered important for potential downstream SNP calling and allele-dosage estimations. The final enzyme strategy was selected based on the combined consideration of these predicted parameters and previous empirical applications in persimmon.
GBS library preparation and quality assessment
The gDNA samples were obtained from F1 individuals, including the parental plants, and were subjected to a quality check (QC) assessment, which was performed by BIOTO-Bio Technology Optimization Co., Ltd. (Daejeon, Republic of Korea) (Supplementary Fig. S1). Based on the in silico evaluation, the PstI–MspI double-digestion strategy was used for GBS library preparation and sequencing. The DNA QC was assessed by agarose gel electrophoresis; a total of 3 µL of gDNA at concentration of 20 ng/µL; was digested with PstI and MspI using ten units of restriction enzyme in a total reaction volume of 20 µL containing EzBuffer 3. The digestion reaction was incubated at 37°C for 12 h.
Following digestion, common and sample-specific barcode adapters were ligated to the digested DNA using T4 DNA ligase in a total reaction volume of 30 µL at 22°C for 2h. The common adapter consisted of the forward sequence (F: CGAGATCGGAAGAGCGGGGACTTTAAGC) and the reverse sequence (R: GTCTCGTGGGCTCGGAGATGTGTATAAGAGACAGCCGCTCTTCCGATCT). The barcode adapter consisted of the forward sequence (F: TCGTCGGCAGCGTCAGATGTGTATAAGAGACAGxxxxTGCA and the reverse sequence (R: yyyyCTGTCTCTTATACACATCTGACGCTGCCGACGA), where the barcode sequence was sample-specific. A unique sample-specific barcode of 4–8 bp was assigned to each sample. The barcode sequences and corresponding sample assignments for each sample are provided in Supplementary Table S2.
After adapter ligation, equal volumes of 24 individually barcoded samples were combined to generate each pooled library. The pooled libraries were amplified using HF polymerase with indexed primers. The forward primer was 5'-AATGATACGGCGACCACCGAGATCTACAC[i5 index] TCGTCGGCAGCGTCAGA TGTGTATAAGAGACAG-3', and the reverse primer was 5'-CAAGCAGAAGACGGCATACGAGAT[i7 index] GTCTCGTGGGCTCGGAGATG TGTATAAGAGACAG-3'. PCR amplification was performed for 16 cycles, consisting of denaturation at 95°C for 30 s, annealing at 62°C for 30 s, and extension at 68°C for 30 s. Following amplification, the libraries were subjected to bead-based purification and size selection, targeting fragments of approximately 400–600 bp. The 201–500 bp fragment-size range used in the in silico analysis represented only the computational fragment-selection window and was not the experimental size-selection range.
A total of 288 samples were used for library construction. Thus, the samples were divided into three sets of 96 samples. Within each set, samples were further divided into four groups of 24 samples for multiplexed library preparation, resulting in a total of 12 pooled GBS libraries. GBS positive controls (PC) and negative/no-template controls (NTC) were also included in each pooling batch. Each pooled library was initially assessed by loading 5 µL onto agarose gel with a 100-bp DNA ladder (M), with this followed by electrophoresis at 180 V for 30 min and visualization under UV illumination. Samples exhibiting intact, high-molecular-weight DNA without visible degradation were defined as quality check–pass (QC-pass) (Supplementary Fig. S2). The libraries that passed the quality-control criteria were used for sequencing.
The GBS libraries were sequenced on an Illumina NovaSeq X platform using 150-bp paired-end (PE150) sequencing with a 10B flow cell and the NovaSeq X Series 10B reagent Kit (300 cycles). To determine the fragment size of the PCR-amplified products from the PstI–MspI double-digest GBS library, the library size distribution was analyzed using an Agilent TapeStation High Sensitivity D5000 ScreenTape assay.
Results and Discussion
GBS is a reduced-representation sequencing approach widely used for genome-wide SNP discovery and genotyping across diverse plant species (van Orsouw et al. 2007; Elshire et al. 2011). The efficiency and accuracy of GBS are influenced by several factors, including the selection of the restriction enzyme, library complexity, sequencing depth, fragment size distribution, and bioinformatic pipeline (Elshire et al. 2011; Rabbi et al. 2014). In a GBS analysis, the selection of appropriate restriction enzymes and effective genome complexity reduction are two critical factors that influence library performance and SNP discovery efficiency outcomes (Nguyen et al. 2018). In the present study, we evaluated candidate restriction enzyme combinations through the in silico digestion of the persimmon reference genome and identified the most suitable enzyme strategies for GBS library construction based on expected fragment size, predicted genome representation, and the expected sequencing depth.
In silico evaluation of enzyme strategies
The in silico digestion analysis showed substantial variation in the predicted fragment-size distributions among the seven restriction-enzyme strategies: PstI–MspI, ApeKI, ApeKI–PstI, ApeKI–EcoRI, ApeKI–MseI, ApeKI–HindIII, and ApeKI–TfiI (Fig. 1 and Supplementary Table S3). The proportion of small fragments (0–100 bp) was highest for ApeKI–MseI (48.35%); and ApeKI–PstI (40.75%), whereas PstI–MspI produced the lowest proportion of small fragments (12.96%), together with the highest proportion of fragments >2,000 bp (20.94%), reflecting its lower cutting frequency.
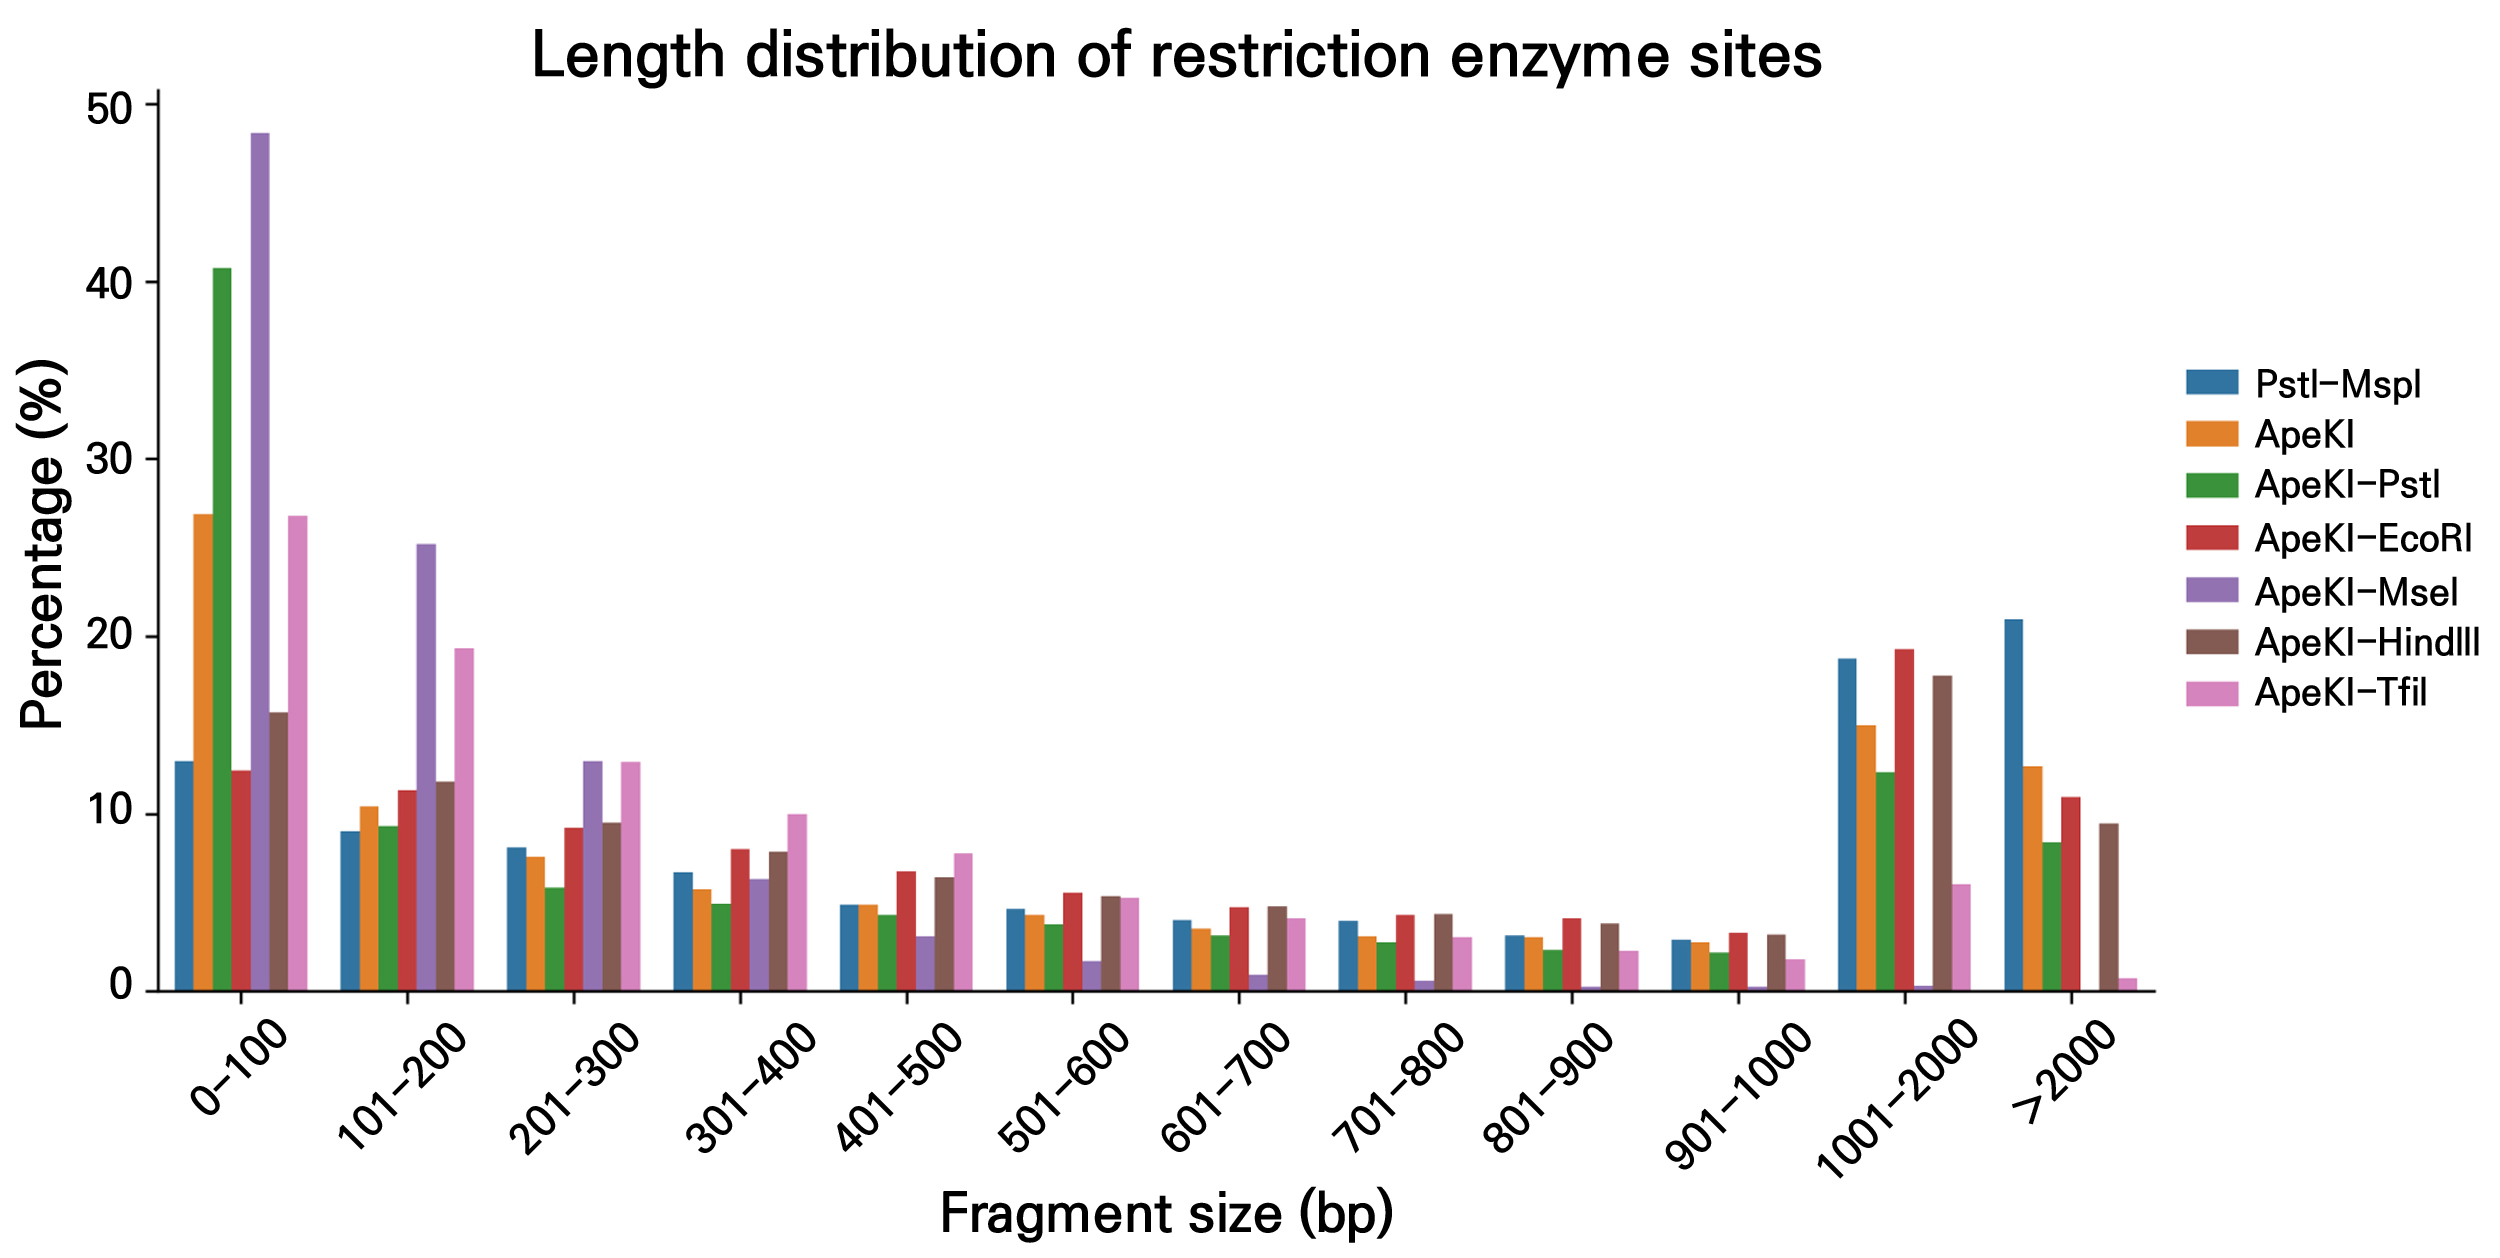
Fig. 1.
Comparison of predicted fragment-size distributions produced by seven restriction enzyme combinations through an in silico analysis using the Diospyros kaki cv. Xiaoguo-tianshi reference genome. The 201–500 bp size range represents the analytical size window selected for the genotyping-by-sequencing (GBS) libraries.
Within the 201–500 bp analytical window, the proportion of retained fragments ranged from 15.09% (ApeKI–PstI) to 30.68% (ApeKI–TfiI); however, the absolute number of retained fragments followed a markedly different order, with ApeKI generating the largest number (857,432) and PstI–MspI and ApeKI–PstI the smallest (80,937 and 74,288, respectively) (Table 1 and Supplementary Table S3). This discrepancy arose because the total number of fragments differed widely among the strategies, indicating that the retained-fragment proportion alone is not a reliable criterion for library design.
Table 1.
Comparative evaluation of restriction enzyme combinations for GBS library construction based on an In Silico analysis using the Diospyros Kaki cv. Xiaoguo-tianshi reference genome
Differences in the number of selected fragments and the total length of the selected fragments were subsequently reflected in the predicted genome representation and expected read-pair depth per selected fragment. For instance, ApeKI showed the highest predicted genome representation (6.36%), followed by ApeKI–TfiI (5.32%) and ApeKI–MseI (4.46%), though these strategies had relatively low expected read-pair depths per selected fragment (3.22×, 3.82×, and 4.13×, respectively). In contrast, ApeKI–PstI generated the fewest selected fragments (74,288) and the lowest predicted genome representation (0.56%) but provided the highest expected read-pair depth per selected fragment (37.14×). PstI–MspI generated 80,937 of number of selected fragments with a predicted genome representation of 0.60% and provided the second-highest expected read-pair depth (34.09×). The intermediate strategies, ApeKI–EcoRI and ApeKI–HindIII, showed predicted genome representations rate of 1.62% and 1.82% and expected read-pair depths per selected fragment of 12.81× and 11.31×, respectively. Overall, these results highlight a trade-off between the predicted genome representation and expected read-pair depth per selected fragment among the evaluated restriction-enzyme strategies.
The results here indicate that the fragment-size distributions reflected differences in the restriction-site frequency and the degree of genome complexity reduction among the enzyme strategies. In particular, the higher proportion of large fragments generated by PstI–MspI reflects its lower cutting frequency and stronger genome complexity reduction, consistent with previous GBS studies (Poland et al. 2012; Fu et al. 2016). In the present in silico analysis, ApeKI–PstI provided the highest expected read-pair depth per selected fragment (37.14×), followed closely by PstI–MspI (34.09×). Although PstI–MspI did not provide the highest predicted depth, it showed strong genome complexity reduction ability, retaining 80,937 fragments within the 201–500 bp analytical window with a predicted genome representation rate of 0.60%. Moreover, its practical applicability in hexaploid persimmon has been demonstrated: Park et al. (2023) applied PstI–MspI-based GBS to 93 Diospyros kaki cultivars and identified 236,947 initial SNPs, of which 9,751 high-quality SNPs were retained for population genetic analyses. Taken together, the comparable expected depth and the previously validated application support the selection of PstI–MspI as a suitable strategy for GBS library construction and sequencing in the present study.
Chromosomal distribution of in silico enzyme sites
The in silico analysis revealed distinct chromosomal distributions of predicted restriction-enzyme cut sites for each enzyme strategy across all chromosomes of the Diospyros kaki cv. Xiaoguo-tianshi reference genome, indicating a broad genome-wide distribution of cut sites (Fig. 2 and Supplementary Fig. S3). Although the overall distribution patterns varied among the enzyme combinations, predicted restriction sites were found across the entire genome and were not restricted to a few chromosomes. Localized peaks of the cut-site frequency were observed in specific chromosomal regions, reflecting restriction-site abundance variations along the chromosomes. Thus, these results suggest that all restriction-enzyme combinations provided genome-wide sampling of the persimmon genome while differing in terms of the restriction-site density and distribution, which may contribute to differences in genome complexity reduction and the expected sequencing depth.
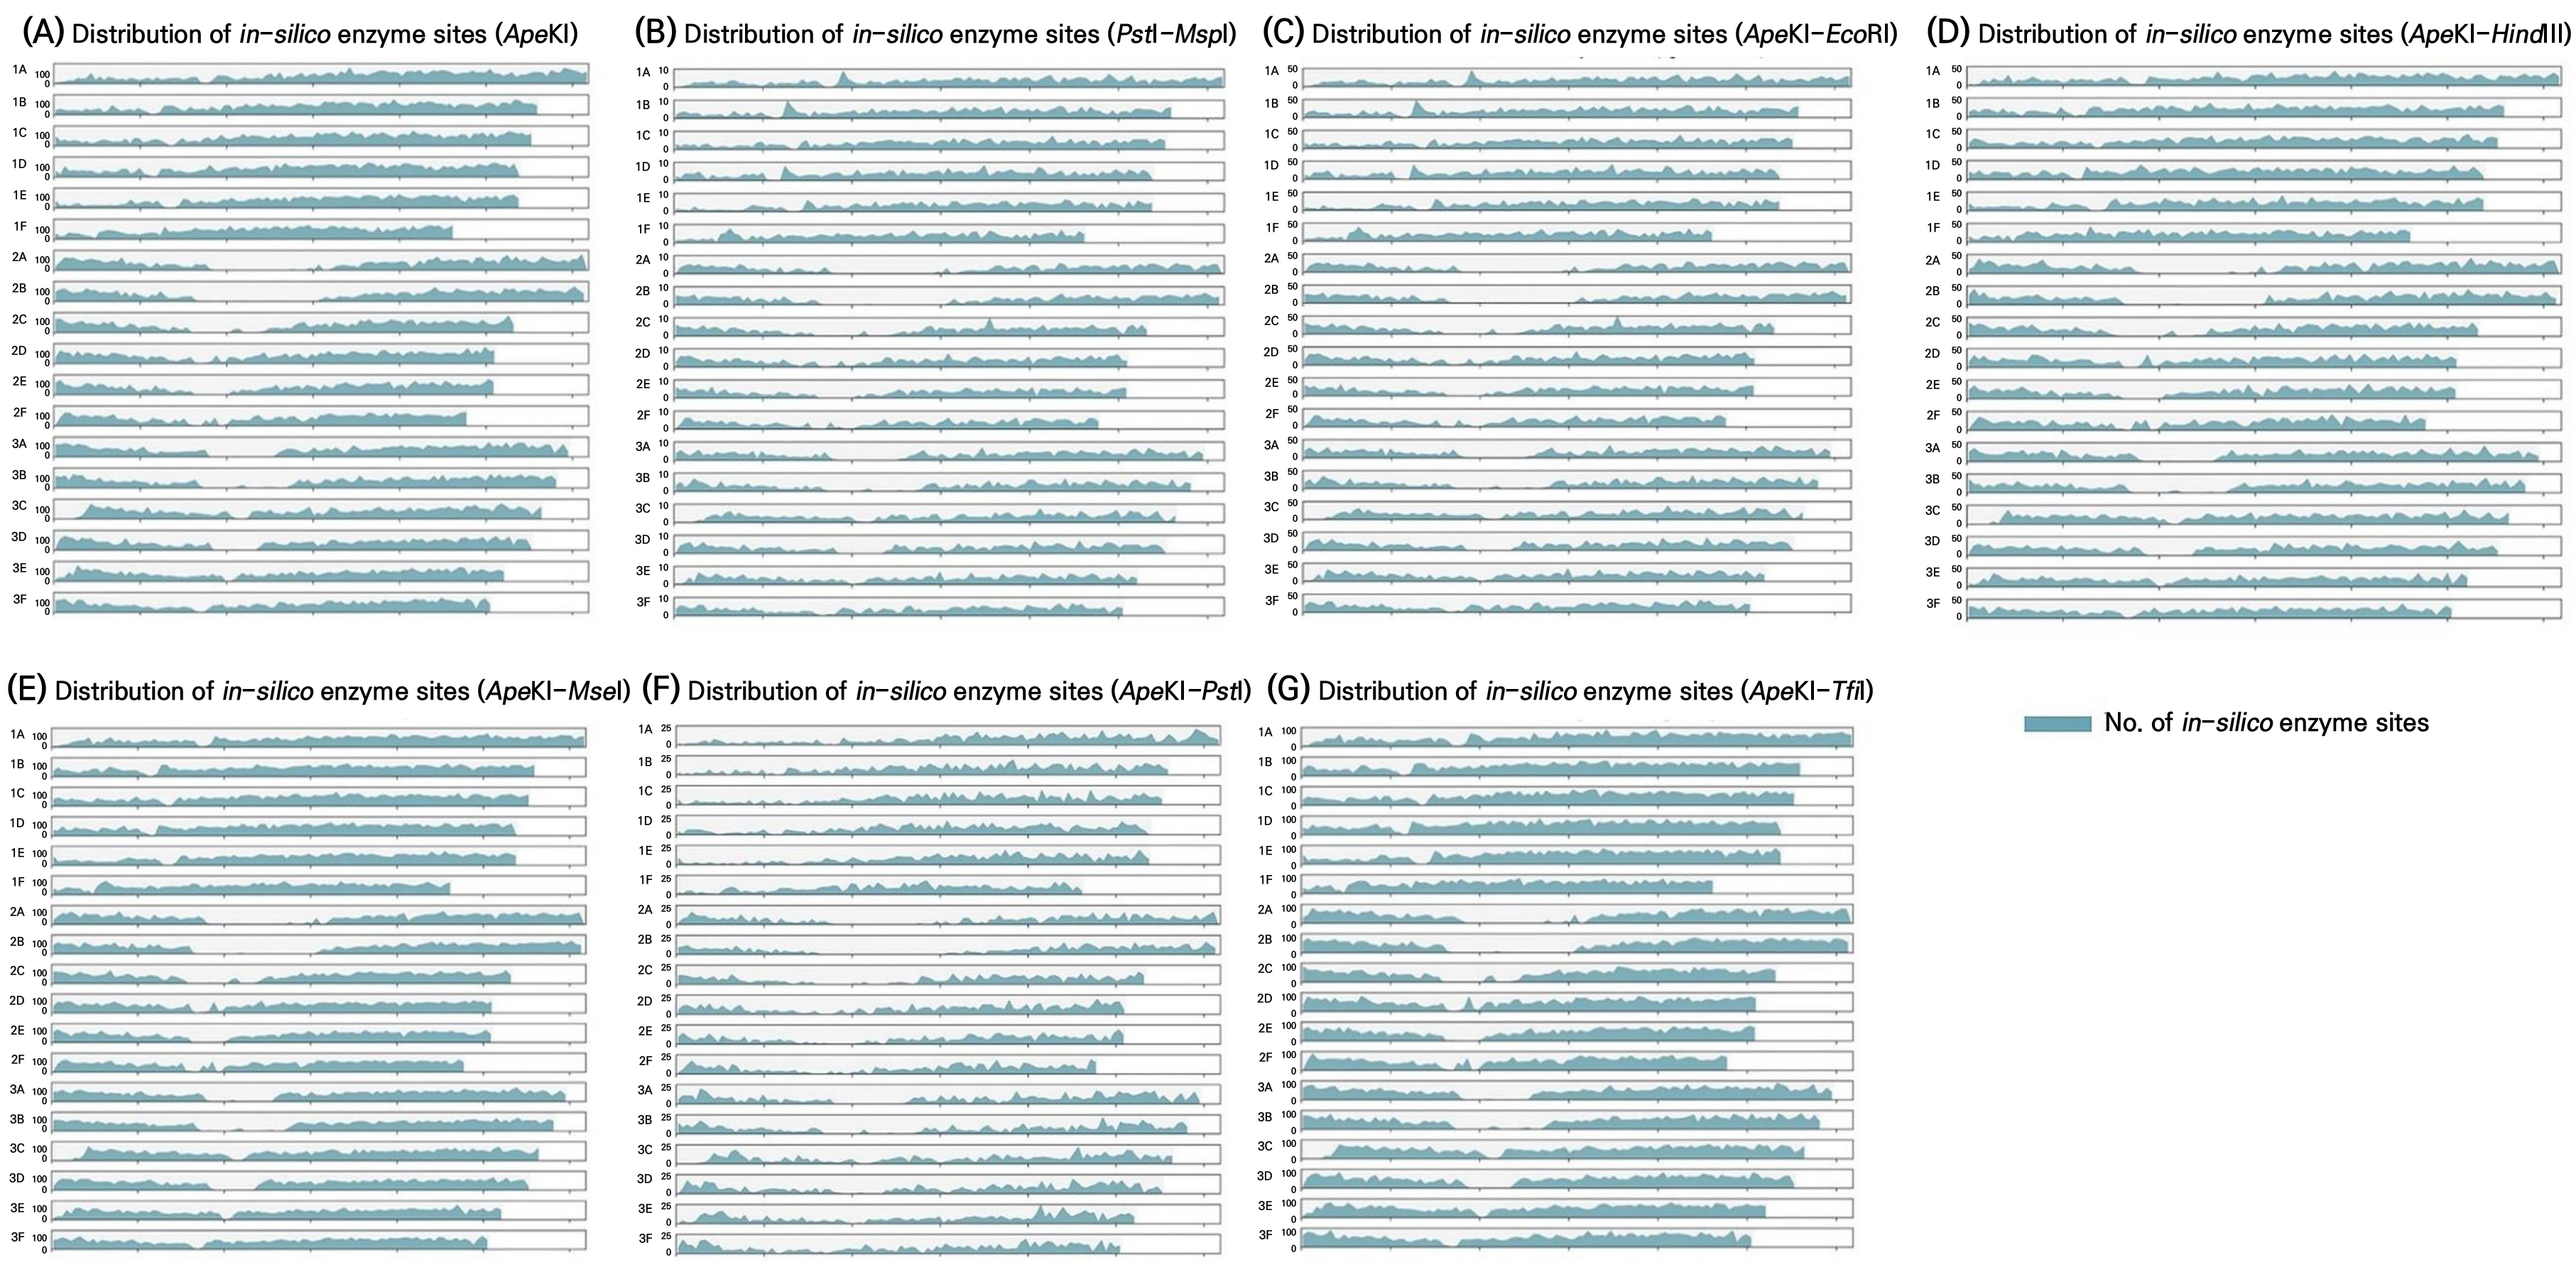
Fig. 2.
Selected chromosomal distribution of predicted restriction enzyme cut sites in the Diospyros kaki cv. Xiaoguo-tianshi reference genome through an in silico evaluation of restriction-enzyme strategies: (A) ApeKI, (B) PstI–MspI, (C) ApeKI–EcoRI, (D) ApeKI–HindIII, (E) ApeKI–MseI, (F) ApeKI–PstI, and (G) ApeKI–TfiI. Blue peaks represent the relative frequency of restriction sites across each individual chromosome.
GBS library construction and sequencing
Following the in silico evaluation, the selected PstI–MspI restriction-enzyme combination was used for experimental GBS library construction and sequencing. Of the 295 F1 individuals, 282 passed the DNA quality control assessment; together with three parental replicates, a total of 288 samples were divided into three sets of 96 samples. Within each set, samples were further divided into four groups of 24 individually barcoded samples, resulting in a total of 12 pooled GBS libraries. Sample identities and the corresponding inline barcodes and i5/i7 index sequences used for library preparation and subsequent demultiplexing are provided in Supplementary Table S2. Agarose gel electrophoresis showed detectable library products across all 12 pooled libraries, supporting successful library construction (Supplementary Fig. S2). A capillary electrophoresis-based assessment further characterized the fragment-size distributions and concentrations of the constructed libraries. The electropherograms showed distinct distributions of amplified library fragments across all 12 libraries, with prominent major peaks and varying proportions of larger fragments among the libraries (Fig. 3). The quality assessment of the PstI–MspI double-digest GBS libraries showed that all 12 libraries met the library quality criteria., with fragment sizes of 409–570 bp, concentrations of 6.87–32.68 ng µL-1, and molar concentrations of 24.99–91.36 nM (Table 2), confirming their suitability for subsequent sequencing. The experimental application of the selected PstI–MspI strategy was limited to a single biparental F1 population derived from ‘Ro-19’ × ‘Taishu’. Although successful library construction and sequencing across this population demonstrated the practical feasibility of the strategy within this genetic background, these results should not be interpreted as evidence of its general applicability across the diverse persimmon germplasm. Further evaluations using genetically diverse cultivars and independent breeding populations will be necessary to assess the broader robustness and applicability of this strategy.
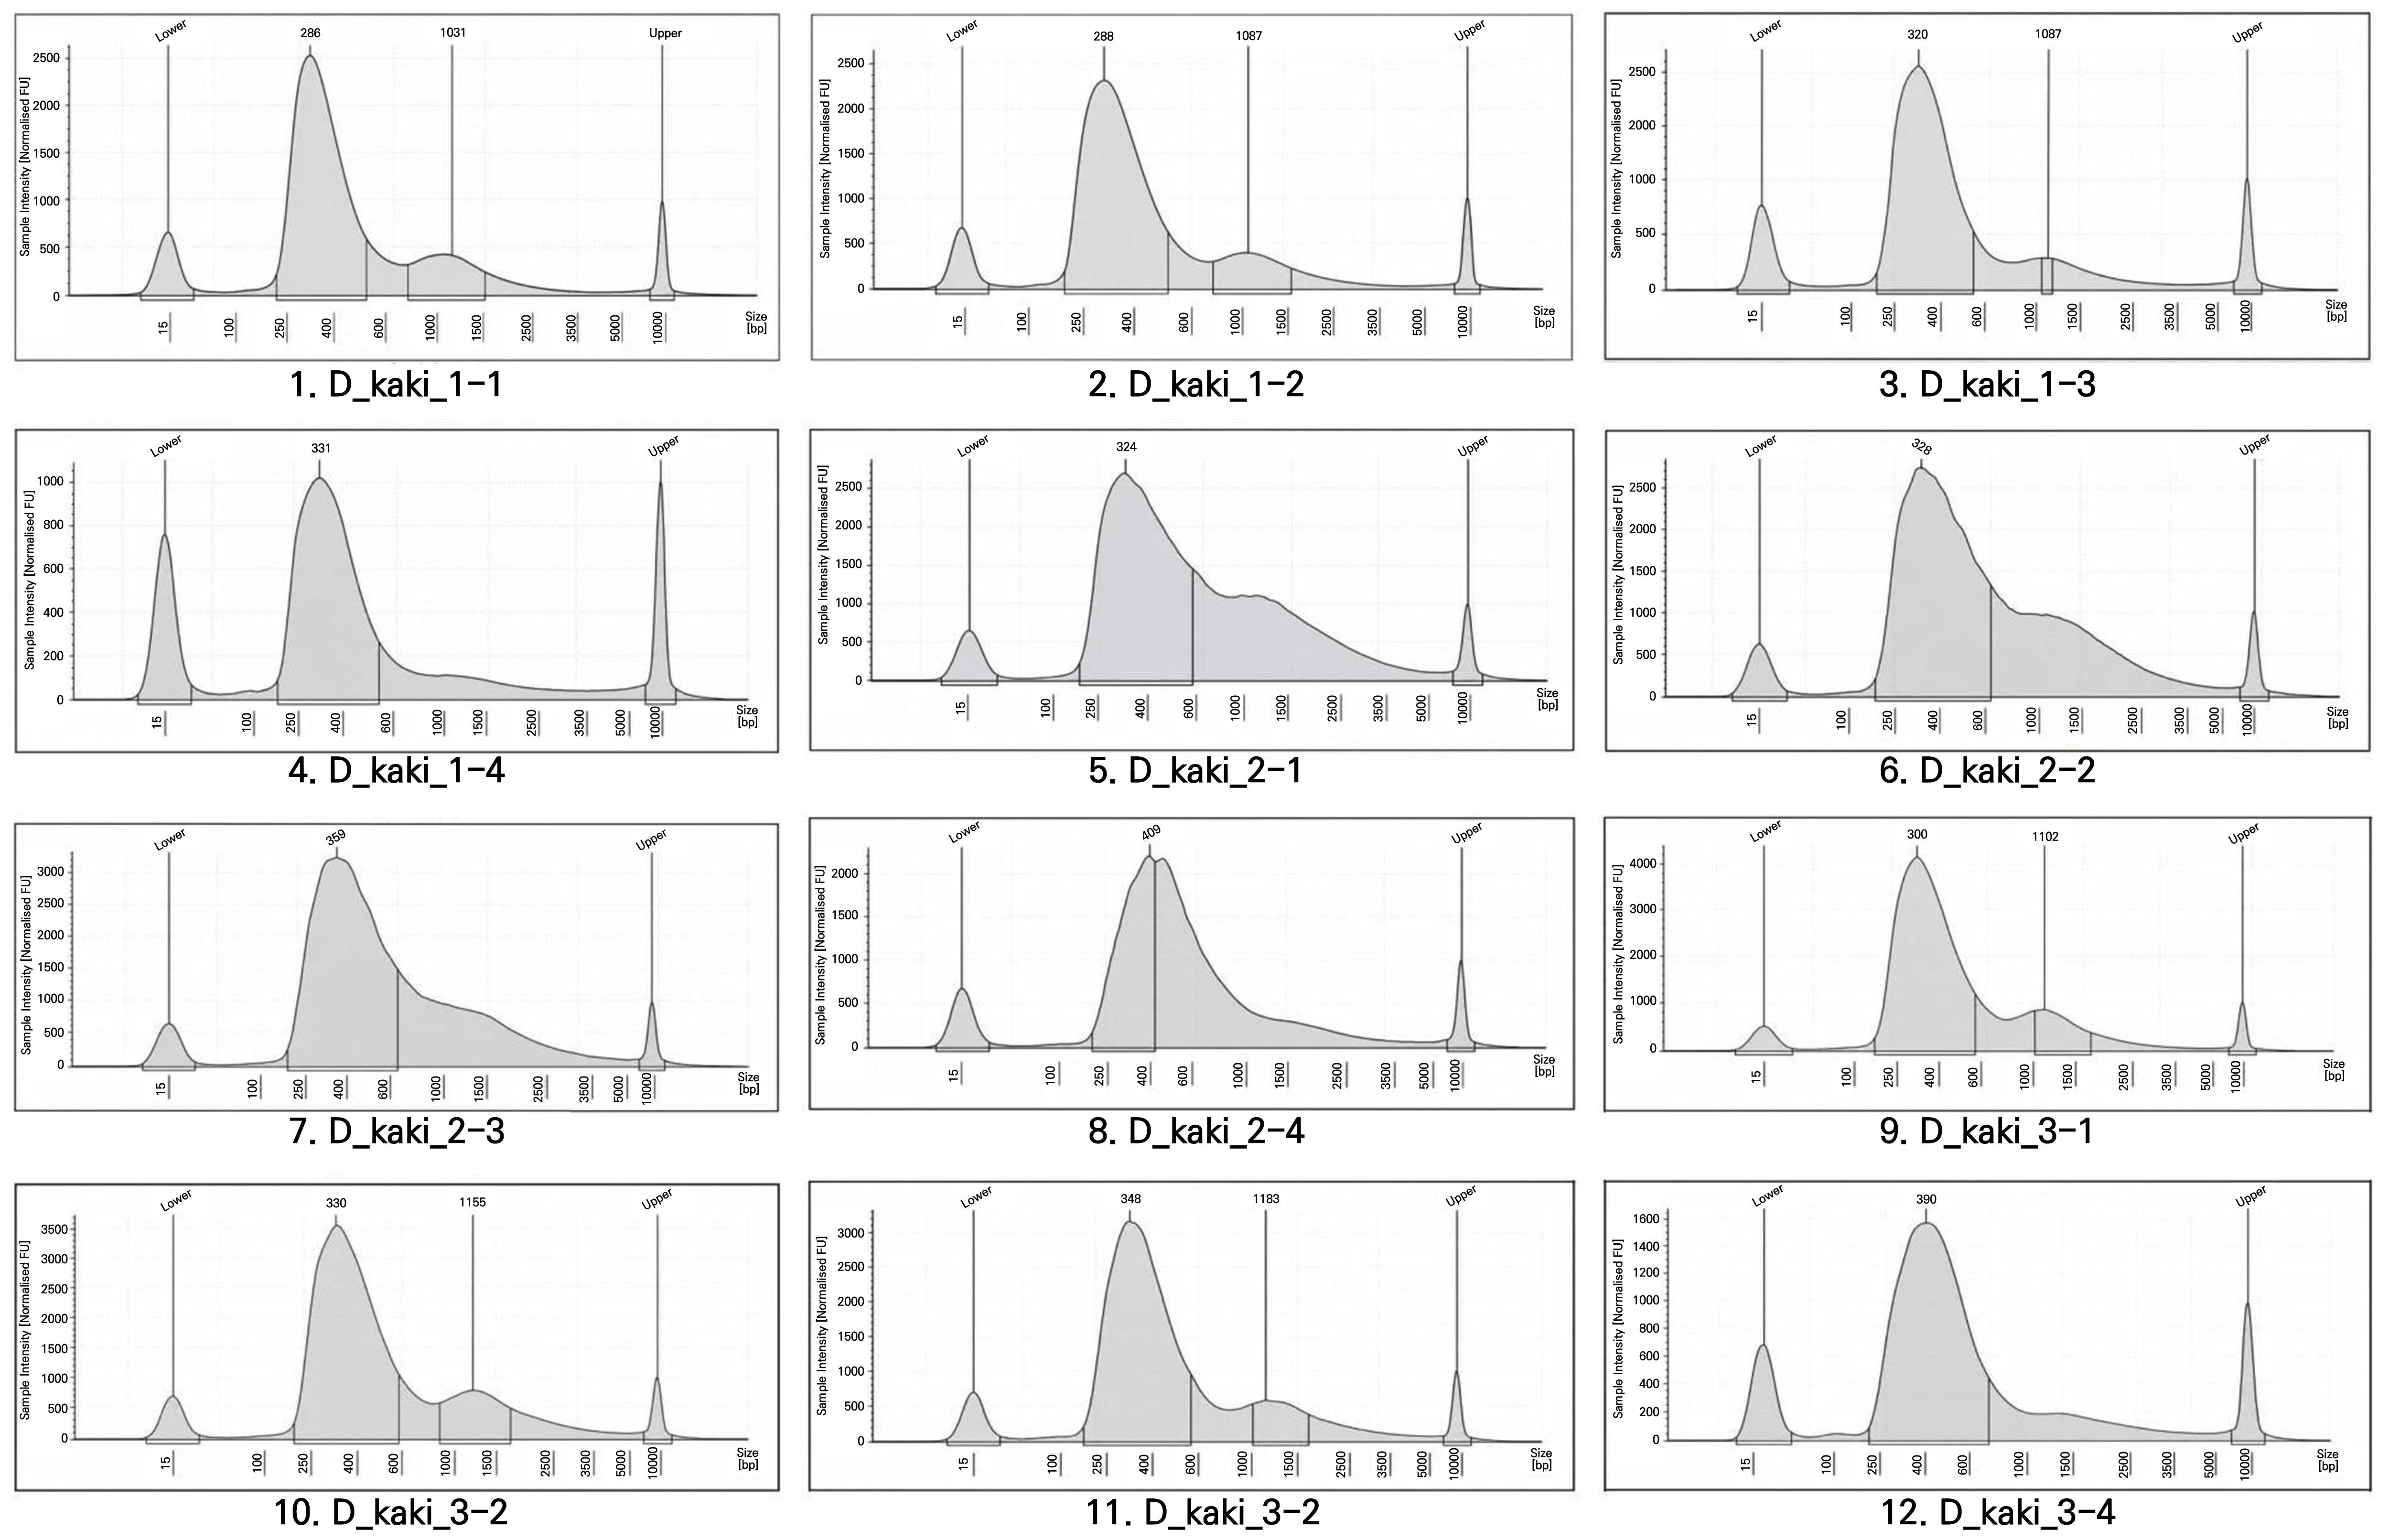
Fig. 3.
Quality assessment of GBS libraries using the Agilent TapeStation High Sensitivity D5000 ScreenTape assay. Electropherograms of the 12 GBS libraries (D_kaki_1-1 to D_kaki_3-4) displayed the fragment size distributions after PCR amplification, flanked by lower (15 bp) and upper (10,000 bp) internal standard markers. All libraries indicated an optimal fragment size distribution for downstream Illumina high-throughput sequencing.
Table 2.
GBS library quality check assessment using the agilent tapestation high sensitivity D5000 screentape system
Implications for SNP calling and allele dosage estimations
GBS reduces genome complexity by using restriction enzymes to selectively capture a subset of genomic fragments for sequencing, thereby concentrating reads at a reduced number of loci. Consequently, restriction-enzyme selection affects the trade-off among the number of selected fragments, genome representation, and the expected read-pair depth per selected fragment. Our in silico analysis demonstrated this trade-off among the evaluated enzyme strategies. ApeKI, ApeKI–MseI, and ApeKI–TfiI generated relatively large numbers of selected fragments and broader genome representation but distributed the expected sequencing reads across more loci, resulting in a lower expected read-pair depth per selected fragment. In contrast, PstI–MspI and ApeKI–PstI generated substantially fewer selected fragments and lower genome representation but concentrated the expected reads across fewer loci, resulting in the highest expected read-pair depth per selected fragment (34.09× and 37.14×, respectively).
This trade-off is particularly relevant for hexaploid persimmon (Diospyros kaki; 2n = 6x = 90), where a sufficient read-pair depth per locus is important for distinguishing multiple allelic states and may improve the reliability of SNP calling and allele-dosage estimation (Wang et al. 2022). Therefore, the higher expected read-pair depth per selected fragment obtained with PstI–MspI may offer an advantage over strategies that prioritize maximizing fragment numbers, whereas the lower expected read-pair depth per selected fragment predicted for ApeKI and related combinations may increase uncertainty in genotype calling and allele-dosage estimation. These considerations are relevant to downstream applications of GBS-derived SNP markers, including genetic diversity analysis, population structure analysis, linkage mapping, and genome-wide association studies (Scheben et al. 2017). However, because SNP calling, genotype accuracy, and allele-dosage estimation were not considered in the present study, the predicted advantages of PstI–MspI require further validation through a downstream analysis of the generated sequencing data.
Conclusions
In this study, restriction-enzyme strategies were comparatively evaluated through an in silico analysis using the Diospyros kaki cv. Xiaoguo-tianshi reference genome. The evaluated strategies differed substantially in terms of the predicted fragment-size distribution, number of selected fragments, genome representation, and expected read-pair depth per selected fragment. Among the evaluated strategies, PstI–MspI provided strong genome complexity reduction while maintaining a relatively high expected read-pair depth per selected fragment, supporting its suitability for GBS library construction in hexaploid persimmon. The selection of PstI–MspI was further supported by its previous successful application for GBS-based SNP discovery and population genetic analysis in persimmon. The PstI–MspI strategy was subsequently applied to an experimental GBS library construction process as well as; multiplexing, quality assessment, and sequencing, demonstrating its practical feasibility in the ‘Ro-19’ × ‘Taishu’ F1 population. However, SNP discovery, genotype accuracy, allele-dosage estimation, and downstream genetic analyses were not evaluated in the present study. A further analysis of the generated sequencing data is therefore required to assess SNP yield and quality, genotype and allele-dosage accuracy levels, missing data, and marker distribution and to further validate the performance of the selected GBS strategy.
Supplementary Material
Supplementary materials are available at Horticultural Science and Technology website (https://www.hst-j.org).
- HORT_20260054_Table_S1.docx
Supplementary Table S1. Input Parameters and Value used for the In Silico Analysis of the Genome Representation and Expected Sequencing Depth for the Evaluated Restriction-Enzyme Strategies
- HORT_20260054_Table_S2.xlsx
Supplementary Table S2. GBS barcodes Information using Double Enzyme (PstI&MspI), UDP1
- HORT_20260054_Table_S3.xlsx
Supplementary Table S3. Comparison of Retained Fragments among Restriction-Enzyme Strategies through an In Silico Svaluation using The Diospyros kaki cv. Xiaoguo-tianshi Reference Genome for GBS Library Construction and Sequencing
- HORT_20260054_Fig_S1.pptx
Supplementary Fig. S1. Agarose gel electrophoresis for the quality assessment of 295 genomic DNA (gDNA) from F1 individuals derived from the cross between ‘Ro-19’ and ‘Taishu’. Samples exhibiting intact, high-molecular-weight DNA with minimal degradation were classified as quality control–pass (QC-pass) samples for GBS library preparation. Lane M: 1 kb Plus DNA ladder; lanes 1–295: F1 individuals.
- HORT_20260054_Fig_S2.pptx
Supplementary Fig. S2. Quality assessment of pooled GBS libraries constructed from 288 persimmon samples. A total of 288 samples were pooled in groups of 24, resulting in 12 GBS libraries. Agarose gel electrophoresis confirmed the successful construction of all 12 pooled libraries, which were subsequently subjected to an additional library quality assessment. Lane M: DNA ladder (100-bp); lanes 1–4: GBS libraries 1-1 to 1-4; lanes 5–8: GBS libraries 2-1 to 2-4; lanes 9–12: GBS libraries 3-1 to 3-4; lane 13: GBS positive control (GBS PC); lane 14: GBS no-template control (GBS NTC).
- HORT_20260054_Fig_S3.zip
Supplementary Fig. S3. Genome-wide distribution of restriction-enzyme recognition sites across the 90 chromosomes of the Diospyros kaki cv. Xiaoguo-tianshi reference genome. Restriction sites were identified by an in silico digestion and were plotted across all chromosomes to compare enzyme strategies for GBS library construction.
