

Introduction
Materials and Methods
Experimental Site and Plant Cultivation
Data Collection and Statistical Analysis
Results and Discussion
Morphological Variations
Correlation among Phenotypic Traits
Cluster Analysis
Principal Component Analysis
Introduction
Onions (Allium cepa L.) are among the oldest vegetable crops, cultivated worldwide by humans (Kotsareva et al., 2019). Central Asia is considered the primary center of the origin of the diploid onion (Gvozdanovic-Varga et al., 2013). Onions are the second most important vegetable crop after tomatoes globally and are produced across approximately 5.2 million hectares (FAOSTAT, 2019). The distinct flavor and pungency of onions places them as an essential ingredient in many cuisines around the world. Onions are mainly used as a vegetable in cooking, but they can be consumed uncooked in sandwiches and salads. In addition, they can be dried and can be used as spices and powder for processed foods, such as chips and crackers. They can also be chopped, and frozen as a type of mass-produced food stuff (Gokce, 2022). Due to their nutritional benefits and culinary use, the consumption of onions has increased worldwide.
In Korea, onions are the second most important vegetable after kimchi cabbage (KOSIS, 2018). Onion production is currently estimated to be around 1.2 million tonnes, showing a decrease from 1.58 million tonnes in 2021 (KOSIS, 2022). Short- and intermediate-day onion cultivars are commercially cultivated in southern South Korea. In general, bulb onions are planted from late October to early November to produce seeds in July using the bulb-to-seed method. Seed production of onion commonly takes place in plastic tunnels and green bottle flies serve as the primary pollinators. Although hybrid onion cultivars are grown throughout the country, seed production does not receive significant attention. Seed quality is also considered as a major problem in the onion industry in Korea. At present, the low seed self-sufficiency rate (~ 30%) and high seedling costs (~18% of the production costs) are the major problems faced by onion growers (Luitel et al., 2023). Thus, the identification of potential accessions from the diverse onion gene pool is essential for producing high levels of quality seed and developing proper breeding programs.
Onion is a photo- and thermo-sensitive plant (Jones and Mann, 1963). Bulb vernalization also affects bolting and flowering in onion germplasms. In Korea, previous studies have focused on seed production of the early maturing male sterile onion line ‘Wonye30003’ (Kim et al., 2013) and on agronomic practices (Kim et al., 2009; Son et al., 2013). Many researchers (Rubatzky and Yamaguchi, 1999; Rafieipour et al., 2011; Islam et al., 2011; Tesfaye et al., 2018; Kotsareva et al., 2019) have carried out phenotypic evaluations of seed yield and yield components in onion germplasms in different countries. Manjunathagowda and Anjanappa (2020) studied 30 open-pollinated onion genotypes for the identification of sterile male plants. Male sterility is an important tool in heterosis breeding to overcome the barrier of onion breeding systems. Male sterility occurs naturally in plants where the plants fail to produce functional pollen grains (Manjunathagowda and Anjanappa, 2020). Bolting, flowering and the potentiality of seed production vary among accessions.
A large number of onion germplasms have been collected in Korea recently, but the genetic variability with regard to seed yield and the corresponding yield components in the germplasms have not yet been studied. The National Agrobiodiversity Center (NAC) recently begun to regenerate onion genetic resources, but their characterization of seed traits in particular remains incomplete. Large-scale phenotypic characterization efforts and evaluations of onion accessions may help to identify novel lines for breeding. Understanding the associations among morphological traits may also help with the selection of those with high seed yields. Furthermore, genetic variation is essential to develop high-yielding onion varieties. The identification of potential lines associated with bolting, flowering, male sterility and the seed production capacity can provide a useful insight for onion breeders and seed producers. Therefore, this study sought to assess the genetic variability of seed yield and seed yield components in onion genetic resources.
Materials and Methods
Experimental Site and Plant Cultivation
This study was conducted at the Allium Vegetable Research Institute (34° 59' 25.6344" N, 126° 28' 54.0696" E, 31.48 m above sea level) in Muan-Gun, Jeollanam-Do from November of 2021 to June of 2022. The climate of the experimental site is the humid sub-tropical type and it receives more rainfall throughout the summer (i.e., June–September) and less during winter (i.e., November–March) (KMA, 2022). The soil texture of the research station is classified as clay, with pH values ranging from 5.5 to 7.2 (http://soil.rda.go.kr). Cattle manure was utilized at a rate of 21 tonnes·ha-1. Pre-plant fertilizers such as urea (46% N), fused phosphate and potassium oxide (50% K2O) were applied at the rate of 80:33.6:58 (N: P2O5: K2O) kg·ha-1, respectively, according to the fertilizer recommendation of the Rural Development Administration (RDA, 2010). After fertilization, black plastic mulch film was used to cover each plot. Uniform sized and un-sprouted bulbs were chosen for planting. Bulbs of 80 onion germplasms collected from different countries (Suppl. Table 1) were transplanted on the second week of November of 2021 at equal spacing of 30 × 20 cm inside the plastic housing. Bulbs were planted depending on their availability (numbers of bulbs planted are shown in Suppl. Table 2). Each genotype was separated by nylon wiring to avoid crossing during the flowering time and green bottle flies (Lucilia illustris) were used as pollinators. Intercultural operations (weeding, irrigation and pest control) were done as recommended by the RDA (2022).
Data Collection and Statistical Analysis
Phenotypic traits including days to bolting initiation (DBI), days to flower initiation (DFI), days to 50% flowering (DFF), scapes·plant-1 (no.), scape height (cm), scape diameter (cm), 1,000 seed weight (g), seed yield (g·plant-1), male sterility, seed size and seed color were examined using the descriptors of the International Union for the Protection of New Varieties of Plants (UPOV, 2008), and reference descriptors of Allium spp. (IPGRI, 2001). The number of DBI was determined by the number of days from the date of bulb planting to the appearance of a visible flower stalk. The number of DFI was determined by counting the number of days from bulb planting to the point when visible flowers bloomed. The number of DFF was calculated as the number of days from the date of bulb planting up to the point when more than 50% of plants in each plot produced flowers. The number of scapes as well as the height and diameter were measured randomly on three plants from each plot at the flowering stage. After drying the umbels for two weeks, threshing was done to attain the seeds. Then, the weight of 1,000 seeds (g) was measured. Seed yield·plant-1 (g) was estimated as the total seed weight obtained divided by the number of harvested plants·plot-1. Sterile male plants were observed visually and distinguished by the naked eye with technical expertise at the flowering stage, and were assessed on a scale of 1 to 9, where 1: absent, 3: <10%, 5: 11–49%, 7: >50% and 9: 100% (UPOV, 2008). Seed size was assessed on a scale of 3 to 7, where 3: small, 5: medium, 7: large, and 9: mixed. Finally, seed color was assessed on a scale of 1 to 3, where 1: brown, 2: black, 3: others, and 9: mixed.
Microsoft Excel (version 16.0, Microsoft, Redmond, WA, USA) was used to compile descriptive statistics on phenotypic data. Pearson correlation coefficients and cluster and principal component analyses (PCA) were conducted on the eleven morphological traits using Minitab Statistical Software (version 20.0, Minitab Inc. State College, PA, USA).
Results and Discussion
Morphological Variations
The measurement results of the morphological traits and the corresponding variations among the 80 onion accessions are presented in Table 1 and Suppl. Table 2. A wide range of variation was observed for most of the studied traits. The DBI ranged from 113.0 (K168154) to 173.0 (IT121613), with an average value of 148.0 days. Similarly, the DFI ranged from 173.0 (K168154) to 209.0 (IT121630), with an average value of 192.0 days. The DFF varied from 188.0 (IT109552, K168154) to 225.0 (IT121630), with an average value of 202.0 days. The number of scapes·plant-1 ranged from 1.0 (IT121721, IT121722, IT135868 and IT136008) to 13.0 (IT121598), with an average value of 5.4. The minimum scape height (12.2 cm) was found in IT121547 and the maximum (148.0 cm) was found in IT121699, with the average being 106.8 cm. The scape diameter ranged from 1.5 (IT121659) to 4.3 cm (K270686), with the mean value of 2.9 cm. The thousand seed weight (TSW) varied from 2.2 (IT121731) to 4.7 g (IT121690), with an average value of 3.4 g. The lowest and highest seed yields were recorded in IT136008 (0.4 g·plant-1) and IT163870 (27.2 g·plant-1), respectively. Seed yield showed the highest variation (64.1%), followed by the number of scapes·plant-1 (42.8%), and the scape height (21.3%). As a result, this study identified more than 50.0% sterile male plants in 16 accessions and large-sized seeds in 40 accessions. Naveen Kumar (2022) reported that days to flowering varied in sterile male lines. They also reported up to a 4.5 g seed yield·plant-1 value in different onion accessions, but the present study reported the highest seed yield (27.2 g·plant-1). In this study, the variations observed in the seed yield and yield traits are mostly due to genotypic differences. Significant (p < 0.05) genotypic differences in days to bolting, the number of scapes·plant-1, the scape height, and the seed yield were reported by Fufa et al. (2021). Rubatzky and Yamaguchi (1999) reported significant (p < 0.05) differences in the scape height in onion landraces. The variations in the scape height and seed yield are due to genetic traits (Rabinowitch, 1990; Fritsch and Friesen, 2002). In addition to genetic traits, the number of scapes·plant-1 and the seed yield also depend on agronomic factors such as the planting time (Tesfaye et al., 2018) and bulb size (Meulen-Muisers and Oeveren, 1996; Rafieipour et al., 2011).
Table 1.
Variations in eleven morphological traits of 80 onion germplasms evaluated at Muan-Gun, Jeollanam-Do, Korea, in 2021‒2022
| Morphological traits | Maximum | Minimum | Mean | SD (±)z | CV (%)y | |||
| Values | Genotypes | Values | Genotypes | |||||
| Day to bolting initiation (DBI) | 173.0 | IT121613 | 113.0 | K168154 | 148.0 | 9.6 | 6.5 | |
| Days to flowering initiation (DFI) | 209.0 | IT121630 | 173.0 | K168154 | 192.0 | 7.7 | 4.0 | |
| Days to 50% flowering (DFF) | 225.0 | IT121630 | 188.0 | IT109552 K168154 | 202.0 | 7.5 | 3.7 | |
| Scape·plant-1 (no.) | 13.0 | IT121598 | 1.0 |
IT121721 IT121722 IT135868 IT136008 | 5.4 | 2.3 | 42.8 | |
| Scape height (cm) | 148.0 | IT121699 | 12.2 | IT121547 | 106.8 | 22.8 | 21.3 | |
| Scape diameter (cm) | 4.3 | K270686 | 1.5 | IT121659 | 2.9 | 0.6 | 19.5 | |
| 1,000 seed weight (g) | 4.7 | IT121690 | 2.2 | IT121731 | 3.4 | 0.5 | 14.6 | |
| Seed yield (g·plant-1) | 27.2 | IT163870 | 0.4 | IT136008 | 10.3 | 6.6 | 64.1 | |
| Male sterility (1–9) | 7.0 | IT163768 (16) | 1.0 | IT109552 (62) | - | - | - | |
| Seed size (3–7) | 7.0 | IT109552 (40) | 3.0 | IT121624 (10) | - | - | - | |
| Seed color (1–3) | 2.0 | - | 1.0 | IT203340 (1) | - | - | - | |
The frequency distributions of the eleven phenotypic traits among the onion germplasms are shown in Fig. 1. DBI in the range of 131.0 to 160.0 had the highest number of accessions (72; Fig. 1A). DFI in the range of 181.0 to 200.0 contained the highest number of accessions (63; Fig. 1B). DFF in the range of 191.0 to 205.0 had the highest number of accessions (56; Fig. 1C), and the number of scapes·plant-1 in the range of 5.0 to 6.0 contained the highest number of accessions (32; Fig. 1D). The scape height in the range of 101.0 to 120.0 had the largest number of accessions (27.0, Fig. 1E), and the scape diameter in the range of 2.9 to 3.4 cm had the highest number of accessions (34; Fig. 1F). The TSW weight when varying from 2.6 to 3.5 g had the highest number of accessions (48; Fig. 1G), and the seed yield in the range of 6.0 to 10.0 g·plant-1 had the highest number of accessions (22), followed by the range of 1.0 to 5.0 g·plant-1 (21 accessions; Fig. 1H). A total of 62 accessions had fertile male lines, whereas 16 accessions contained more than 50% sterile male plants (Fig. 1I). Large-sized seeds were recorded in 40 accessions (Fig. 1J) and 77 accessions contained black-colored seeds (Fig. 1K). Morphological traits exhibited wide ranges of variation among the accessions, and these traits are useful to characterize onion varieties. The morphological characterization facilitates better selection of superior lines in breeding programs (Key, 1988). In earlier work, frequency statistics were used to show variation of phenotypic traits in a study of lettuce (Sung et al., 2016) and perilla (Luitel et al., 2017; Kim et al., 2021).
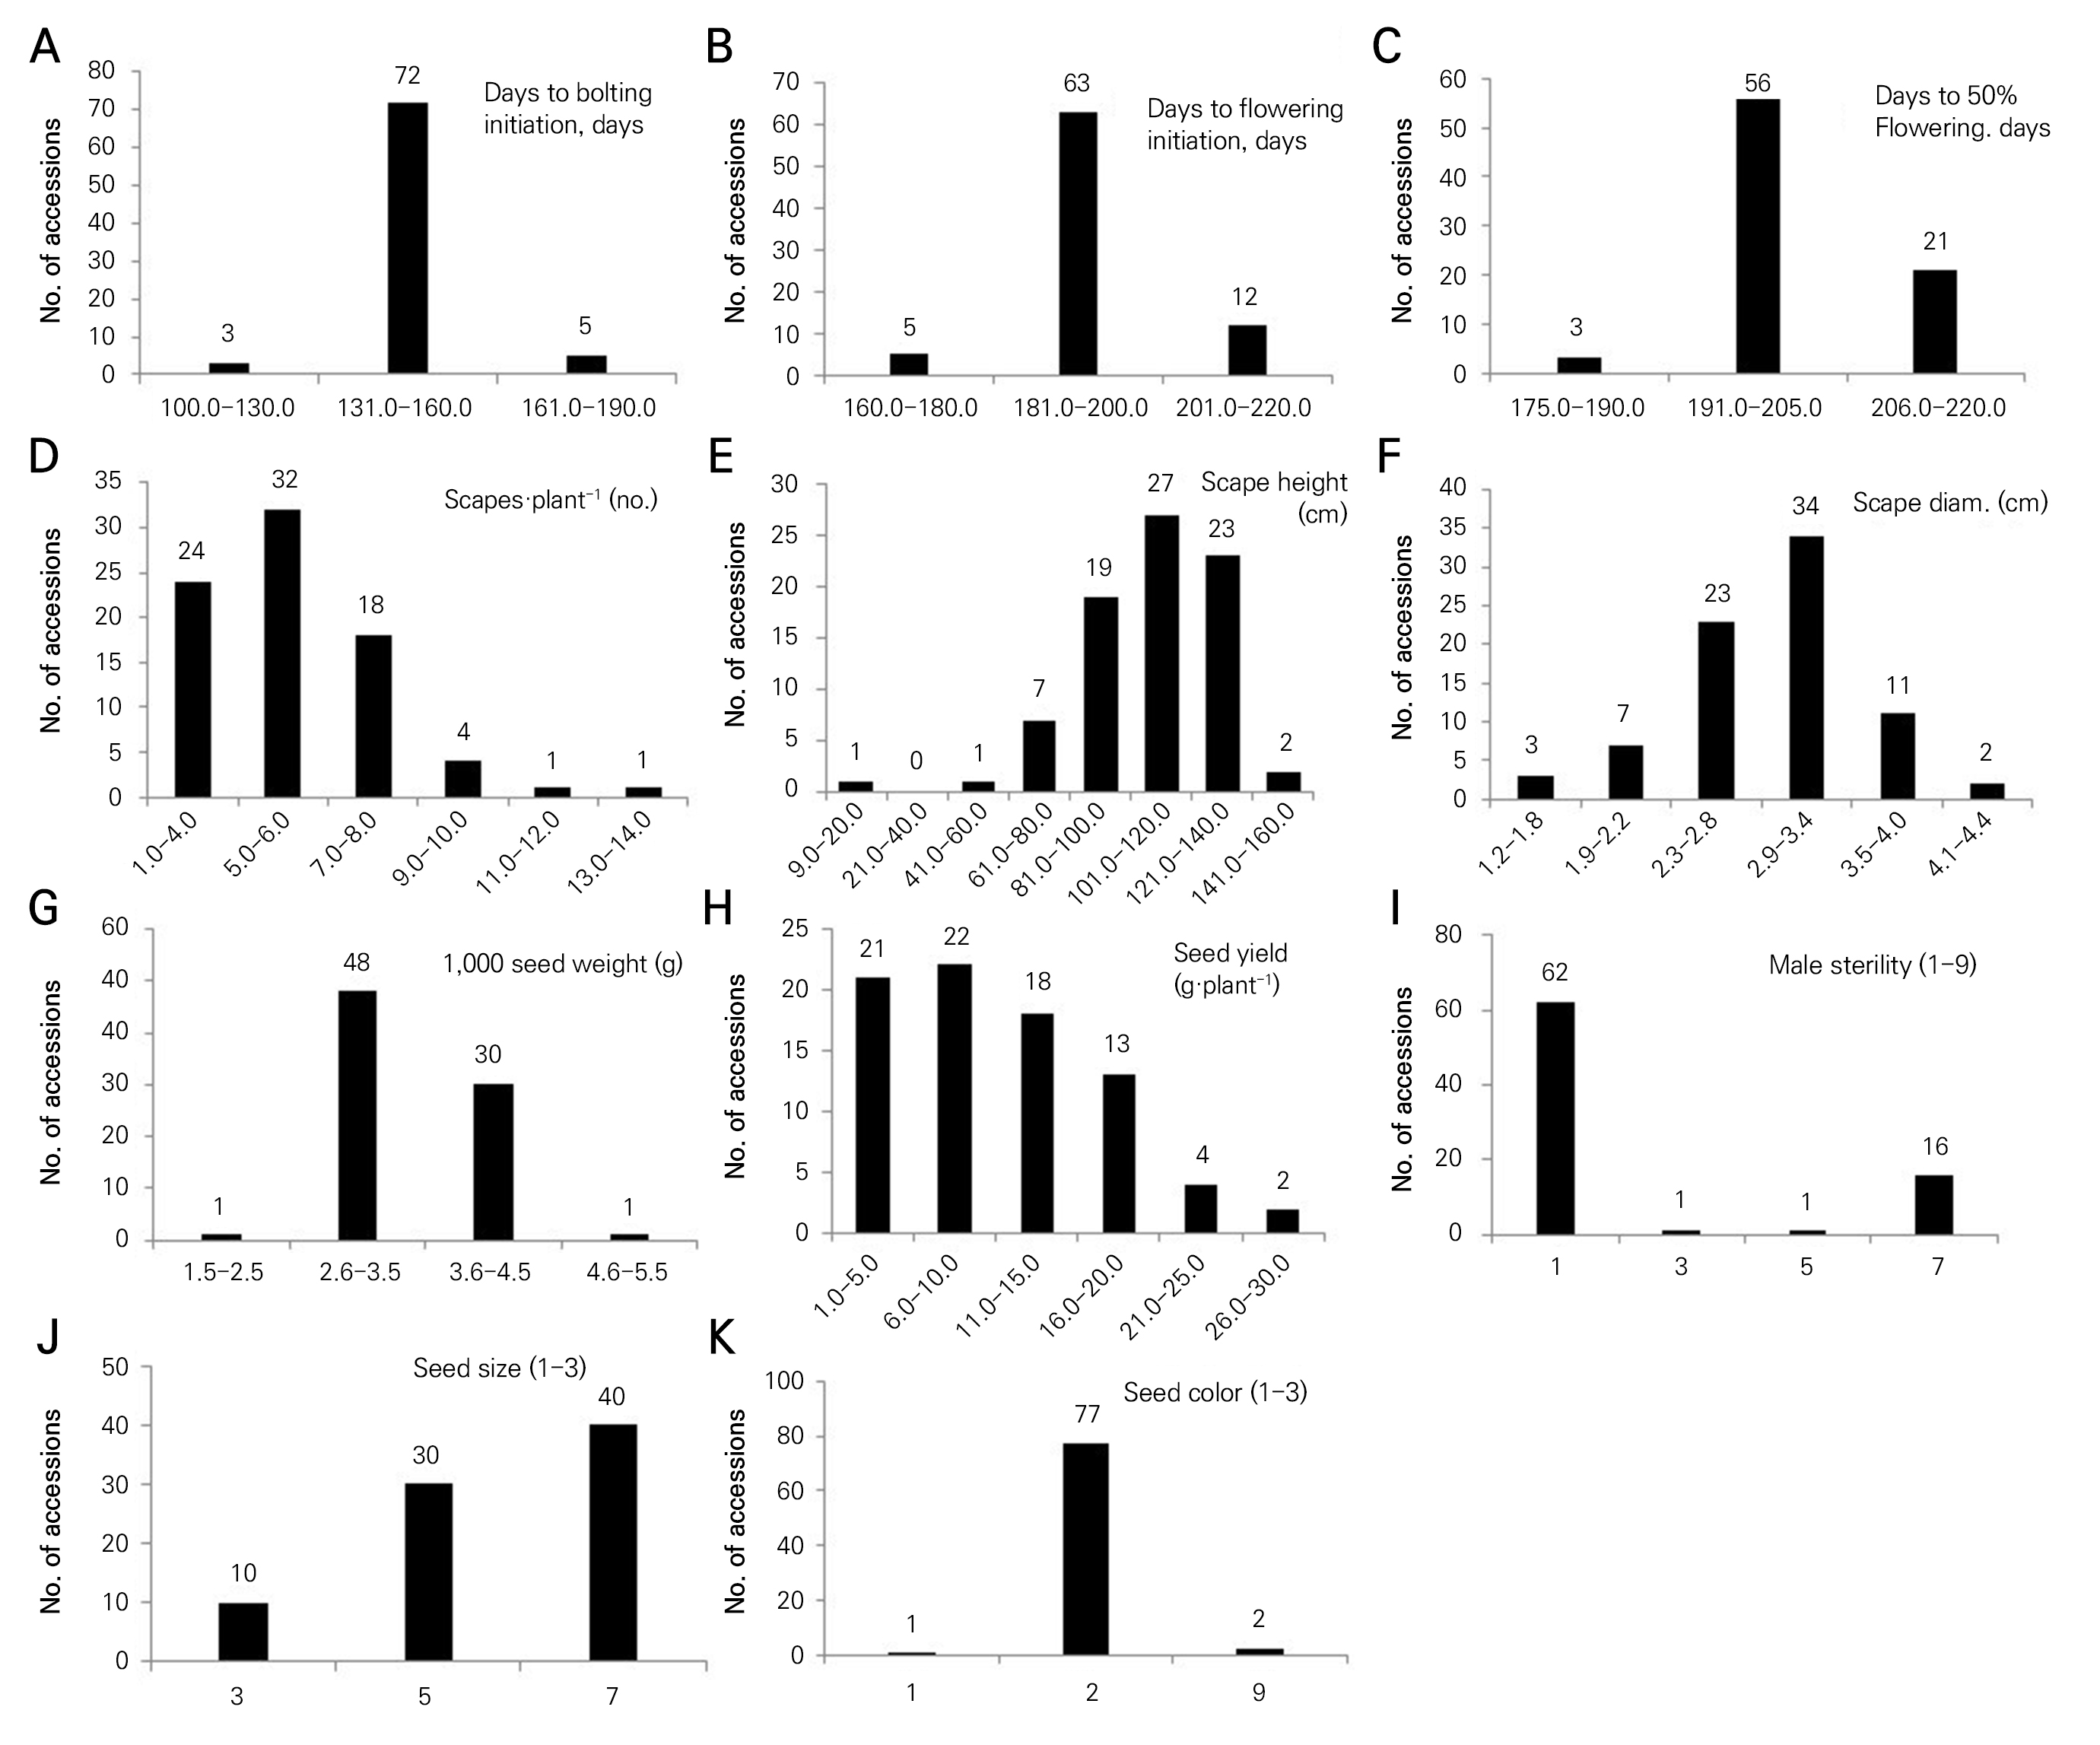
Fig. 1.
Frequency distribution of eleven phenotypic traits among 80 germplasms of onion. A: DBI (days to bolting initiation), B: DFI (days to flower initiation), C: DFF (days to 50% flowering), D: scapes·plant-1 (no.), E: scape height (cm), F: scape diameter (cm), G: 1,000 seed weight (g), H: seed yield (g·plant-1), I: male sterility (1‒9), 1: absent, 3: <10%, 5: 11‒49%, 7: >50%, and 9: 100%, J: seed size (3‒7), 3: small, 5: medium, 7: large, and 9: mix, K: seed color (1‒3), 1: brown, 2: black, 3: others, and 9: Mix.
Correlation among Phenotypic Traits
The Pearson’s correlation coefficients of the phenotypic traits are given in Table 2. The DBI revealed a highly significant positive correlation with the DFI (r = 0.58) and DFF (r = 0.50), but it showed a significant negative moderate correlation with the number of scapes·plant-1 (r = ‒0.42) and a low correlation with the seed yield (r = ‒0.28). The DFI showed a highly significant positive association with the DFF (r = 0.59) and had significant negative low correlations with the number of scapes·plant-1 (r = ‒0.26), male sterility (r = ‒0.29) and seed color (r = ‒0.33). The DFF showed a negative low correlation with the scape height (r = ‒0.28), TSW (r = ‒0.27), seed yield (r = ‒0.29), and seed size (r = ‒0.38). The number of scapes·plant-1 showed a significant positive correlation with the seed yield (r = 0.49). The scape height showed a significant positive moderate correlation with the scape diameter (r = 0.44), TSW (r = 0.37) and seed yield (r = 0.54). In contrast, the scape diameter showed a low correlation with the TSW (r = 0.33), seed yield (r = 0.26) and seed size (r = 0.25). Likewise, the seed yield showed a low correlation with male sterility (r = 0.35) and the seed size (r = 0.26). The TSW exhibited a significant moderate positive correlation with the seed yield (r = 0.36) and seed size (r = 0.58), and the seed yield was positively correlated with the seed size (r = 0.41). A phenotypic association between both the number of scapes·plant-1, and the scape diameter and the seed yield·plant-1 was found (Dadlani and Bhagchandani,1988; Mohanty et al., 2000; Aklilu et al., 2001). The results of the present study showed a positive association between the scape diameter and TSW, consistent with the findings of Mohanty et al. (2000). In general, the number of scapes·plant-1 depends on the plant genotype. However, the plant density can also contribute to the number of scapes·plant-1 as well (Dadlani and Bhagchandani, 1988). Karak and Hazra (2020) reported that the number of scapes·plant-1 and TSW showed a positive correlation with the seed yield, and the present study showed a significant positive association between the number of scapes·plant-1 and the seed yield. Knowledge of trait correlations is important for the indirect selections aimed to improve the seed yield (Ofga, 2019). The number of scapes·plant-1 is a fundamental trait for seed production, showing a positive correlation with the seed yield. Tesfaye et al. (2018) reported similar findings. Interestingly, this study found a significant positive correlation between the scape height and the seed yield·plant-1. Accordingly, genotypes with short scape heights produced lower seed yields and vice versa. The scape height may be related to the level of inbreeding; i.e. shorter scapes result from inbreeding and may produce fewer seeds. On the other hand, the tallest scape height may have provided more photoassimilates to the plant causing a greater seed yield·plant-1 value compared to that of the shortest scape. A significant correlation between the scape height and seed yield in onions has also been reported (Villanueva-Mosqueda, 2001; Tesfaye et al., 2018).
Table 2.
Correlation coefficients of eleven phenotypic traits among 80 onion germplasms evaluated at Muan-Gun, Jeollanam-Do, Korea, in 2021‒2022
| Traits | DBI | DFI | DFF | SN | SH | SD | TSW | SYL | MS | SS | SC |
| DBI | 1.0 | 0.58** | 0.50** | ‒0.42** | ‒0.08 | 0.20 | ‒0.01 | ‒0.28** | ‒0.24* | ‒0.01 | ‒0.23* |
| DFI | 1.0 | 0.59** | ‒0.26* | ‒0.16 | 0.16 | ‒0.07 | ‒0.18 | ‒0.29* | ‒0.21 | ‒0.33** | |
| DFF | 1.0 | ‒0.21 | ‒0.28* | ‒0.17 | ‒0.27* | ‒0.29** | ‒0.10 | ‒0.38** | ‒0.11 | ||
| SN | 1.0 | 0.03 | 0.18 | ‒0.01 | 0.49** | 0.12 | 0.10 | 0.08 | |||
| SH | 1.0 | 0.44** | 0.37** | 0.54** | 0.11 | 0.26* | 0.10 | ||||
| SD | 1.0 | 0.33** | 0.26** | ‒0.01 | 0.25* | ‒0.09 | |||||
| TSW | 1.0 | 0.36* | ‒0.13 | 0.58** | 0.01 | ||||||
| SYL | 1.0 | 0.09 | 0.41** | 0.02 | |||||||
| MI | 1.0 | ‒0.06 | 0.18 | ||||||||
| SS | 1.0 | 0.02 | |||||||||
| SC | 1.0 |
*p < 0.05, **p < 0.01, DBI: day to bolting initiation, DFI: days to flowering initiation, DFF: days to 50% flowering, SN: scape·plant-1 (no.), SH: scape height (cm), SD: scape diameter (cm), TSW: thousand seed weight (g), and SYL: seed yield (g·plant-1). MS: male sterility (1‒9), 1: absent, 3: <10%, 5: 11‒49%, 7: >50%, and 9: 100%. SS: seed size (3‒7), 3: small, 5: medium, 7: large, and 9: mix. SC: seed color (1‒3), 1: brown, 2: black, 3: others, and 9: mix.
Cluster Analysis
The dendrogram showed that 80 germplasms were classified into four clusters; these were clusters 1, 2, 3, and 4, with 22, 50, six and two accessions, respectively (Fig. 2). The number of accessions in each cluster and their morphological characteristics are presented in Suppl. Table 2. Cluster 1 was divided into two subgroups. The closest accessions of this cluster were IT121600 and K166294, whereas IT200522 and K166281 were the most distant accessions. Likewise, cluster 2 was also further divided into two subgroups, and IT121547 and IT121728 were the distant accessions. The closest accessions in this cluster were IT121614 and IT121661. Similarly, cluster 3 consisted of two subgroups, and IT121613 and IT121630 were the closest accessions. Cluster 4 consisted of two accessions (IT172965 and K168154). A hierarchical cluster analysis deals with a number of different algorithms and methods for grouping samples of a similar type into respective clusters. A cluster analysis helps to group accessions into different clusters (Sunil et al., 2014). Rafieipour et al. (2011) classified onion accessions into three clusters based on the seed yield and yield-related traits using the Ward method. However, Arya et al. (2017) reported four clusters from 26 accessions using qualitative and quantitative traits. In this study, clusters are formed irrespective of the origin of the accessions. However, most accessions from the United Kingdom, Central Asia and Georgia are grouped in cluster 2. The geographical origin of accessions may also contribute to the formation of clusters to some extent, but this study reported different clusters based on phenotypic traits, in agreement with earlier findings (Arya et al., 2017; Dangi et al., 2018; Manjunathagowda, 2022). Sunil et al. (2014) classified 23 diverse onion germplasms into four clusters, among which cluster 3 had the largest accessions.
Descriptive statistics pertaining to the morphological traits in the four clusters are presented in Table 3. Cluster 4 accessions were characterized by early bolting (130.0 days), flowering (183.0), and DFF (196.0 days). Out of four, cluster 3 showed delayed bolting (163.0 days), delayed flowering (208.0 days), 50% flowering (221.0 days) and the shortest scape height (75.8 cm). Cluster 2 accessions showed a higher average seed yield (12.8 g·plant-1) than those in clusters 1, 3 and 4. Hence, this group is important when selecting accessions with high seed yields.

Fig. 2.
Dendrogram showing the four main clusters identified after a similarity analysis. The dendrogram includes all 80 onion accessions and the eleven phenotypic traits used for a hierarchical cluster analysis showing their genetic relationship (Linkage method: Complete, scale: Euclidean distance).
Table 3.
Means and standard deviations of measured traits in four clusters of onion germplasms evaluated at Muan-Gun, Jeollanam-Do, Korea, in 2021‒2022
| Traits | Cluster 1 | Cluster 2 | Cluster 3 | Cluster 4 | |||||||
| Mean | SDz | Mean | SDz | Mean | SD | Mean | SD | ||||
| ny | 22 | 50 | 6 | 2 | |||||||
| Days to bolting initiation (DBI) | 147.0 | 9.8 | 148.0 | 7.2 | 163.0 | 6.6 | 130.0 | 24.0 | |||
| Days to flowering initiation (DFI) | 192.0 | 6.7 | 192.0 | 6.7 | 208.0 | 3.7 | 183.0 | 13.4 | |||
| Days to 50% flowering (DFF) | 200.0 | 5.3 | 201.0 | 5.8 | 221.0 | 7.3 | 196.0 | 10.6 | |||
| Scape·plant-1 (no.) | 5.0 | 3.2 | 6.0 | 1.7 | 4.0 | 2.6 | 7.0 | 3.5 | |||
| Scape height (cm) | 101.3 | 18.1 | 112.3 | 22.5 | 75.8 | 11.8 | 122.1 | 16.4 | |||
| Scape diameter (cm) | 2.8 | 0.6 | 2.9 | 0.5 | 2.4 | 0.6 | 2.6 | 1.3 | |||
| 1,000 seed weight (g) | 3.4 | 0.4 | 3.5 | 0.5 | 2.8 | 0.4 | 3.5 | 0.7 | |||
| Seed yield (g·plant-1) | 6.4 | 4.1 | 12.8 | 6.4 | 3.4 | 4.6 | 11.2 | 3.8 | |||
A summary of the frequency distribution of male sterility, seed size and seed color of the four clusters of onion germplasms is shown in Fig. 3. Cluster 2 contained the highest number of accessions (37) without sterile male plants, but it showed 12 accessions with more than 50% sterile male plants (Fig. 3A). Cluster 2 contained the highest number of accessions (28) with large-sized seeds, followed by 21 accessions (medium-sized seeds; Fig. 3B). Similarly, the highest number of accessions (49) in cluster 2 had black-colored seeds, followed by the cluster 1 accessions (22). Cluster 4 accessions showed a mixed seed color (Fig. 3C).
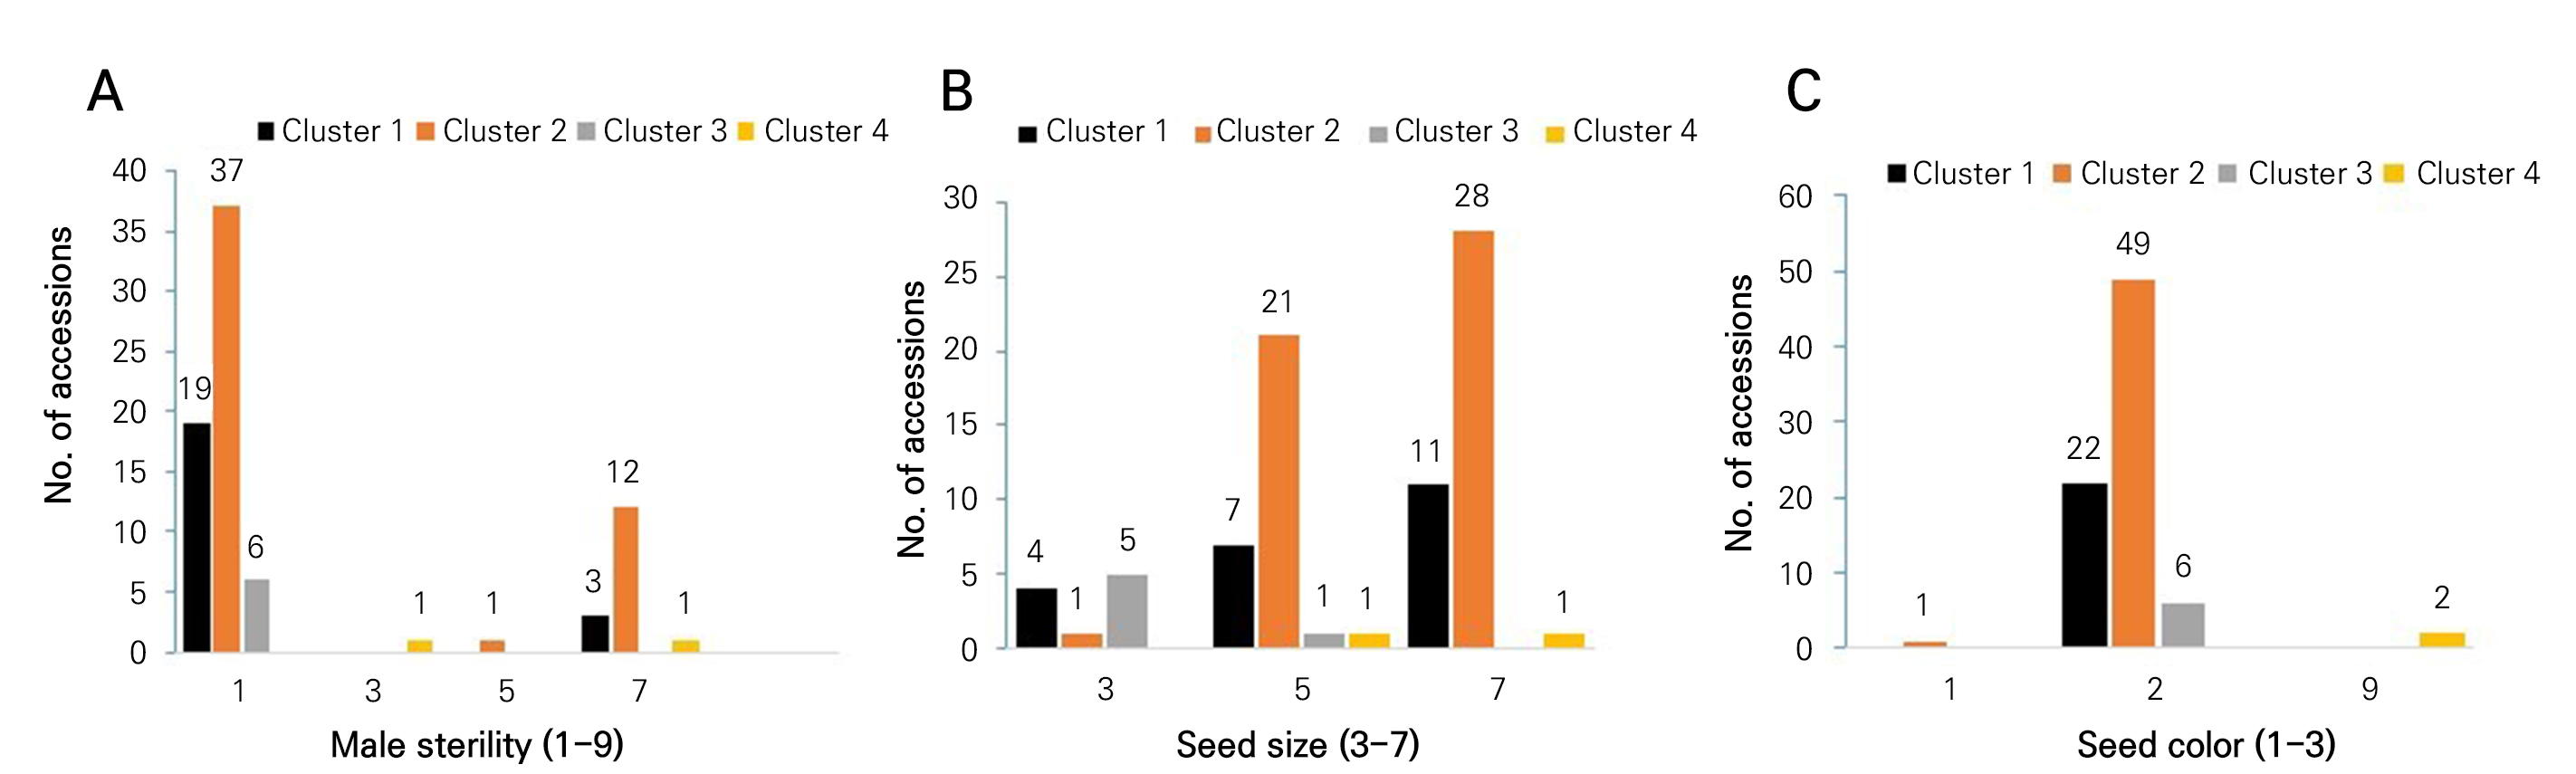
Fig. 3.
Frequency distributions of male sterility (A), seed size (B) and seed color (C) in four clusters of germplasms. Male sterility (1‒9), 1: absent, 3: <10%, 5, 11‒49%, 7: >50%, and 9: 100%. Seed size (3‒7), 3: small, 5: medium, 7: large, and 9: mix. Seed color (1‒3), 1: brown, 2: black, 3: others, and 9: mix.
Principal Component Analysis
The PCA results showed that the first five PCs accounted for 75.82% of the total variation (Table 4). PC1 accounted for 28.53% of the total variation, which consisted of the DFF measure (‒0.42) and the seed yield (0.39), DFI (‒0.36), seed size (0.33), scape height (0.33), and DBI (‒0.33), as the major traits. PC2 explained 19.94% of the total phenotypic variance and was positively associated with the scape diameter (0.46), DBI (0.40), TSW (0.38) and DFI (33.0). PC3 explained 10.29% of the total variance and was related to male sterility (0.59), and the scape height (0.38), seed color (0.37), scape diameter (0.34) and the number of scapes·plant-1 (‒0.30). PC4 and PC5 explained 9.48% and 7.58% of the total variance, respectively. The number of scapes·plant-1 (0.54), the seed yield (0.47), the seed color (‒0.40) and the DFI measure (0.32) all contributed to PC4, whereas the seed color (0.70) and DFF (0.45) were accounted for in PC5. PCA has been used to explore morphological variations and relationship among Allium spp., and to identify major traits influencing grouping of samples based on eigenvalues (Fitriana and Susandarini, 2019). PCA explains the importance of the highest contributor to the total variation at each axis of differentiation (Sharma, 1998). Dangi et al. (2018) reported that the first five PCs accounted for 78.50% of the total variation, similar to our results. In contrast, Singh et al. (2013) found that three PCs together explained 71.03% of the total variation in onion germplasms. Nine PCs with eigenvalues higher than one contributed 71.84% to the total variability among 96 Turkish onion accessions (Hanci and Gokce, 2015).
Table 4.
Eigenvector and eigenvalues generated by PCA applied to eleven morphological characteristics of 80 onion accessions evaluated at Muan-Gun, Jeollanam-Do, Korea, in 2021‒2022
DBI, DFI and DFF showed negative correlations, and the seed yield, scape height and seed size revealed positive correlations, and were the most strongly contributing traits in PC1, whereas the scape diameter, male sterility and seed color contributed the least in PC1. A scatter plot and the configuration of the 80 onion germplasms in PCA are shown in Fig. 4. In PCA, owing to the high contributions of a few traits, the accessions are grouped into four clusters. Accessions 53 (IT200522) and 68 (K168154) were the most prominent accessions contributing to PCA. Accessions clustered together show some degree of similarity. However, a few accessions in cluster 2 were more diverse due to the differences in the number of scapes·plant-1, and in the scape height, and seed yield·plant-1. Accessions 9 (IT121613), 12 (IT121624), 13 (IT121630), 15 (IT121659), 24 (IT121731) and 29 (IT136008) were grouped into cluster 3, which showed the highest values for DBI, DFI, and DFF and the lowest values for the scape height (Suppl. Table 2). The diversity found in the accessions may be due to their distinct origin and considerable variation, particularly in terms of DBI, DFI, DFF, the scape diameter, the scape height, the number of scapes·plant-1, male sterility, and the seed size.
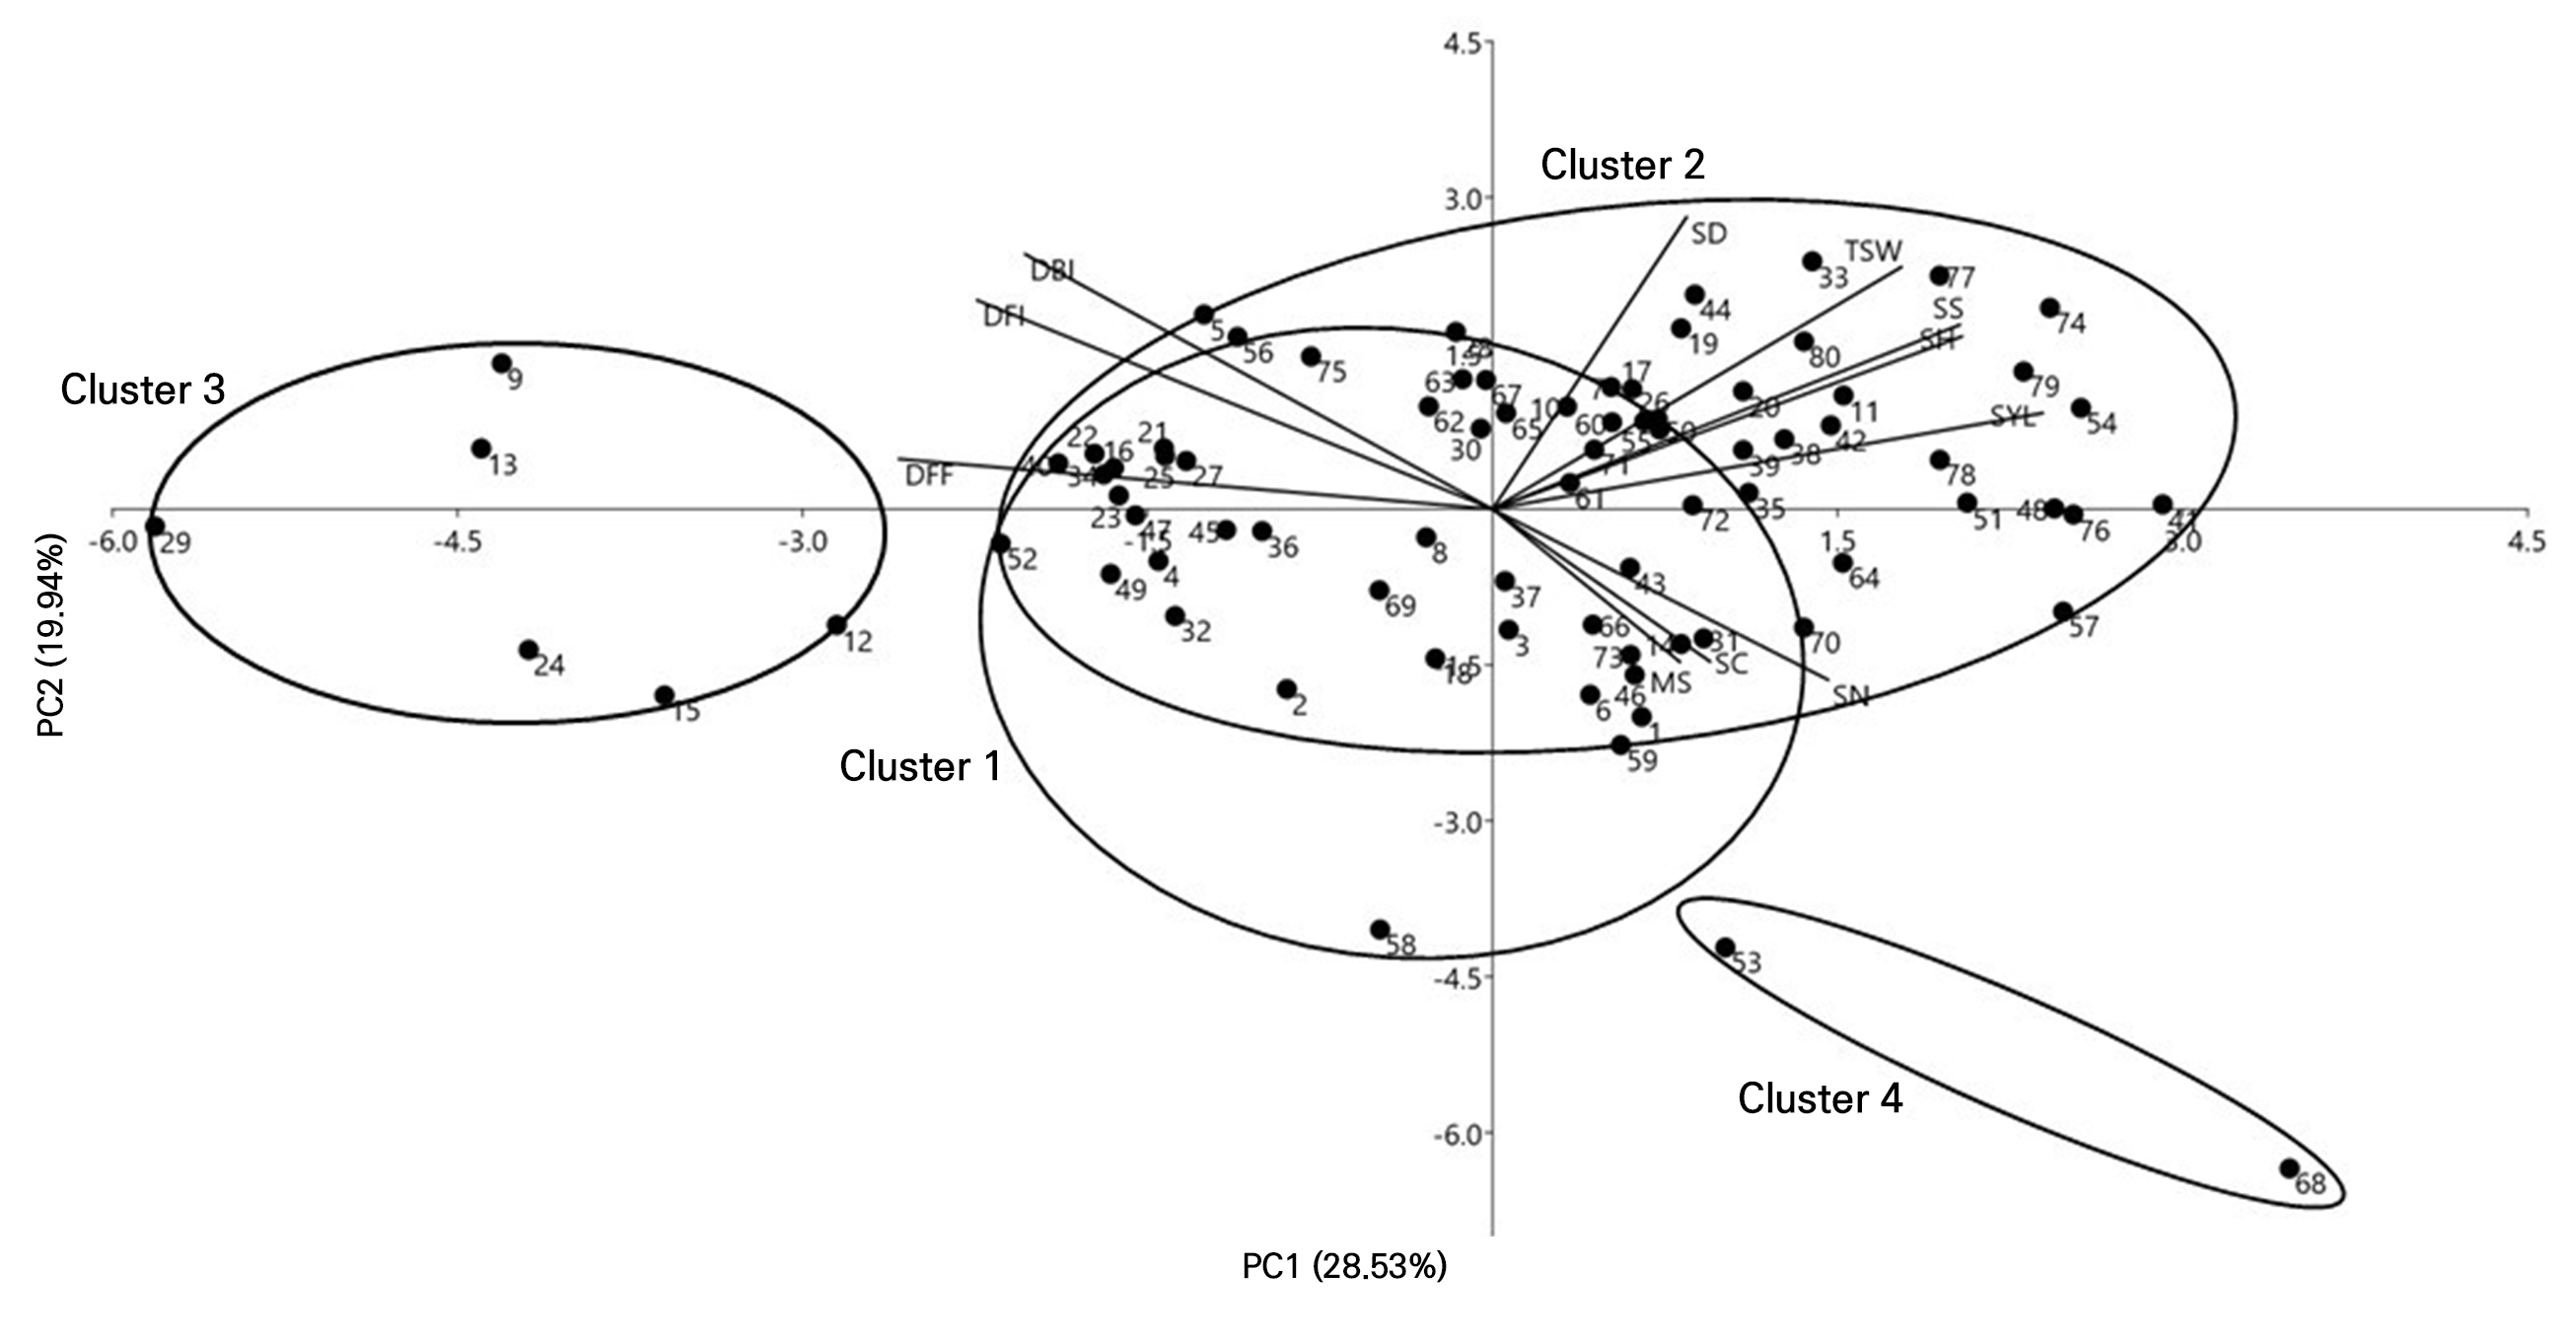
Fig. 4.
Principal component analysis biplot showing onion germplasms clustering based on eleven morphological traits DBI: days to bolting initiation, DFI: days to flowering; DFF: days to 50% flowering, SN: Scapes·plant-1 (no.), SH: Scape height (cm), SD; scape diameter, TSW: 1,000 seed weight, SYL: seed yield (g·plant-1), MS: male sterility, SS: seed size, and SC: seed color. The accession names are listed in Supplementary Table 1.
In conclusion, broad variations in certain phenotypic traits, in this case DBI, the number of scapes·plant-1, the scape height and diameter, and the seed yield were observed among 80 onion germplasms. The correlation of the number of scapes·plant-1 and the scape height with the seed yield may provide information with which to realize more efficient breeding programs. Furthermore, accessions containing sterile male plants can be useful to develop sterile male lines for hybrid seed production. The cluster analysis conducted here grouped 80 accessions into four clusters, denoted as clusters; 1, 2, 3 and 4. Cluster 2 contained the highest number of accessions and showed a higher seed yield than those of clusters 1, 3 and 4. Clusters 2 and 1 had the highest number of accessions (12 and 1, respectively) and included more than 50% sterile male plants. The PCA found that the DFF, seed yield, DFI, scape height, and DBI factors were the main contributors to PC1, whereas the scape diameter, DBI, TSW and DFI contributed most to PC2. This morphological characterization of germplasms will help breeders as they select potential lines for seed production and in their efforts to realize greater variety development of onion crops.
Supplementary Material
Supplementary materials are available at Horticultural Science and Technology website (https://www.hst-j.org).
- HORT_20240006_Table_1s.pdf
Onion germplasms, code and their origins used for seed yield and seed yield traits characterization at Muan, Jeollanam-Do, Korea, in 2021–2022
- HORT_20240006_Table_2s.pdf
Seed yield and related traits measured in 80 onion germplasms at Muan-Gun, Jeollanam-Do, Korea, in 2021–2022
