

서 언
재료 및 방법
실험 기간 및 장소
광합성 매개변수 측정
엽록소 형광 반응 측정(Origin Jump Intermediate Peak, OJIP)
엽록소 측정
통계분석
결과 및 고찰
환경데이터
광합성 매개변수
엽록소 형광반응(Origin Jump Intermediate Peak, OJIP)
엽록소 함량
상관관계
주성분 분석(Principal Component Analysis, PCA)
결 론
서 언
토마토(Lycopersicon esculentum Mill.)는 라이코펜 및 다양한 항산화 화합물이 함유된 과채류로, 전세계에서 5,167,090ha의 재배면적과, 180,133,955톤의 생산량에 이르는 중요한 과채류 중 하나이다(FAO 2021). 우리나라의 시설재배 면적은 6,111ha, 생산량은 378,808톤(KOSIS 2022)으로 생산액이 높은 과채류 중 하나이다. 스마트 팜의 보급으로 토마토의 생산량이 증대되었으며, 스마트 팜에서의 재배는 주로 8−9월에 정식해 이듬해 6월까지 수확하는 장기 재배 형태로 이루어 진다(RDA 2018).
토마토의 생산량과 과실의 품질은 재배 환경의 영향에 의해 좌우되는데, 특히 고온과 저온 스트레스에 민감하게 반응한다. 따라서 토마토는 기본적인 기상 환경 요구 사항이 충족되지 않은 지역에서는 온실 재배 시 추가적인 보완 설비가 필요하다(Shamshiri et al. 2018). 이처럼 온도는 토마토의 생육과 발달에 큰 영향을 미치며(Van Ploeg and Heuvelink 2005), 온도를 적절하게 조절하면 습도 및 주변 CO2 농도에 영향을 주어 토마토의 생산량을 높이고 배꼽썩음병 등을 예방할 수 있다(Dorai et al. 2001; Haghighi et al. 2014). 또한 온도는 토마토의 개화 및 과실 생육에 영향을 주고(Peet and Welles 2005), 정식 후 저온 및 저 일조는 초기 생육과 광합성 능력이 감소시킨다(Theocharis et al. 2012; Wi et al. 2021). 저온 스트레스는 토마토의 과실 품질에 악영향을 미치는데, 특히 라이코펜, α−토코페롤 및 β−카로틴 함량이 감소한다(Adams et al. 2001; Meena et al. 2018). 토마토의 착과 온도 범위는 좁고, 특히 야간 온도가 중요하게 작용하는데, 이때의 최적 야간 온도 범위는 15−20°C이다(Boote et al. 2012; Ruiz-Nieves et al. 2021). 온도는 토마토의 광합성 능력에도 상당한 영향을 미치며, 광량이 높아도 온도가 낮으면 RuBP와 RuBisCO 활성화가 저하되어 CO2 고정이 급격하게 감소한다(Byrd et al. 1995). 또한, 저조도에서 토마토 잎의 광합성은 감소되는데 이는 주로 광화학적 반응 중 명반응과 관련된 광합성 시스템II(Photosystem II, 광계 II)에서 발생한다(Meng et al. 2017).
다양한 환경 요인에 의하여 비생물학적 스트레스가 야기되는데(Nicky and Urwin 2012; Zhu 2016), 이러한 비생물학적 스트레스를 확인하기 위해 광합성 속도(Yang et al. 2022; Kim et al. 2023), 기공 전도도, 증산율(Kwon et al. 2022), 엽록소 형광반응(Strasser et al. 2000; Lee et al. 2022) 및 엽록소 분석 등을 이용한다. 특히 엽록소 형광은 광합성의 명반응 과정에서 일어나는 광생리학적 반응을 통해 식물 스트레스를 진단하는 비파괴적 방법으로 다양한 환경 조건에서 작물 생장의 특이적인 반응을 분석하여 생장 스트레스 정도를 분석한다(Zushi and Matsuzoe 2017; Bussotti et al. 2020; Choi 2021). 엽록소 형광반응 분석(Origin Jump Intermediate Peak, OJIP)은 광계 II의 반응을 분석하는데 적합하고, 매개변수로는 ABS/RC, TRO/ RC, ETO/RC, DIO/RC, FV/FM 등이 주로 이용된다(Maxwell and Johnson 2000). 특히, 광계 II의 최대 양자 효율을 나타내는 FV/FM 값은 광합성 성능의 민감한 지표로 이용되며(Maxwell and Johnson 2000; Kalaji and Guo 2008; Roh and Yoo 2023), FV/FM 값이 0.8보다 낮을 때는 반응 중심이 손상을 입은 상태이거나 비가역적인 불활성상태라 판단하고 스트레스 상태를 진단할 수 있다(Akram et al. 2006; Oh et al. 2009). 또한 엽록소 형광 분석은 온실에서 재배되는 토마토의 열 스트레스에 대한 반응을 진단할 수 있는 지표로서 이용할 수 있다(Willits and Peet 2001).
온실에서 재배되는 토마토의 광합성에 대한 연구가 다수 보고되는데, 특히 Trouwborst et al.(2011)는 온실 내 생육 중인 토마토 수관 특징에 따른 광도와 엽령이 광합성률에 미치는 영향을 연구하였고, Yang et al.(2018)은 다양한 LED 광 파장에 따른 토마토 잎의 광합성 능력에 대한 연구를 보고하였다. 또한, 겨울과 봄철 온실 토마토의 일일 광합성률 변화와 같은 연구도 보고된 바 있다(Ayari et al. 2000). 국내에서는 토마토의 엽위별 광합성 특성을 조사하고, 이를 엽령 및 개화 속도와 비교 분석한 연구가 보고 된다(Kim et al. 2013). 그러나 국내의 사계절이 뚜렷한 온실 환경에서 토마토의 엽위별(상 ․ 중 ․ 하) 광합성률, 엽록소 형광 및 엽록소 함량에 대한 연구는 미흡한 실정이다. 토마토의 생육과 수확량은 외부 광량과 밀접한 관계인만큼, 특히 겨울철 온실에서 광이 제한적인 상황을 고려할 때, 광합성 효율을 최적화하기 위한 연구는 중요하다. 이러한 최적 광효율 연구를 통하여 재배적인 측면에서 토마토의 적정한 적엽관리에 대한 자료를 제시할 수 있을 것이다. 앞서 보고되었던 연구들(Ayari et al. 2000; Trouwborst et al. 2011; Kim et al. 2013)을 토대로 유추해보면 온실 내에서 재배되는 토마토의 광합성 관련 생리적 특성이 상 ․ 중 ․ 하의 착엽 위치와 환경에 따라 변화하는 것을 알 수 있다. 특히 한국의 토마토 재배를 시기적 특성으로 볼 때, 9월, 11월, 그리고 1월은 각각 여름, 가을, 그리고 겨울의 특징을 갖는 계절로, 이 시기별로 측정되는 광합성률, 엽록소 형광, 엽록소 함량이 상위엽에서 하위엽으로 갈수록 감소할 것을 예상할 수 있다. 또한, 1월은 9월에 비해 저온의 온실 환경이므로 광합성률 등 매개변수의 특성이 감소하는 경향을 나타낼 것으로 예상된다. 따라서 본 연구에서는 온실 내에서 재배되는 토마토의 온실 환경 변화에 따른 엽위별 광합성률, 엽록소 형광 및 엽록소 함량 등의 광합성 생리와 관련된 요소들 간의 상관관계 및 주성분분석(Principal Component Analysis, PCA)을 통해 토마토의 계절별 광생리적 변화 패턴을 분석하고자 한다. 또한 이러한 광생리적 패턴 정보를 스마트팜 토마토 재배 시 효율적인 환경 관리를 위한 기초 자료로 제공하고자 한다.
재료 및 방법
실험 기간 및 장소
본 실험 장소는 충청남도 논산시(36.269°N, 127.089°E)에 위치한 벤로형 유리온실에서 유럽종인 완숙 토마토 ‘레드250’ 품종을 이용하여 수행하였다. 3구 암면 배지경 수경재배 시스템에 2021년 8월 25일에 토마토를 정식하였다. 상기 유리 온실에 정식된 토마토 식물체를 난괴법 3반복으로 설정하여 각 반복당 3주씩 광생리적 특성을 측정하였다. 온실 내 환경 조절을 위한 환경제어 프로그램인 프리바(Priva, De Lier, the Nederlands)를 이용하였다. 환경 수집 데이터는 1일당 누적 광량(mmol·m-2·s-1·d-1), 월별 광량 분포(mmol·m-2), 온도(°C), 상대습도(%) 및 CO2 농도(ppm)로 2021년 8월 1일부터 2022년 1월 31일까지 1시간마다 측정하여 수집하였다(Fig. 1). 토마토 엽위별 온도와 광도를 측정하기 위해, 온도는 적외선 온도계(830–T4, Testo, Titisee–Neustadt, Germany)를 사용하였으며, 광도는 휴대용 광 스펙트럼 분석기(LM-500H, Photon Systems Instruments, Drásov, Czech Republic)로 측정하였다. 엽은 상 ․ 중 ․ 하위엽으로 나누었으며, 상위엽은 완전히 전개된 엽을 포함하여 생장점에서부터 아래로 1–5번째 엽을, 중위엽은 6–10번째 엽을, 하위엽은 11–15번째 이내의 엽에서 측정하였다. 9월의 평균 엽수는 17.3엽이었고, 생장점에서부터 아래로 5, 10, 15엽에서 측정하였다. 11월의 평균 엽수는 16.3엽이었으며 4, 9, 14엽에서 측정하였다. 또한, 1월의 평균 엽수는 15.3엽이었고 3, 8, 13번째 엽에서 측정하였다
광합성 매개변수 측정
계절에 따른 온실의 환경 변화에 의한 토마토 엽위별 광합성 매개변수를 분석하기 위해 휴대용 광합성 측정기(LI–6800, LI–COR, Lincoin, NE, USA)를 사용하였다. 2021년 9월부터 2022년 1월까지 매월 광합성 측정을 하였으며, 이 중에서 9월, 11월, 1월을 선택하여 2021년 9월 23–24일, 11월 16–17일, 2022년 1월 20일–21일 맑은 날 오전 7시–13시까지 상 ․ 중 ․ 하위엽에서 각각 3개체씩 3반복으로 측정하였다.
광합성 측정 시 LI–6800 챔버의 환경조건은 온도는 25°C, 상대습도는 50%, CO2 농도는 400ppm, 유입되는 공기 유량은 700µmol·mol-1, 믹싱팬의 속도는 10,000rpm, 순광합성 능력은 광자속밀도(Photosynethetic photon flux density, PPFD)를 0, 100, 200, 400, 600, 800, 1,000, 1,200µmol·m-2·s-1의 범위에서 높은 값에서 낮은 순으로 광도의 변화를 주어 측정하였다. 온실에서 광도 변화에 따른 측정값을 이용하여 광합성 효율(Photosynthesis rate, A), 기공전도도(Stomatal conductance, gs), 증산율(Transpiration rate, E)을 분석하였다.
엽록소 형광 반응 측정(Origin Jump Intermediate Peak, OJIP)
엽위별 엽록소 형광분석은 휴대용 엽록소 형광측정기(FP-100, Photon Systems Instruments, Drásov, Czech Republic)를 이용하였다. 광합성을 측정한 위치와 같은 엽에 휴대용 암 클립을 부착하여 20분간 암적응을 시킨 후, 697–750nm의 적색광을 1,000µmol·m-2·s-1의 광량으로 1초간 조사하여 OJIP를 측정하였다. 데이터 수집은 발광이 시작된 후 1초 동안 50µs부터 시작하여 최대 강도까지 측정되어 FluorPen 소프트웨어를 거쳐 엑셀 변환 값을 사용하였다.
엽록소 형광 반응에 이용된 OJIP tansient 분석으로 FO는 모든 광계 II(PSII) 반응 중심이 열렸을 때의 최소 형광(2ms)을 나타낸다. FJ는 J단계(2ms)에서 형광 강도를 나타내고, FI는 I단계(30ms)에서 형광 강도를 의미한다. FM(FP)는 모든 광계 II의 반응 중심이 닫혔을 때 최대 형광이며, FV/FM 값은 광계 II 광화학 반응의 추정된 최대 양자 효율(수율)을 나타낸다. ABS/RC는 광계 II 반응 중심 당 평균 흡수된 광자 플럭스를 나타내고, TRO/RC는 광계 II당 최대 포획된 에너지 플럭스를 나타낸다. ETO/RC는 광계 II 반응 중심당 QA에서 QB로의 전자 수송 플럭스 속도를 나타내고, DIO/RC는 시간이 0일때 반응센터 당 열 방출을 나타낸다(Strasser et al. 2000).
엽록소 측정
광합성 측정 및 엽록소 형광을 측정한 동일한 잎을 개체당 3반복으로 엽록소 a, 엽록소 b, 엽록소 a+b, 카로티노이드의 함량을 측정하였다. 상·중·하위엽에서 채취한 잎은 건조기(KCO–150, Kukjee Eng. CO., Paju, Korea)에 넣어 70°C에서 24시간 건조시킨 후, 아세톤 용액에 넣어 24시간 경과 후 필터링하여 상층액을 UV–Vis 분광광도계(NEO–D317, Neogen, Daejeon, Korea)를 사용하여 661.6, 644.8과 470nm파장에서 흡광도를 측정하였고, 엽록소 및 카로티노이드 함량 확인은 Lichtenthaler and Buschmann(2001)의 산출식으로 계산하였다.
Chlorophyll a (µg·mL-1) = (11.24 × A661.6) − (2.04 × A644.8)
Chlorophyll b (µg·mL-1) = (20.13 × A644.8) − (4.19 × A661.6)
Carotenoids (µg·mL-1) = (1,000 × A470 − 1.90 × Chl a − 63.14 × Chl b) / 214
통계분석
통계분석은 SAS 9.4(SAS Institute Inc., NC, USA) 소프트웨어 프로그램을 이용하였고, OJIP 곡선으로부터 산출된 형광 변수와 광합성 매개변수의 분석은 ANOVA 분석을 하였으며, 95% 유의수준에서 Ducan의 다중검정방식을 이용하여 통계적 유의성을 확인하였다. 또한 주성분분석(PCA)은 R 프로그램(Ver. 4.1.2, Vienna, Austria)을 이용하였다.
결과 및 고찰
환경데이터
9월, 11월 및 1월의 온실 내 온도, 습도 및 이산화탄소 농도의 최저, 평균 및 최대값을 측정한 결과(Fig. 1 and Table 1), 9월, 11월, 1월의 평균온도는 각각 23.0, 17.8, 16.8°C로 9월에서 1월까지 계절이 변화함에 따라 6.2°C 감소하였다. 최고온도는 9월, 11월, 1월에 각각 28.9, 23.5, 22.7°C로 평균온도와 유사하게 6.2°C 감소하였다. 반면, 최저 온도는 각각 18.8, 15.0, 14.1°C로 1월에는 9월에 비해 4.7°C 감소하였다. 월별 온도의 변화는 Fig. 1C 상단에 작은 그림으로 나타내었다. 또한 온실의 9월, 11월, 1월의 온실 일간 최대 광량은 각각 24.82, 14.61과 14.28mmol·m-2·s-1·d-1(Fig. 1A)이며, 월별 외기 광도는 Fig. 1A 상단에 표시하였다. 월별 누적 광량은 9월, 11월 및 1월에 각각 566, 350, 351mmol·m-2으로 9월 대비 11월과 1월은 각각 62%의 수준으로 광량이 38% 감소하였다(Fig. 1B). 재배 기간동안 온실 내부의 상대 습도는 63.0%에서 92.9%까지 나타났고, 월별 습도는 Fig. 1D 하단에 그림으로 표시하였다. 온실의 CO2 농도는 345.2−539.8ppm을 나타냈고, 9월, 11월 그리고 1월의 순으로 CO2 농도가 높았고, 월별 CO2 농도는 Fig. 1E 상단에 함께 표시하였다.
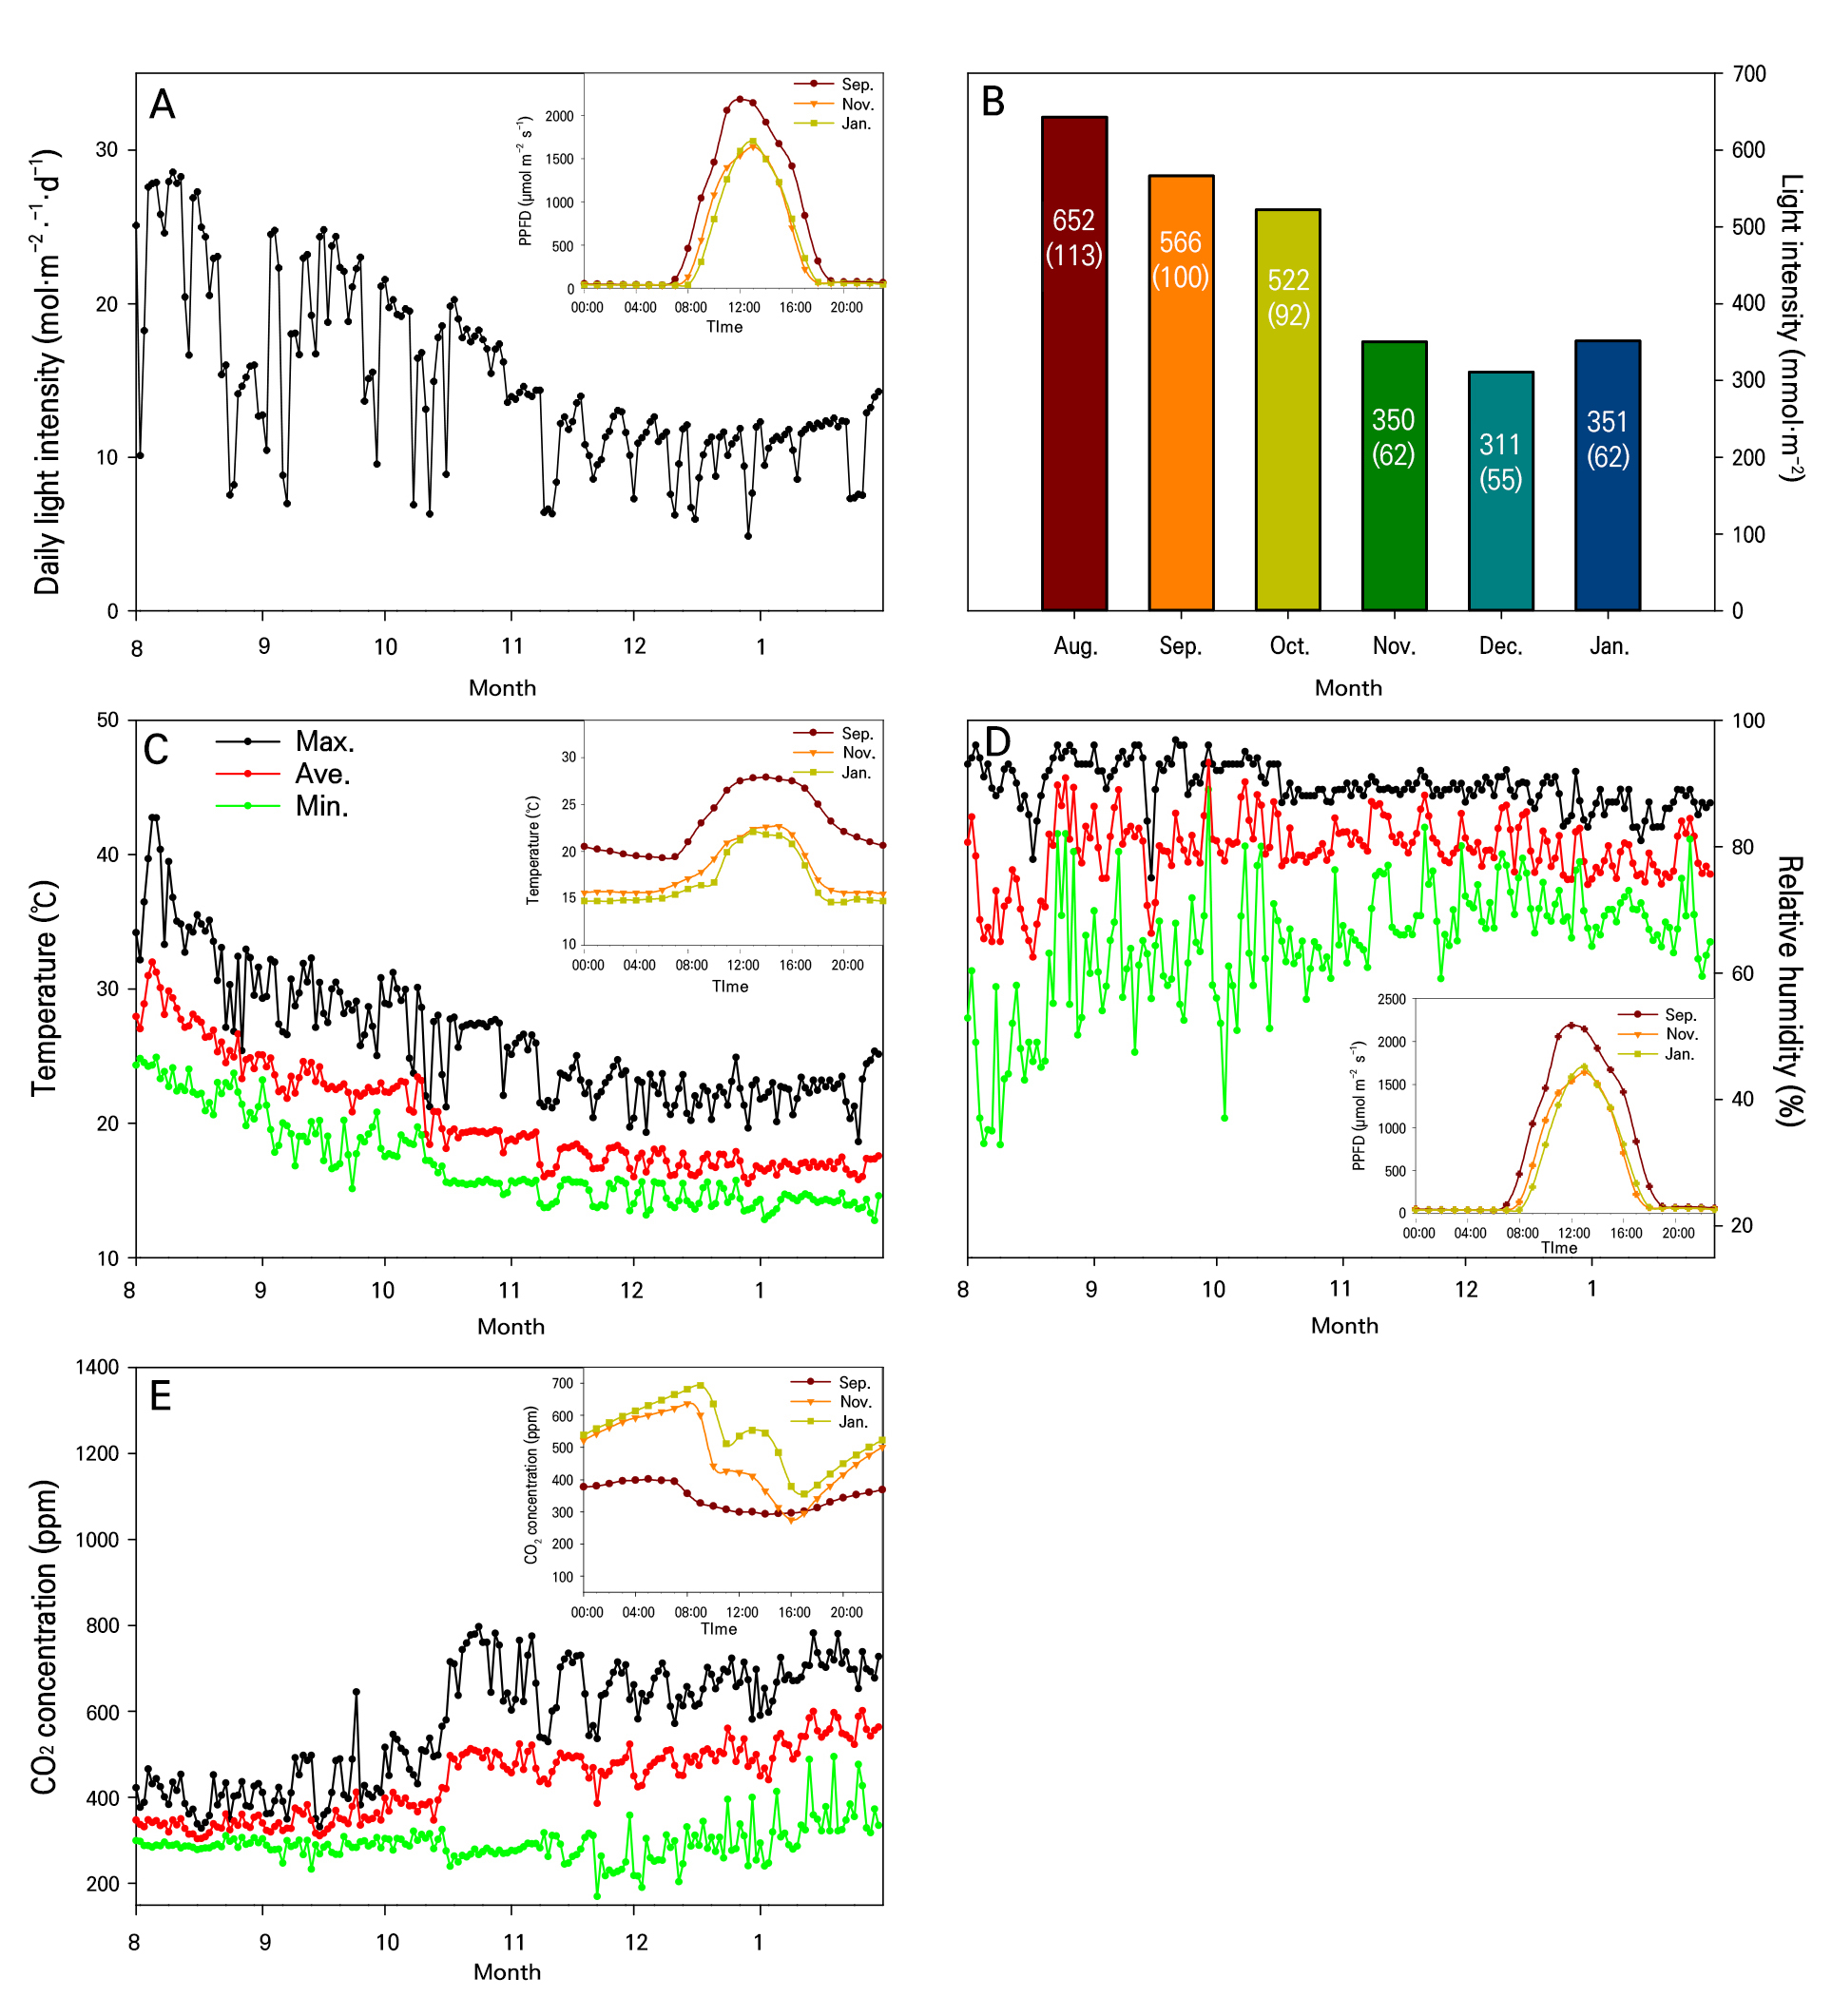
Fig. 1.
Aerial environmental conditions in a greenhouse growing tomato plants from August 2021 to January 2022 of the following year. (A) daily light integral by month, the small box inside A is the monthly change in the outside light intensity; (B) monthly total light intensity; (C) temperature inside the smart greenhouse from August 2021 to January 2022, the small box inside C is the monthly changes in the inside air temperature; (D) relative humidity inside the smart greenhouse from August 2021 to January 2022, the small box inside D is the monthly changes in the inside relative humidity; (E) CO2 concentration inside the smart greenhouse from August 2021 to January 2022, the small box inside E is the monthly changes in the inside CO2 concentration.
Table 1.
Microclimates in the greenhouse used to grow the tomato plants
|
Environmental variables | September, 2021 | November, 2021 | January, 2022 | ||||||||
| Max. | Ave. | Min. | Max. | Ave. | Min. | Max. | Ave. | Min. | |||
|
Temperature (°C) | 28.9 ± 1.9z | 23.0 ± 1.0 | 18.8 ± 1.6 | 23.5 ± 1.8 | 17.8 ± 1.0 | 15.0 ± 0.8 | 22.7 ± 1.5 | 16.8 ± 0.5 | 14.1 ± 0.5 | ||
|
Relative humidity (%) | 92.1 ± 4.3 | 80.2 ± 8.0 | 63.0 ± 5.3 | 89.4 ± 0.9 | 82.0 ± 5.7 | 68.9 ± 2.9 | 86.1 ± 2.1 | 77.7 ± 4.1 | 67.9 ± 2.8 | ||
|
CO2 concentration (ppm) | 423.2 ± 63.8 | 345.2 ± 22.9 | 283.5 ± 16.6 | 652.8 ± 72.4 | 474.3 ± 29.4 | 272.1 ± 37.6 | 694.9 ± 43.2 | 539.8 ± 40.2 | 344.7 ± 61.1 | ||
광합성 매개변수
9월, 11월, 1월에 월별로 광도 0−1,200µmol·m-2·s-1범위에서 토마토 잎을 상, 중, 하로 구분하여 광합성률과 증산율, 기공전도도를 비파괴적인 방법으로 확인하였다(Figs. 2 and 3). 2021년 9월에 토마토의 상, 중 그리고 하위엽으로 구분하여 측정된 광합성률은 착생 엽위에 관계없이 모두 광도가 증가함에 따라 광합성률이 증가하였고, 특히 상위엽에서 광합성률이 유의하게 높았는데 약 14−18µmol·m-2·s-1의 범위 값으로 분석되었다(Fig. 2A). 중·하위엽 역시 광도가 증가함에 따라 광합성률이 증가하였지만, 상위엽에 비하여 유의하게 광합성률이 낮았다. 상위엽 광량이 1,200µmol·m-2·s-1에서 최대 광합성률을 보였지만, 본 실험의 광량 범위에서는 중·하위엽에서 광포화점이 나타나지 않았다. 11월에는 모든 엽위에서 10−14µmol·m-2·s-1의 광합성률을 보였다. 상위엽의 광포화점은 1,000µmol·m-2·s-1에서, 중·하위엽의 광포화점은 800−1,000µmol·m-2·s-1에서 나타났다(Fig. 2C). 1월은 9월과 11월보다 광도가 증가할수록 상·중·하위엽간의 광합성률의 차이는 더 커졌고, 특히 하위엽의 광합성률이 유의하게 낮았는데(Fig. 2C), 이러한 결과는 하위엽이 장시간 동안 저광도의 환경에 적응하여 높은 광량이 주어져도 광합성은 상위엽에 비하여 높아지지 않은 것으로 판단된다. 9월과 11월의 상위엽에서 측정된 기공전도도는 중·하위엽과 유의한 차이를 보였는데 특히 광도 800µmol·m-2·s-1 이상에서 증가하였다(Fig. 2B and 2D). 1월의 기공전도도는 착생 위치에 따른 상, 중, 하위엽에 따라 크게 차이가 났으며, 특히 하위엽의 기공전도도가 가장 낮았다(Fig. 2F). 기공 조절은 변화하는 환경과 스트레스에 대한 식물이 적응하는 기작으로(Damour et al. 2010), 이것은 토마토의 생육 중에 식물체 스스로 온도와 습도를 조절하는 중요한 기능을 수행한 것으로 판단된다. 9월과 11월의 증산율은 광도가 증가하면서 증산율이 증가하는 추세를 보이며(Fig. 3A and 3C) 전반적으로 상위엽의 증산율이 유의하게 높았고, 특히 1월에 측정된 하위엽에서 유의하게 증산율이 낮았다(Fig. 3E). 광도 변화에 따른 CO2 농도(Fig. 3B, 3D, and 3F)는 9월, 11월 및 1월 모두 광도가 0에서 200µmol·m-2·s-1로 높아질 때 급격히 감소하였고, 상위엽의 CO2 농도는 중·하위엽에 비하여 유의하게 높았다. 기공조절과 관련된 증산율은 대체로 계절변화와 관계없이 상위엽에서 높았는데 이는 토마토 식물체가 스스로 생리적인 항상성을 유지하기 위해서 엽위별로 다르게 기공을 조절하는 것으로 판단된다.
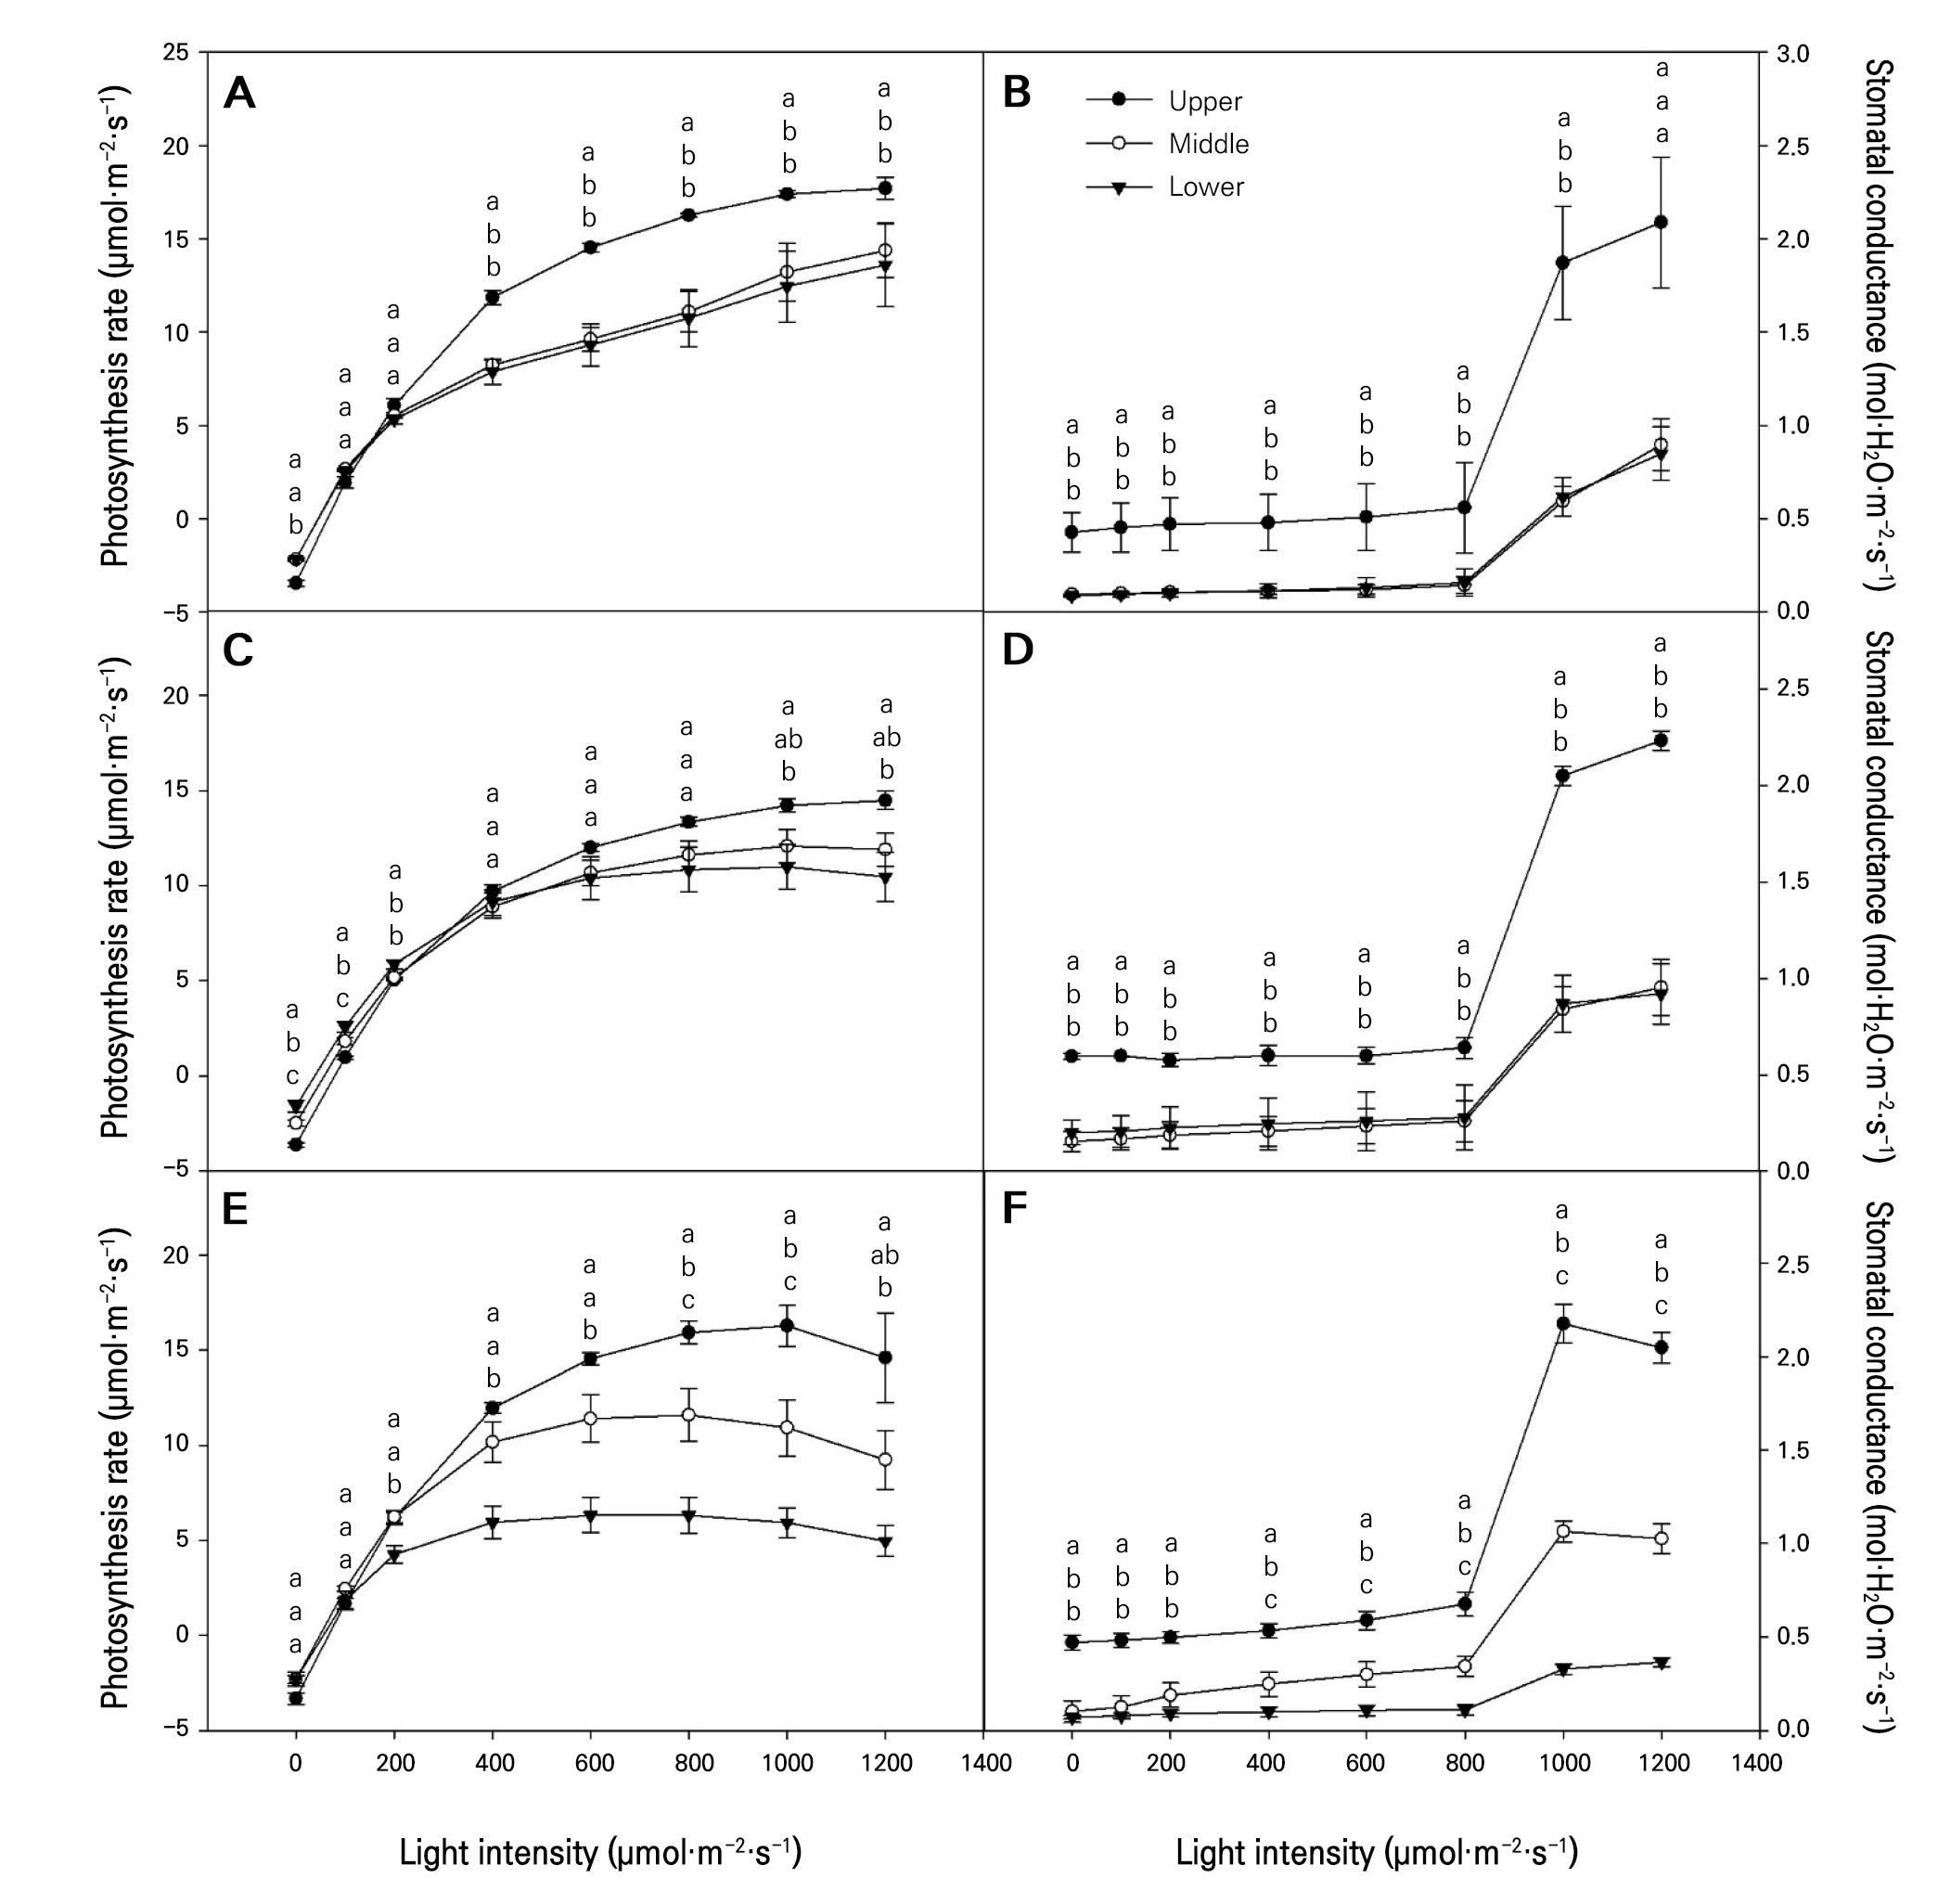
Fig. 2.
Photosynthesis rate and stomatal conductance according to the generated positions of tomato leaves grown in a greenhouse from September to January of the following year: (A) photosynthetic rate measured in September, 2021; (B) stomatal conductance measured in September, 2021; (C) photosynthetic rate measured in November, 2021; (D) stomatal conductance measured in November, 2021; (E) photosynthetic rate measured in January, 2022; (F) stomatal conductance measured in January, 2022; Upper, measured the first to the fifth leaves based on the tomato growing point; Middle, measured the sixth to the tenth leaves based on the tomato growing point; Lower, measured from the eleventh to fifteenth tomato leaves based on the tomato growing point. Vertical bars are the standard errors. Different letters above the vertical bars indicate significant differences among the treatments (DMRT, p < 0.05, n = 3).
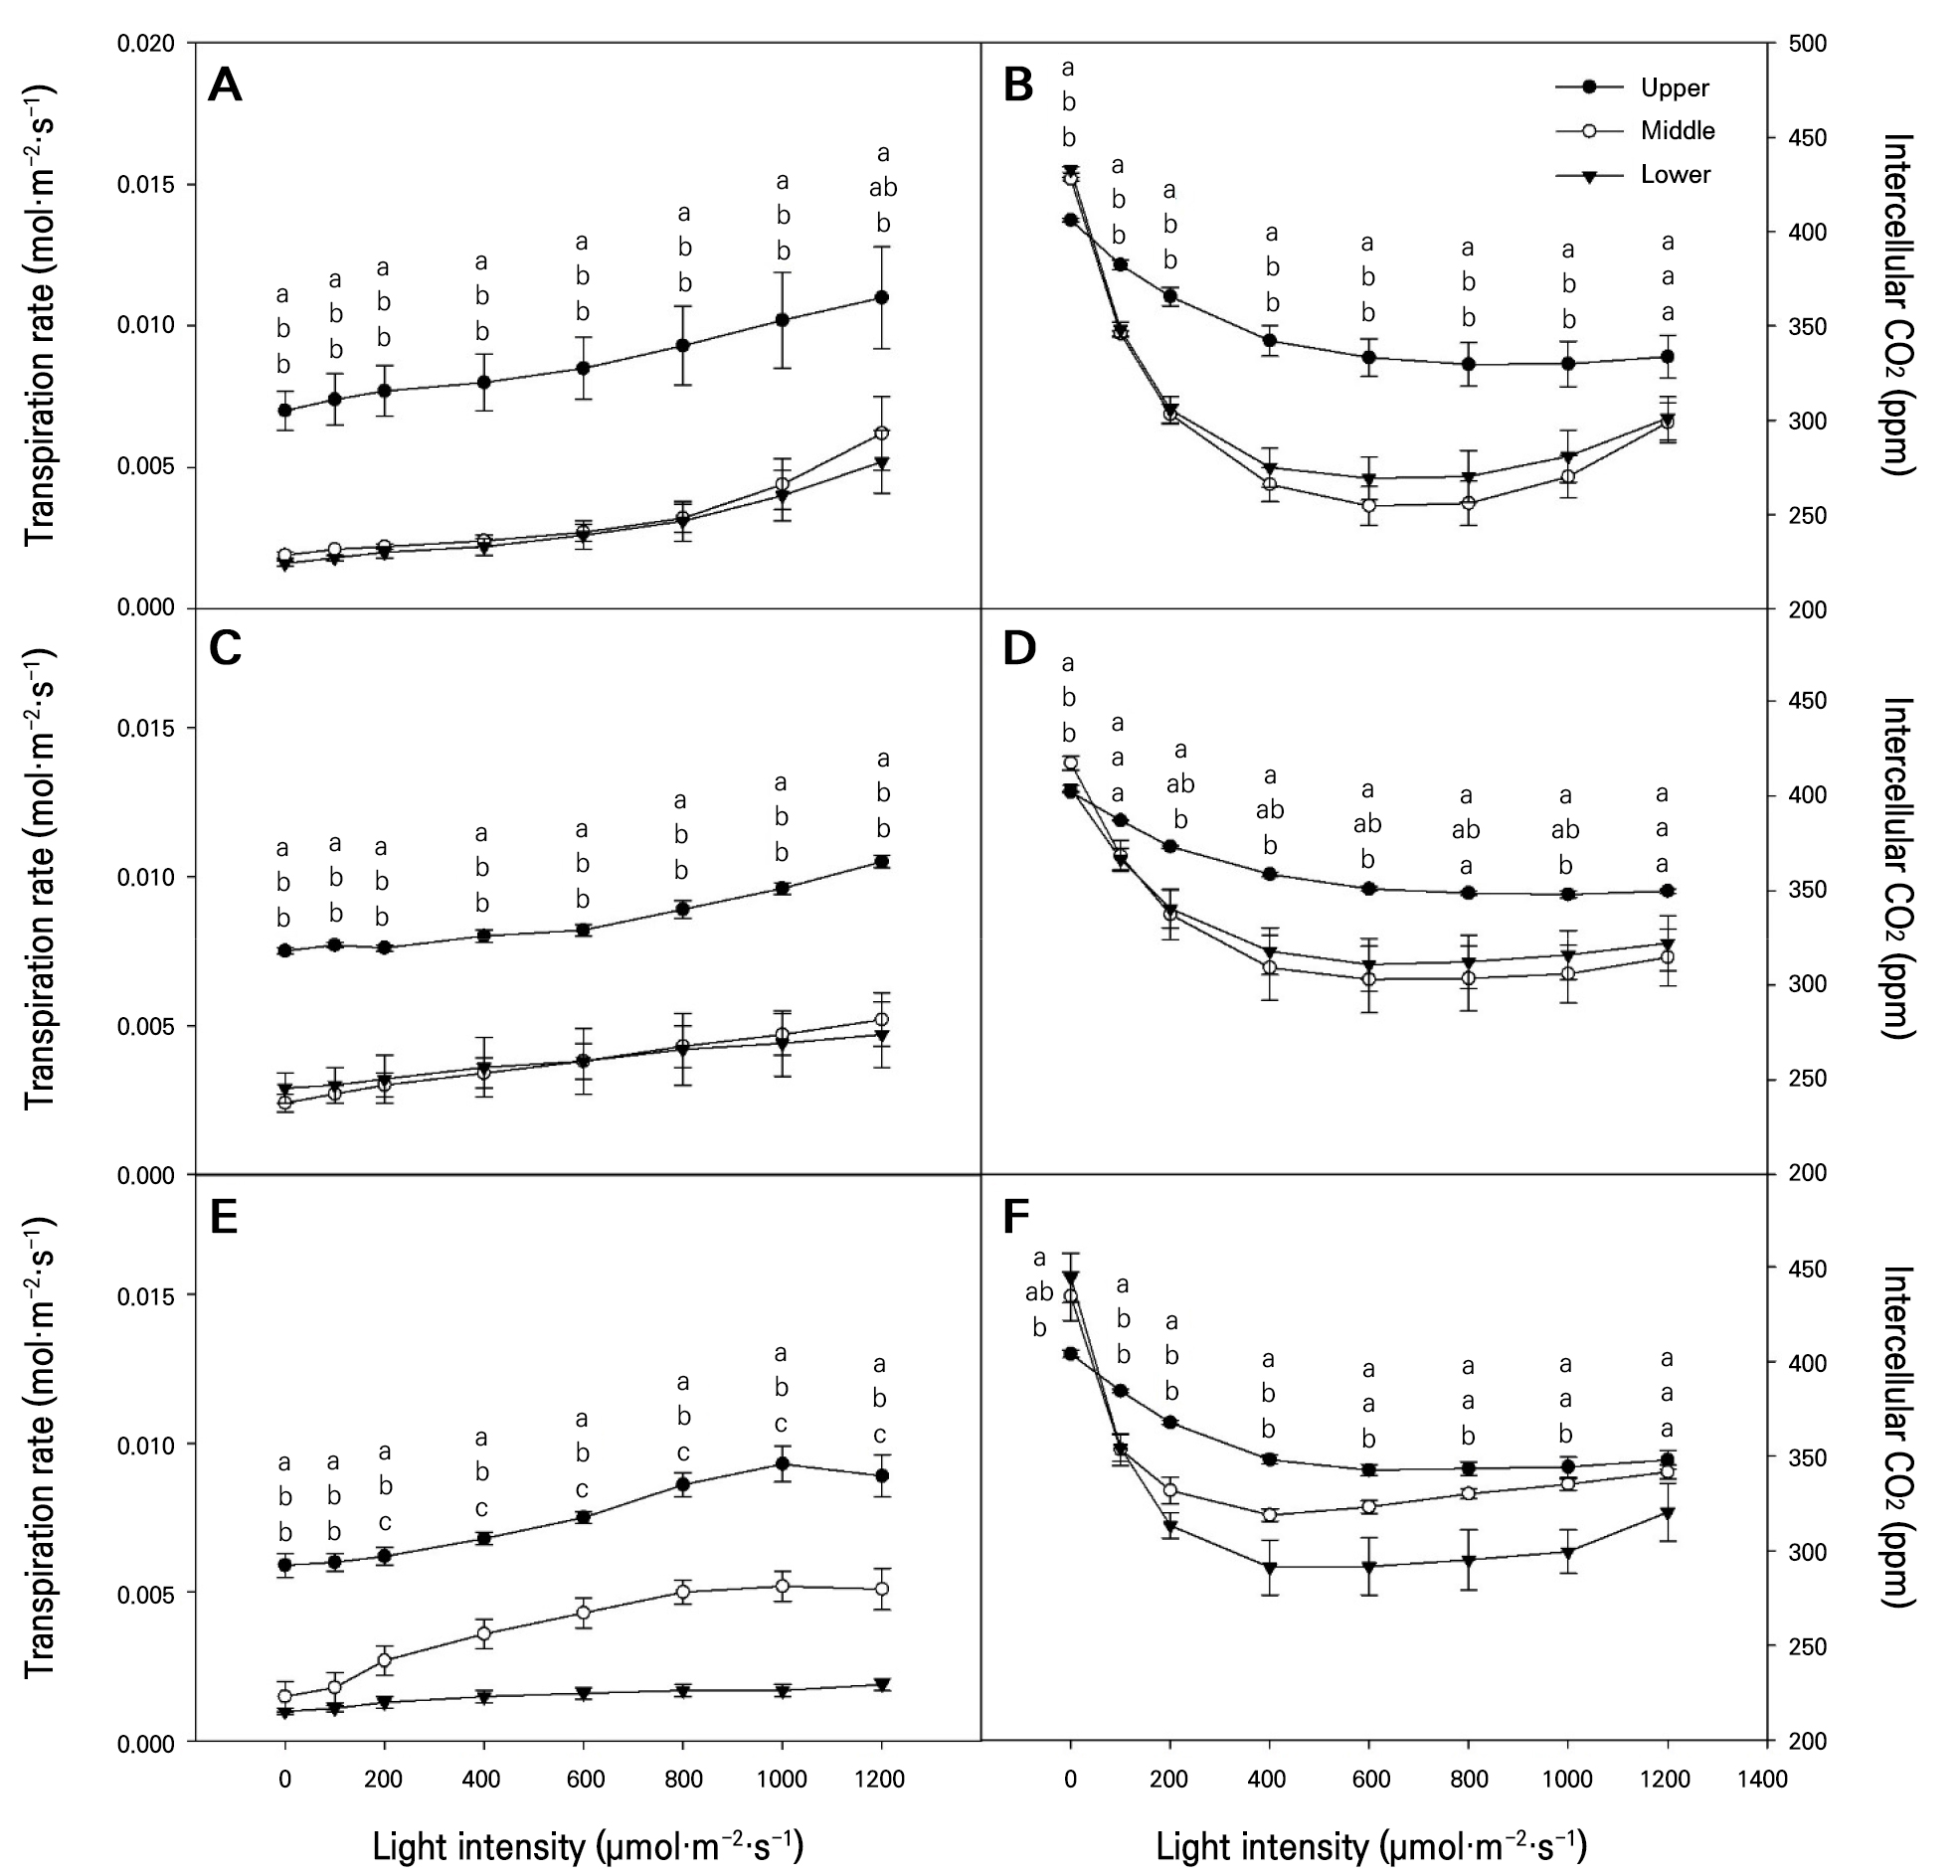
Fig. 3.
Transpiration rates and intercellular carbon dioxide levels according to the generated positions of tomato leaves grown in a greenhouse from September to January of the following year: (A) Transpiration rate measured in September, 2021; (B) Intercellular CO2 measured in September, 2021; (C) Transpiration rate measured in November, 2021; (D) Intercellular CO2 measured in November, 2021; (E) Transpiration rate measured in January, 2022; (F) Intercellular CO2 measured in January, 2022. Upper, measured the first to the fifth leaves based on the tomato growing point; Middle, measured the sixth to the tenth leaves based on the tomato growing point; Lower, measured from the eleventh to the fifteenth tomato leaves based on the tomato growing point. Vertical bars are the standard errors. Different letters above the vertical bars indicate significant differences among the treatments (DMRT, p < 0.05, n = 3).
광합성은 환경 변화, 특히 극한의 온도 변화에 매우 민감하게 반응하며(Li et al. 2014), 광도 및 CO2 농도가 증가함에 따라 광합성 최적 온도는 생육 적온의 범위 내에서 증가하는 것으로 보고된다(Adams et al. 2002). 토마토 온실 재배를 위한 생육 적온의 하한 온도는 15°C이고 생육 상한 온도는 35°C로 보고된다(Shamshiri et al. 2018). 또한 광도가 낮은 환경에서 재배된 딸기의 광합성률과 기공전도도가 급격히 감소했다(Choi 2021)는 보고와 같이 다양한 환경 스트레스 중에서 낮은 광도와 저온은 식물의 생육과 생산성을 제한하는 요소로 판단된다. 특히 1월의 하위엽은 상위엽과 다르게 광합성률, 기공전도도 그리고 증산율이 유의하게 낮았는데, 이는 온실의 낮은 광도와 더불어 명기를 제외한 11시간 동안 15°C 이하 저온의 영향으로 판단된다(Table 1). 따라서, 저온의 경계에 위치한 온도에 장시간 노출될 경우 식물체의 광합성과 관련된 다양한 광생리적 반응의 효율이 떨어져서 품질과 생산량의 감소를 초래할 수 있을 것으로 판단된다. 대안으로 저온기에 보조 광원을 이용한 보광은 온도 상승과 광량 증대로 작물의 수량 증대에 효과적이다(Dorais and Gosselin 2002). 또한 보조 인공 광원을 토마토 수관 아래에 설치하여 보광한 결과 식물체의 생육과 내한성이 증가하였다(Lu et al. 2022). 이를 통해 보조 인공 광원을 이용한 보광 재배법과 하위엽을 강하게 적엽하여 광합성 효율을 증가시킬 수 있다(Anten and Ackerly 2001). 일반적으로 토마토 광합성 매개변수는 상위엽에서 더 높은 효율을 보이며 하위엽으로 갈수록 감소하는 경향을 보인다. 따라서 1월과 같이 광량과 온도가 낮아 하위엽의 광합성 효율이 낮은 시기에는 하위 엽들에 대해 강한 적엽이 필요할 것으로 판단된다.
엽록소 형광반응(Origin Jump Intermediate Peak, OJIP)
토마토 온실 재배 시 광량과 온도가 높은 9월에 엽록소 형광반응을 측정한 결과, 상위엽은 J−I 단계에서 거의 직선적인 증가현상을 보였으나, 중·하위엽은 완만한 상승곡선을 보였다(Fig. 4B). 이러한 결과는 온실 상부의 높은 광도의 영향을 받은 상위엽이 스트레스를 받아 J−I 단계가 영향을 받은 것으로 해석된다. 이와 유사한 연구로 제초 작업 시 제초제(그라목손)의 영향으로 OJIP 곡선이 거의 직선으로 증가되었는데, 이것은 그라목손이 명반응 전자 전달 과정을 완전히 차단하여 고사시키는 결과와 유사한 것으로 보고된다(Hassannejad et al. 2020). 9월과는 달리 11월과 1월에는 개별 엽록소 형광 매개변수들의 차이는 보였지만, 엽위별 OJIP 곡선의 패턴은 차이가 없었다(Fig. 4D and 4F). 광합성의 명반응 중 광계 II에서 암적응 최대 양자 효율을 나타나는 FV/FM 값은 9월과 11월에 상위엽은 중·하위엽보다 유의하게 감소하였다(Table 2). 이와 같은 결과는 토마토 엽의 열 스트레스로 인해 FV/FM 값이 감소한다는 연구 결과들과 유사하였다(Pan et al. 2018; Mesa et al. 2022). 또한 밀, 보리, 수수 등에서도 고조도 광조건에서 FV/FM 값이 모두 감소하는 것으로 나타났다(Chen et al. 2023). 9월과는 다르게 온도와 광량이 모두 낮아지는 1월의 FV/FM 값은 엽위별 유의한 차이가 없는 것으로 나타났다. Ayari et al.(2000)는 벤로형 온실에서 겨울철 토마토가 저온과 광량으로 인해 광합성이 억제되는 경향을 보였지만, FV/FM 값은 0.82−0.86을 유지하여 광 부족으로 인한 저해는 발생하지 않는다는 연구 결과와 유사하였다.
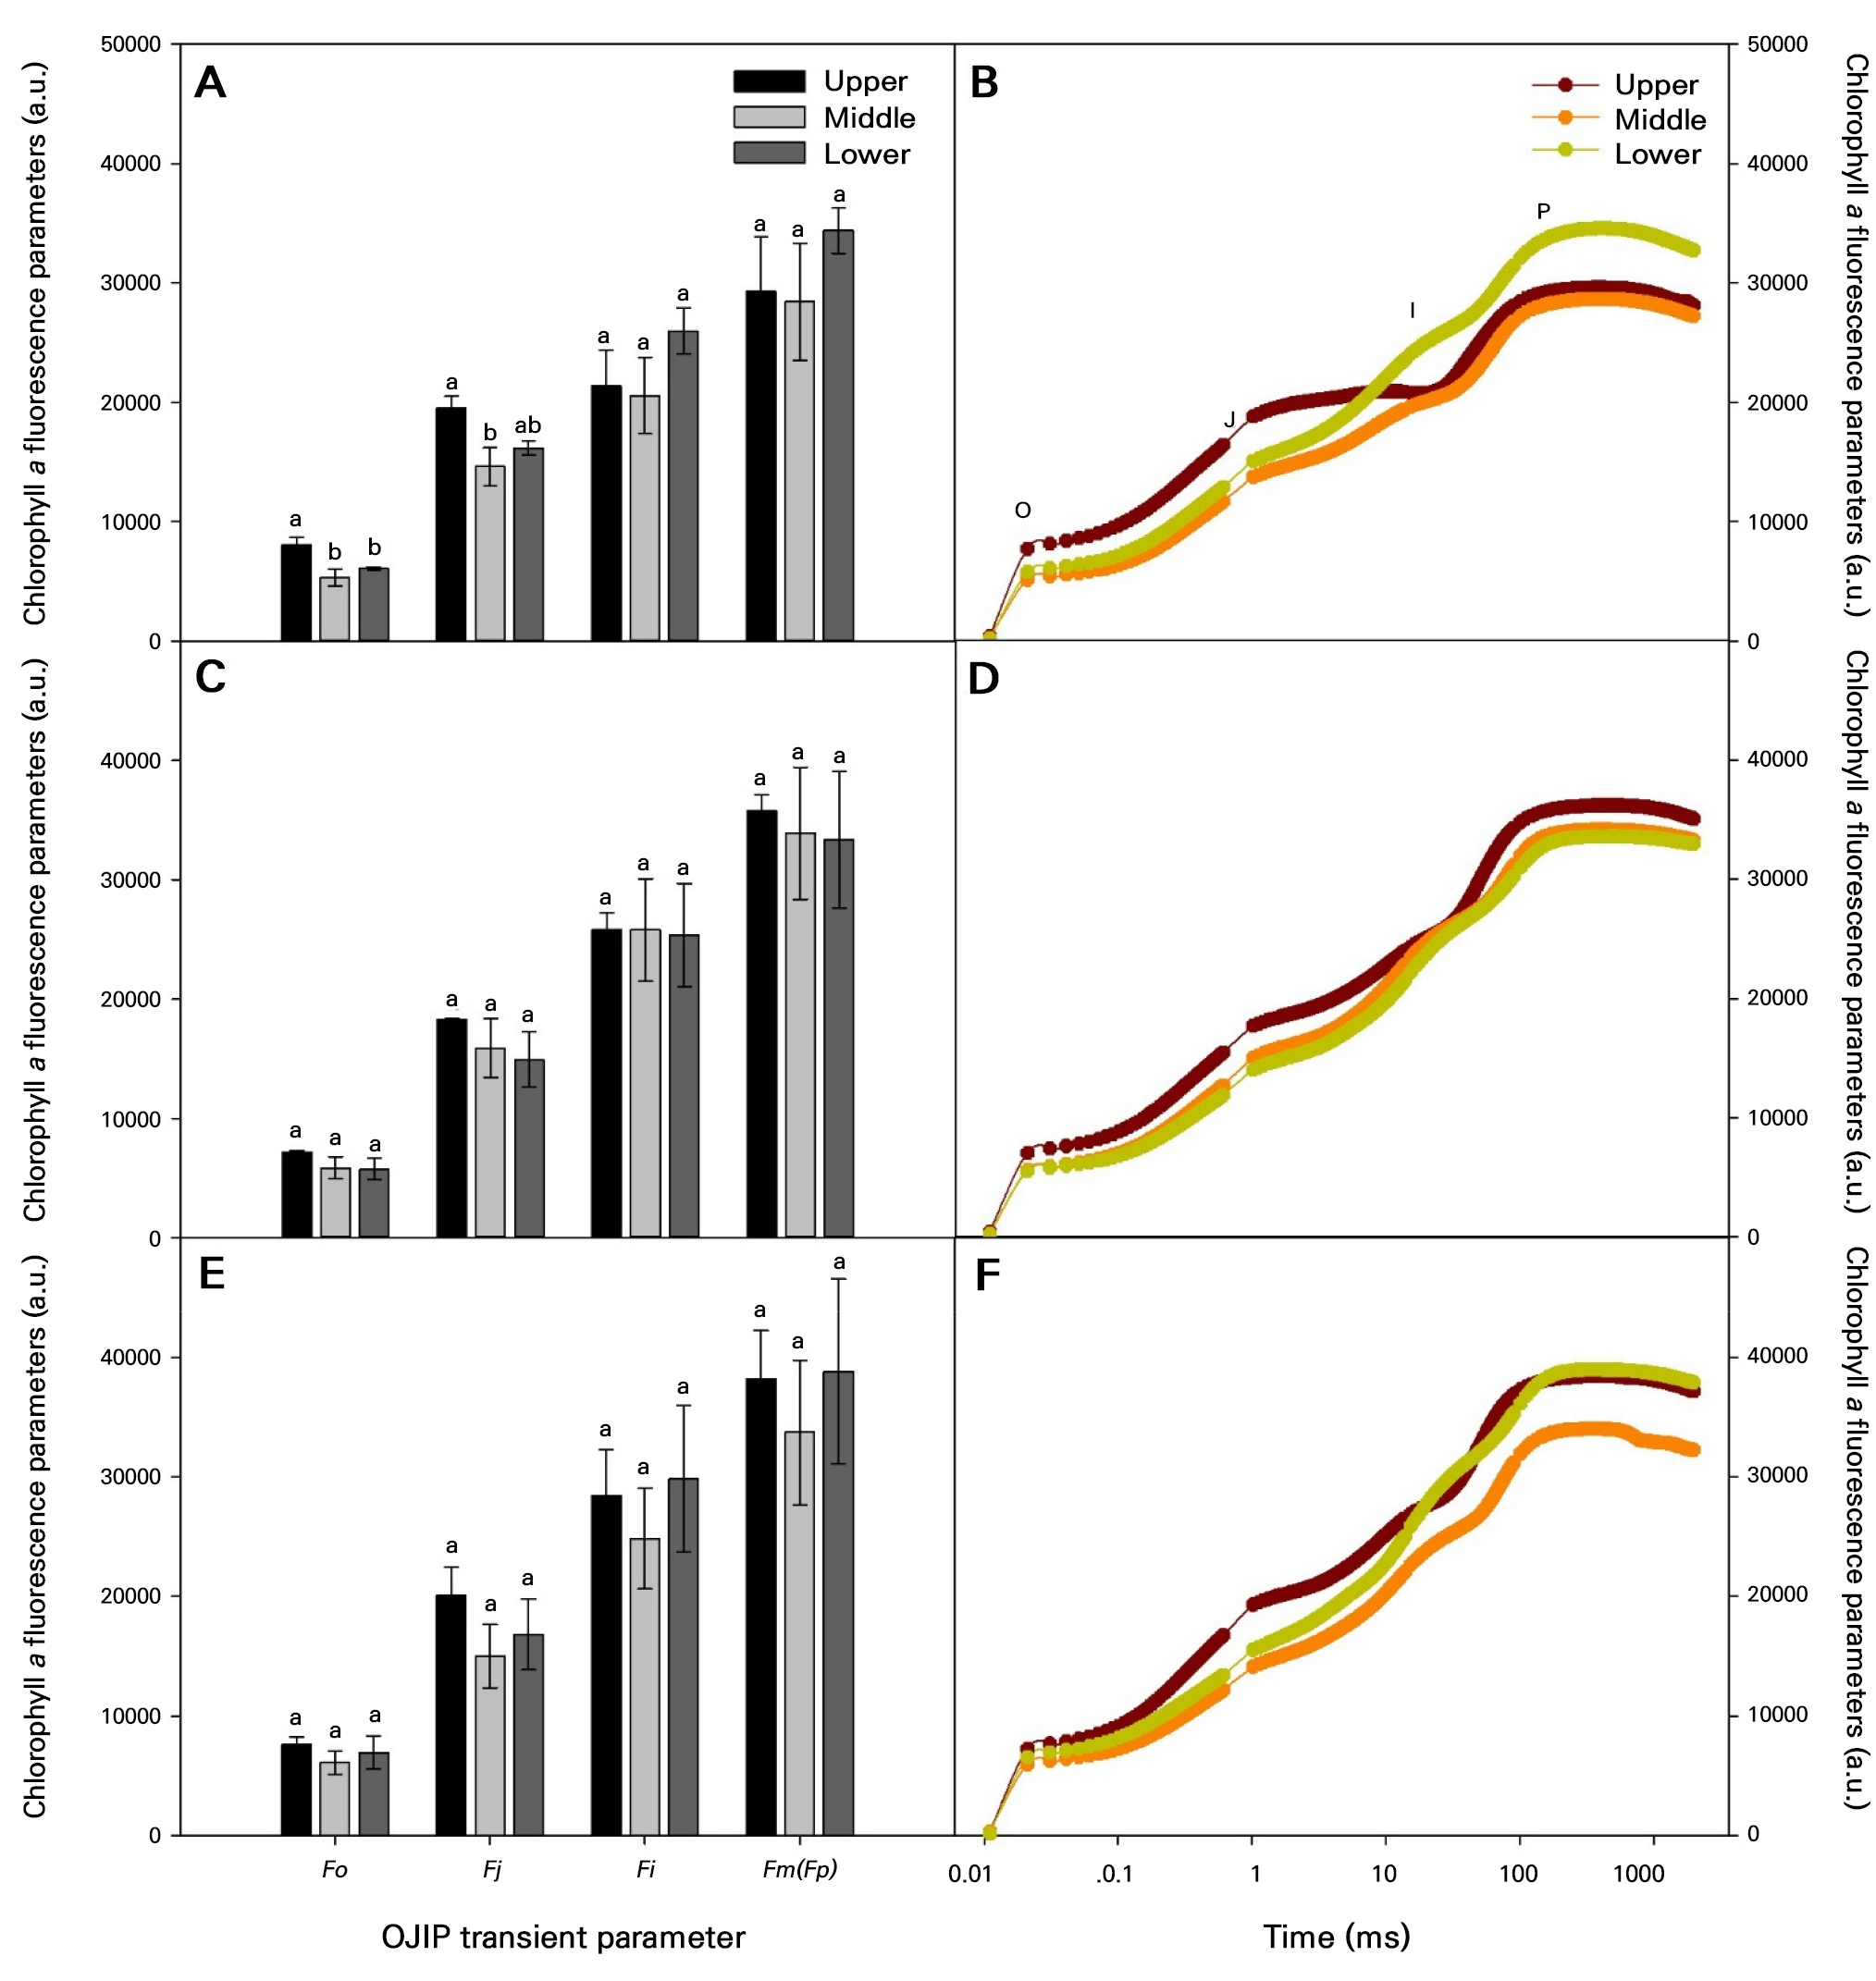
Fig. 4.
Chlorophyll a fluorescence OJIP transient according to the generated positions of tomato leaves grown in a greenhouse from September to January of the following year: (A), (B) measured in September 2021; (C), (D) measured in November, 2021; (E), (F) measured in January, 2022; Upper, measured the first to the fifth leaves based on the tomato growing point; Middle, measured the sixth to the tenth leaves based on the tomato growing point; Lower, measured from the eleventh to the fifteenth tomato leaves based on the tomato growing point. Vertical bars are standard errors. Different letters above the vertical bars indicate significant differences among the treatments (DMRT, p < 0.05, n = 3).
토마토 상위엽은 9월과 11월에 광합성 전자전달과 관련된 매개변수인 ABS/RC와 TRO/RC에서 높은 값을 보였는데, 이는 명반응의 산물인 ATP와 NADPH를 왕성하게 합성한 것으로 판단된다. 9월 상위엽의 ABS/RC와 TRO/RC 값이 유의하게 높은 반면, FV/FM 값은 0.71를 나타내었다. 이는 최적의 광량을 넘어선 과도한 광량으로 인한 엽록체 광계 II에서 광저해로 인한 스트레스가 발생한 것으로 판단된다(Table 2). 그리고 11월의 상위엽은 ABS/RC와 TRO/RC 값이 높았지만, FV/FM 값은 0.80으로 유의하게 낮았는데, 이는 11월의 온실 내 광량 수준은 광저해를 발생시키지 않는 수준인 것으로 판단된다. 9월, 11월 그리고 1월을 여름, 가을 그리고 겨울로 구분하여 판단해보면, 9월의 상위엽에서는 광저해 스트레스로 인해 ETO/RC가 감소하였으나, 엽위별로 유의한 차이는 없었다. 한편 11월의 상위엽에서는 ETO/RC가 증가하여 광합성 활동에 긍정적인 영향을 미친 것으로 해석된다. 반면, 1월의 모든 광합성 관련 변수 값에서 착엽된 위치에 관계없이 비슷하게 나타났는데, 이는 9월에 비해 광량이 감소한 환경에서도(Fig. 1B), 엽온과 엽에서 받는 광량이 엽위별로 유의한 차이가 없기 때문으로 판단된다(Table 3).
Table 2.
Chlorophyll a fluorescence OJIP transient parameters according to the generated positions of tomato leaves grown in a greenhouse from september to january of the following year
| Date | Leaf position | FV/FM | ABS/RC | TRO/RC | ETO/RC | DIO/RC |
| Sep. 23 | Upper | 0.71 ± 0.06z by | 2.51 ± 0.25 a | 1.75 ± 0.03 a | 0.69 ± 0.19 a | 0.77 ± 0.22 a |
| Middle | 0.81 ± 0.02 a | 1.91 ± 0.11 b | 1.55 ± 0.06 b | 0.89 ± 0.07 a | 0.37 ± 0.05 a | |
| Lower | 0.82 ± 0.01 a | 1.91 ± 0.03 b | 1.57 ± 0.04 b | 1.01 ± 0.09 a | 0.34 ± 0.01 a | |
| Nov. 16 | Upper | 0.80 ± 0.01 b | 2.20 ± 0.09 a | 1.75 ± 0.05 a | 1.07 ± 0.00 a | 0.44 ± 0.04 a |
| Middle | 0.83 ± 0.00 a | 1.88 ± 0.06 b | 1.56 ± 0.05 b | 0.99 + 0.01 b | 0.33 ± 0.01 b | |
| Lower | 0.83 ± 0.00 a | 1.80 ± 0.09 b | 1.54 ± 0.03 b | 1.02 ± 0.02 b | 0.33 ± 0.02 b | |
| Jan. 20 | Upper | 0.80 ± 0.01 a | 2.16 ± 0.11 a | 1.72 ± 0.08 a | 1.02 ± 0.02 a | 0.43 ± 0.03 a |
| Middle | 0.82 ± 0.01 a | 1.92 ± 0.08 a | 1.57 ± 0.06 a | 1.07 ± 0.05 a | 0.35 ± 0.03 a | |
| Lower | 0.82 ± 0.00 a | 1.94 ± 0.03 a | 1.59 ± 0.02 a | 1.09 ± 0.05 a | 0.35 ± 0.00 a |
Table 3.
Monthly changes in leaf temperatures and leaf light intensity levels
| Environmental variables | Leaf position | September, 2021 | November, 2021 | January, 2022 |
| Leaf temperature (°C) | Upper | 27.3 ± 0.73z ay | 22.8 ± 0.44 a | 20.8 ± 1.09 a |
| Middle | 25.5 ± 0.76 b | 23.0 ± 0.58 a | 20.8 ± 0.17 a | |
| Lower | 24.7 ± 0.33 b | 21.5 ± 0.50 a | 20.5 ± 0.29 a | |
| Leaf light intensity (µmol·m-2·s-1) | Upper | 1363.0 ± 115.6 a | 526.6 ± 56.92 a | 286.7 ± 34.43 a |
| Middle | 471.7 ± 51.25 b | 278.1 ± 38.56 b | 227.0 ± 36.85 a | |
| Lower | 149.8 ± 25.94 b | 118.7 ± 7.49 b | 82.13 ± 8.52 a |
엽록소 함량
엽록소 함량은 광 스트레스가 광합성 색소에 미치는 영향을 분석하는 데 도움이 되며(Partelli et al. 2009), 엽록소는 광합성 안테나 시스템에서 태양 에너지를 수확하고 반응 센터 내에서 전하 분리 및 전자 수송을 담당하는 필수 요소이다(Tanaka and Tanaka 2006). 엽록소 a의 함량은 실험기간 동안 31.35−34.08mg·kg-1의 범위에서 비교적 일정한 수준으로 유지되었고, 계절 변화에 따라 엽위별 유의한 차이는 없었다(Fig. 5A). 그러나 엽록소 b의 함량은 9월에 엽위간 각각 40.77, 36.97, 15.85mg·kg-1으로 나타내어 하위엽으로 갈수록 함량이 감소하였다. 또한, 가을에서 겨울로 계절이 변화함에 따라 엽위에 관계없이 엽록소 b와 엽록소 a+b 함량이 감소하는 경향을 보였다(Fig. 5B and 5C). 엽록소 함량의 변화는 광량과 온도와 밀접한 관계가 있으며, 광량이 증가함에 따라 엽록소 함량은 증가하고(Kong et al. 2016), 또한 온도의 변화에 따라 엽록소 함량은 증가하거나 감소하는 것으로 보고된다(Erge et al. 2008). 엽온과 광량의 측정 결과, 9월의 상위엽은 중·하위엽에 비해 유의하게 온도가 높았고, 9월과 11월의 상위엽은 중위엽이나 하위엽보다 더 높은 광도를 받았다. 따라서 엽위에 따라 온도 및 광도에 차이가 나타났으며, 시간이 경과함에 따라 모두 감소하는 경향을 보였다(Table 3). 이러한 결과를 바탕으로 엽온과 광량은 9월의 상위엽 및 중위엽의 엽록소 b 및 엽록소 a+b 함량에 중요한 영향을 미치며, 11월과 1월과 같이 엽온과 광량이 낮아지는 시기에는 엽록소 b 및 엽록소 a+b 함량의 감소에 영향을 주는 것으로 판단된다. 이는 엽온과 광량이 계절에 따라 엽록소 함량의 변화에 중요한 영향을 미치는 것을 시사한다.
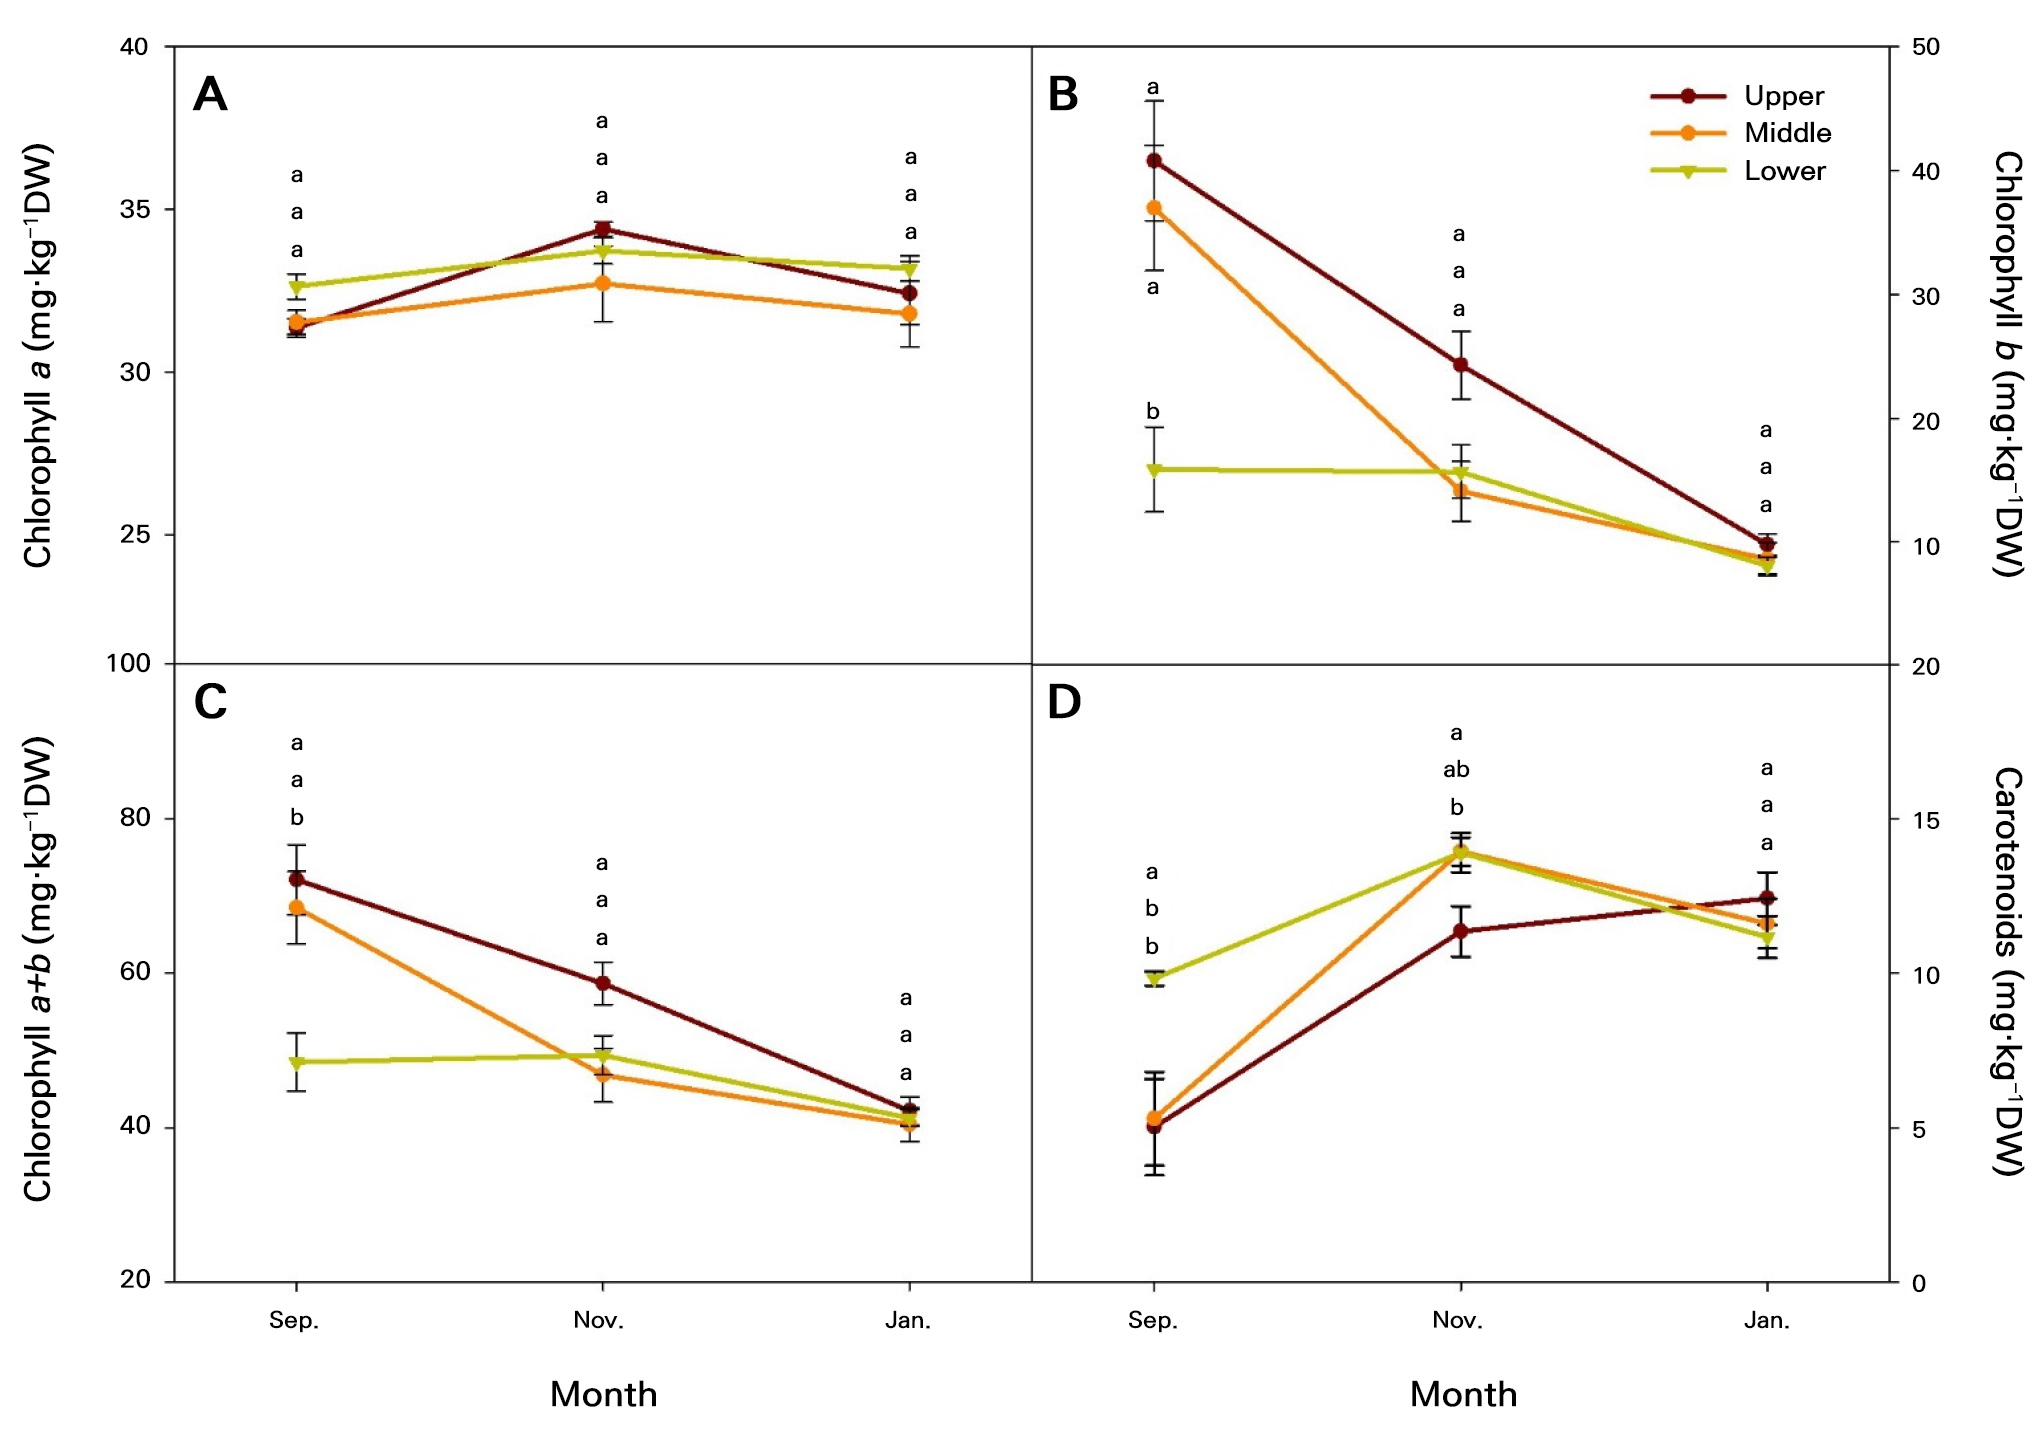
Fig. 5.
Photosynthesis pigment contents according to the generated positions of tomato leaves grown in a greenhouse from September to January of the following year: (A) chlorophyll a; (B) chlorophyll b; (C) chlorophyll a+b; (D) carotenoids; Upper, measured the first to fifth leaves based on the tomato growing point; Middle, measured the sixth to tenth leaves based on the tomato growing point; Lower, measured from the eleventh to fifteenth tomato leaves based on the tomato growing point. Vertical bars are the standard errors. Different letters above the vertical bars indicate significant differences among the treatments (DMRT, p < 0.05, n = 3).
파프리카에서도 온도는 엽록소 형성에 중요한 재배 환경 요인 중의 하나로 특히, 저온에서 가장 감소량이 많았다(Bhandari et al. 2018). 피망의 경우 저온과 자외선 B(UV−B) 하에서 엽록소 함량이 크게 감소하였고(León-Chan et al. 2017), 커피의 경우에도 저온에서 엽록소 함량이 감소하는 것으로 나타났다(Partelli et al. 2009). 뿐만 아니라 저온 프라이밍 된 겨울 밀과 봄철 저온 스트레스를 받은 식물체에서 엽록소 함량이 크게 감소하였다(Li et al. 2014). 또한, 토마토 엽의 엽록소 a, b 및 엽록소 a+b의 함량은 저광도 조건에 노출한 지 5일째부터 현저하게 감소하였다(Meng et al. 2017).
카로티노이드는 고광도에서 중요한 잎 보호제이자 광을 수확하는 색소(McElroy et al. 2006)로 광합성 명반응의 전반적인 효율성을 향상시키는 역할을 하며, 과도한 광의 노출로부터 광합성 기구들을 보호하는 역할을 한다(Theocharis et al. 2012; Hashimoto et al. 2016). 또한 온도 역시 카로티노이드 함량 변화에 많은 영향을 미치는데, 특히 저온에 노출된 식물은 저온 반응 유전자 계통을 활성화하여 카로티노이드를 포함한 항산화물질의 축적이 증가하는 것으로 알려져 있다(Sinha et al. 2015). 따라서, 9월보다 저온기인 11월과 1월에 카로티노이드 함량이 증가한 것은 저온 환경에서 광도와 온도의 영향(Dumas et al. 2003)으로 함량이 높아진 것으로 판단된다. 엽록소 b 및 엽록소 a+b 함량은 광합성률과 비슷하게 상위엽에서 하위엽으로 가면서 광량이 줄어들수록 감소하는 경향을 보이고, 저온기인 1월에는 엽위별 유의한 차이가 없이 함량의 감소가 나타난다. 반대로 카로티노이드의 함량은 저온 환경에서 함량이 증가하는 것이 확인된다.
상관관계
피어슨의 상관관계를 이용하여 토마토의 광합성 매개변수 간의 상관관계를 분석하였다(Fig. 6). 전 생육 기간의 광합성률(A)은 증산율(E, r = 0.77, p < 0.001)과 기공전도도(gs, r = 0.68, p < 0.001)는 높은 양의 상관관계를 보였고, 엽록소 b와 엽록소 a+b는 각각 양의 상관관계(r = 0.48, p < 0.05)를 보였다. 또한, 광계 II의 최대 양자 효율(FV/FM, r = −0.47, p < 0.05)과 광계 II 반응 중심당 QA에서 QB로의 전자 전달효율(ETO/RC, r = −0.49, p < 0.05)은 음의 상관관계를 보였다. gs는 E(r = 0.97, p < 0.001)와 TRO/RC(r = 0.64, p < 0.001)와 ABS/RC(r = 0.62, p < 0.001)는 높은 유의수준에서 양의 상관관계를 보였으나, FV/FM(r = −0.49, p < 0.01)는 음의 상관관계를 보였다. E는 ABS/RC(r = 0.66, p < 0.001), TRO/RC(r = 0.62, p < 0.01)와 높은 양의 상관관계를 보였고, FV/FM(r = −0.57, p < 0.05)와 ETO/RC(r = −0.38, p < 0.05)는 음의 상관관계를 보였다.
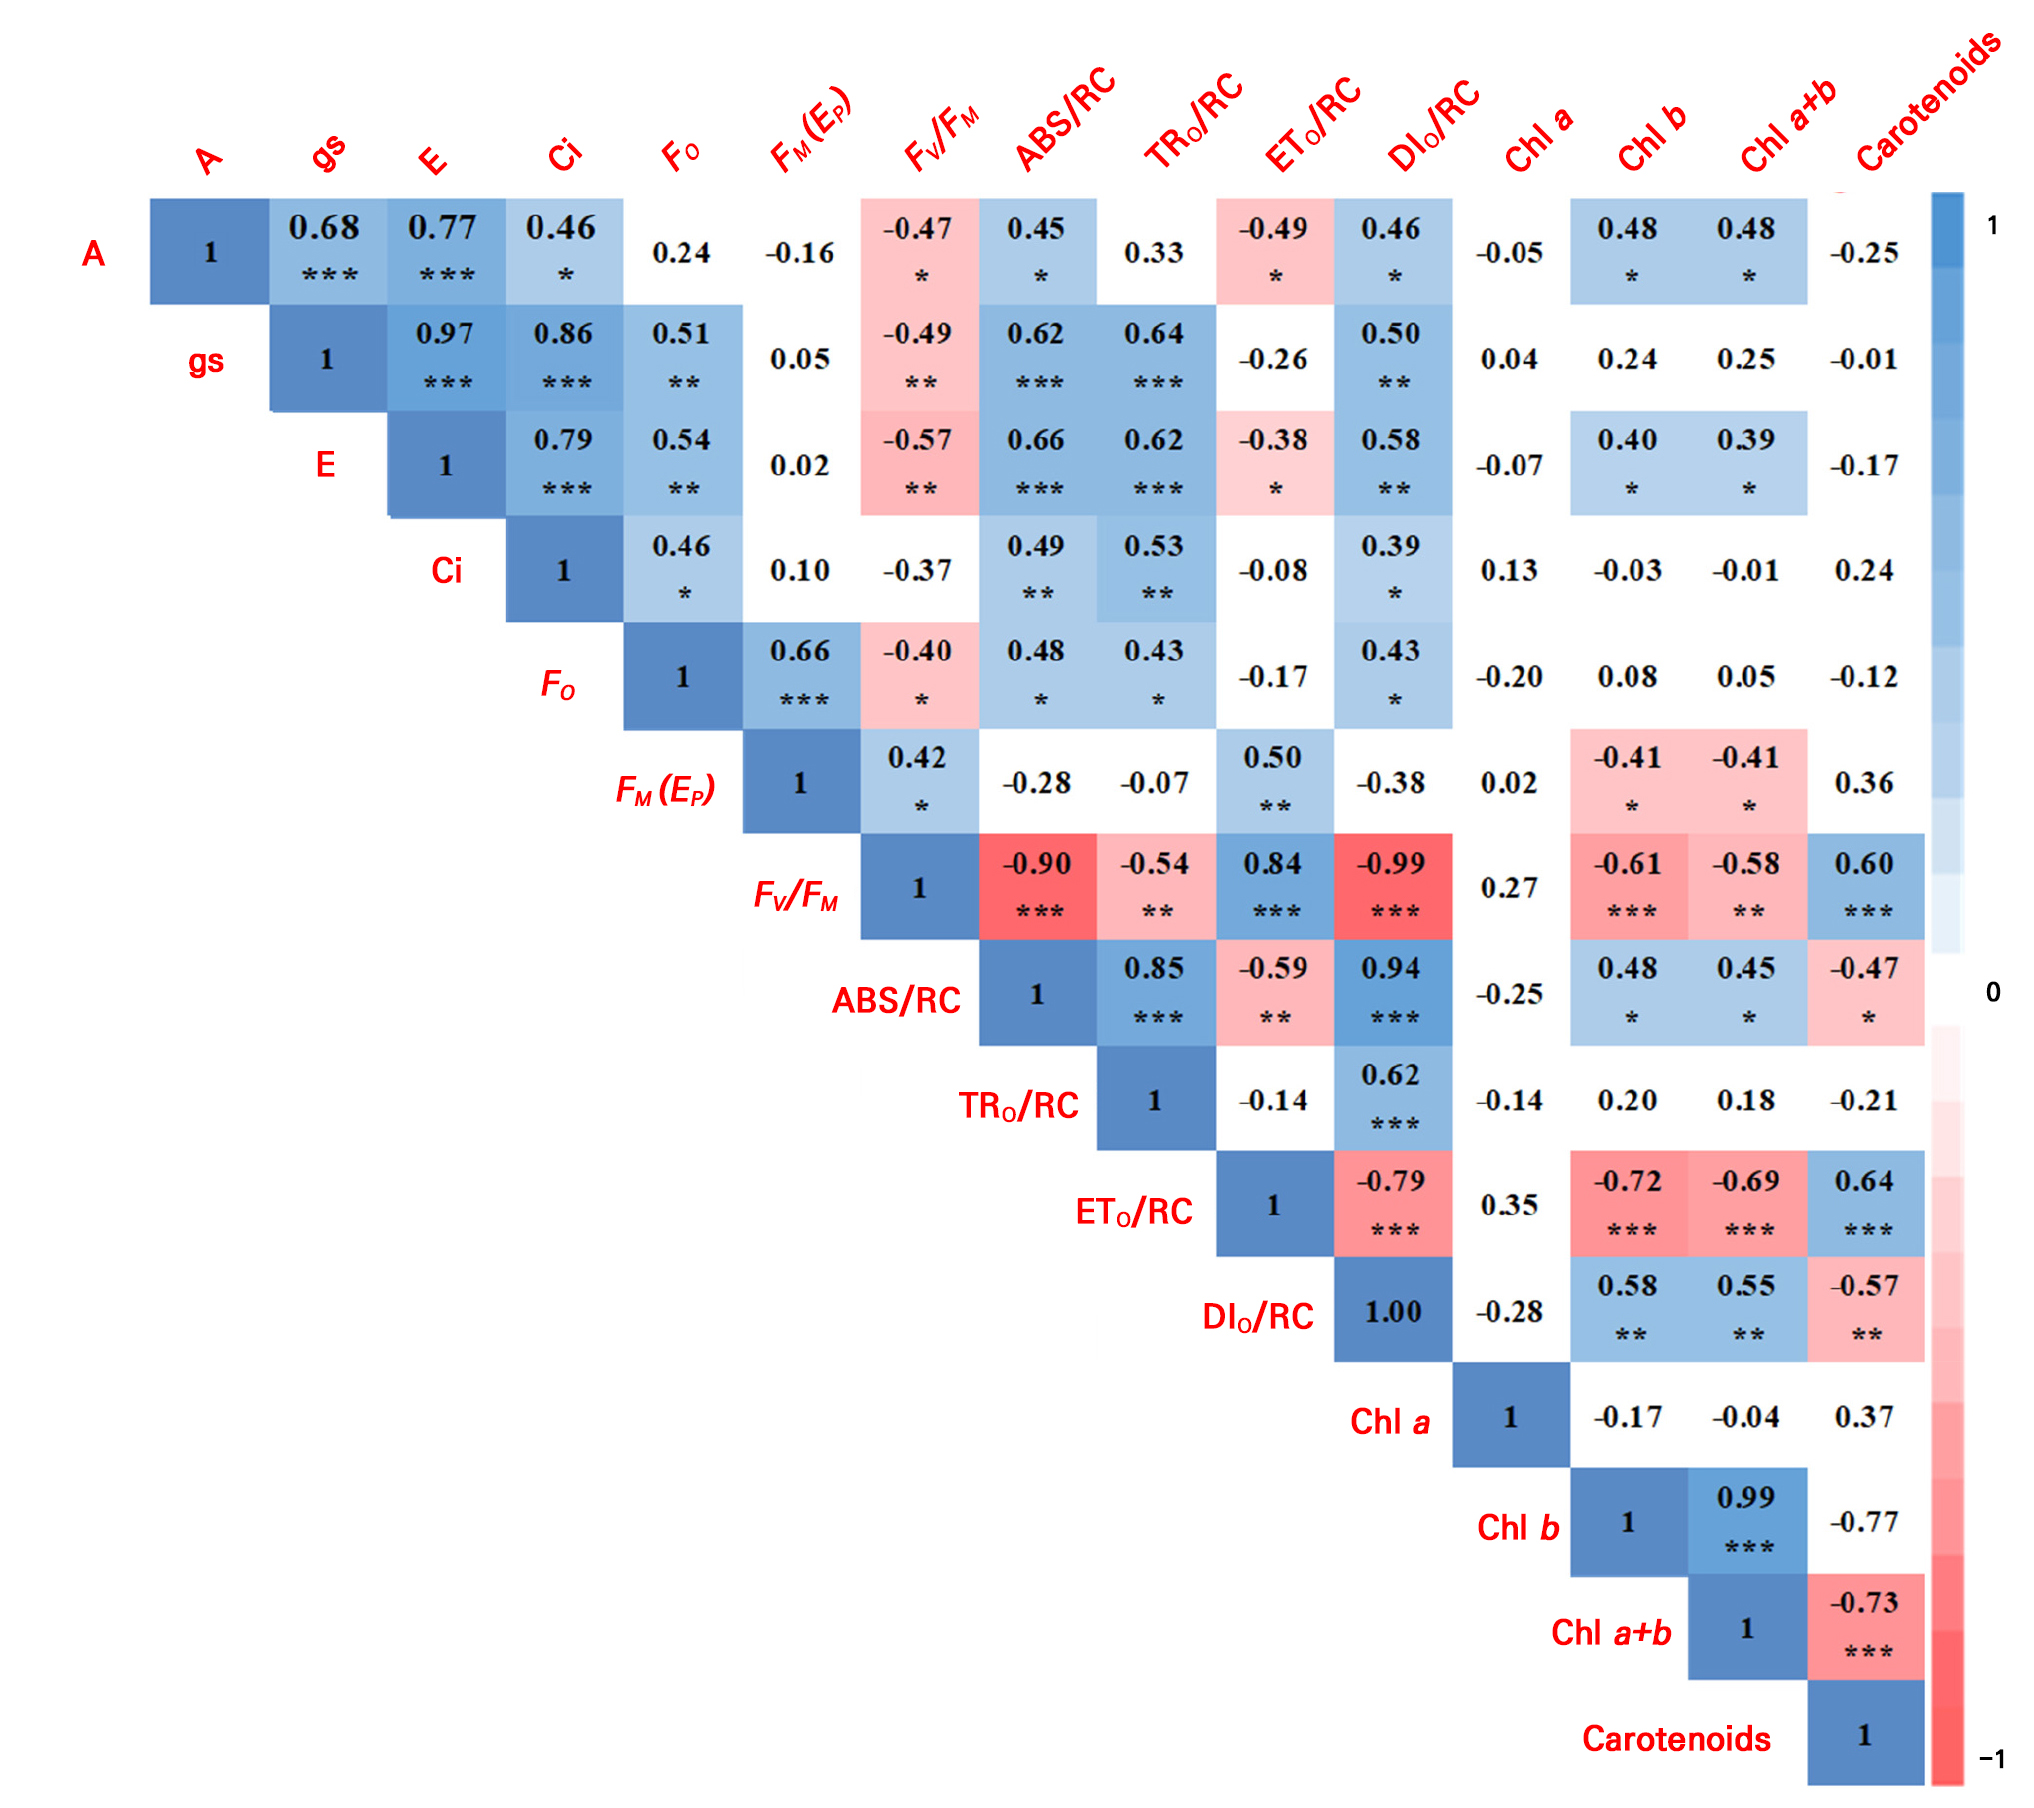
Fig. 6.
Correlations among photosynthetic parameters, chlorophyll a fluorescence parameters, and photosynthetic pigments of tomato in a greenhouse according to Pearson correlation coefficients: *, **, and *** denote significance at p ≤ 0.05, 0.01, and 0.001 respectively (n = 9). White box: non-significant correlation. A, photosynthetic rate; E, transpiration rate; gs, stomatal conductance; Ci, intercellular CO2; FO, minimal fluorescence when all photosystem II (PSII) reaction centers are open; FM(FP), maximal fluorescence when all PSII RCs are closed; FV/FM, Estimated maximum quantum efficiency (yield) of primary photochemistry; ABS/RC, Average absorbed photon flux per PSII reaction center; ETO/RC, Rate of electron transport flux from QA to QB per PSII reaction center; TRO/RC, Trapped energy flux per PSII; DIO/RC, Heat dissipation at time 0, per reaction center; Chl a, chlorophyll a; Chl b, chlorophyll b; Chl a+b, chlorophyll a+b. Measured in September, November 2021, and January 2022.
FV/FM는 ETO/RC(r = 0.84, p < 0.001)와 카로티노이드(r = 0.60, p < 0.001)에서 높은 양의 상관관계를 보였으나, ABS/RC(r = −0.90, p < 0.001)와 DIO/RC(r = −0.99, p < 0.001), 엽록소 b(r = −0.61, p < 0.001)에서는 높은 음의 상관관계를 보였다. 또한, TRO/RC(r = −0.54, p < 0.001)와 엽록소 a+b(r = −0.58, p < 0.01)는 음의 상관관계를 보였다. ABS/RC는 TRO/RC(r = 0.85, p < 0.001) 및 DIO/RC(r = 0.94, p < 0.001)와 높은 양의 상관관계를 보였고, ETO/RC(r = −0.59, p < 0.001), 카로티노이드(r = −0.47, p < 0.05)와 음의 상관관계를 보였다. ETO/RC는 카로티노이드(r = 0.64, p < 0.001)와 높은 양의 상관관계를 보였고, DIO/RC(r = −0.79, p < 0.001)와 엽록소 b(r = −0.72, p < 0.001)는 엽록소 a+b(r = −0.69, p < 0.001)와 높은 음의 상관관계를 보였다. 한편, 광합성 색소인 엽록소 a+b와 카로티노이드는(r = −0.73, p < 0.001) 높은 음의 상관관계를 보였다.
명반응 관련 매개변수(ABS/RC, TRO/RC, ETO/RC, DIO/RC)와 암반응 관련 매개변수(A) 간에는 양의 상관관계가 관찰되었다(Kwon and Choi 2022). 이는 다양한 환경과 식물 종에서 기공 전도도와 광합성 속도 간에는 밀접한 상관 관계를 나타낸(Yamori et al. 2020) 결과와 유사하였다. 그러나, 본 실험에서는 암반응 관련 매개변수(A, gs, E)와 명반응 매개변수 중 ABS/RC, DIO/RC와는 양의 상관관계가 관찰되었지만, ETO/RC는 음의 상관관계를 보였다. Choi(2021)의 연구에 따르면, 장마철 토마토의 엽에 TiO2를 100mg·kg-1엽면 시비 시 A와 ETO/RC이 함께 상승하였고, Kwon and Choi(2022)의 연구에서도 여름철 고온 환경에서 다른 대목에 접목된 절화장미의 광합성 반응을 조사한 결과, 광합성 활동이 증가하는 경우 ETO/RC도 같이 증가하는 경향을 보였다. 이러한 결과를 볼 때, 겨울철 저온 온실 환경에서는 A가 점차 감소하는 추세를 보이는 반면, ETO/RC는 증가하여 음의 상관을 나타낸 것으로 해석된다.
주성분 분석(Principal Component Analysis, PCA)
토마토의 광합성 매개변수, 엽록소 형광 매개변수 그리고 광합성 색소를 대상으로 2021년 9월과 11월, 그리고 2022년 1월의 전 생육기간과 월별 각각의 주성분 분석(PCA)을 수행하였다. 데이터, 점수, 적재값 및 잔차의 PCA 복합분석은(Bro and Smilde 2014) 적재값과 점수를 함께 시각화하는 바이플롯(Biplot)으로 표현하였다(Fig. 7). 전 생육기간의 PCA 분석 결과(Fig. 7A), 첫 번째 주성분(PC1)이 89.03%으로 가장 높았고, 다음은 PC2에서 10.97% 작용하는 것으로 나타났다. PC1은 FV/FM(0.262), Carotenoids(0.247), ETO/RC(0.174)와 양의 상관을 보였고, E(−0.274), TRO/RC(−0.274)는 음의 상관을 나타냈다. PC2는 Carotenoids(0.336), DIO/RC(0.216), A(0.203)과 양의 상관이 관찰되었다. 전체 주성분 요인에 대한 복합분석 결과, 가장 효율적인 광합성 매개변수는 FV/FM 값으로 확인하였다. 한편, 월별 PCA 분석 결과, PC1는 9월에 ETO/RC(0.287)와 FV/FM(0.284)과 양의 상관관계를 가졌고, A(−0.284)와 DIO/RC(−0.281)는 음의 상관관계를 가졌다. 또한 PC2에서는 FM(FP)(0.451)와 Carotenoids(0.377)에서 양의 상관관계를 가졌다(Fig. 7B). 반면에 11월에는 FV/FM(0.273)과 Carotenoids(0.254)를 제외하고 대부분의 변수가 음의 상관을 가졌으며, PC2는 광합성 색소인 Chl a(0.639), Chl a+b(0.426), Carotenoids(0.291)는 양의 관계를 나타냈다(Fig. 7C). 1월에는 ETO/RC(0.306)와 FV/FM(0.304)이 양의 상관관계를 가졌고, E(−0.306)와 gs(−0.307)는 음의 상관을 보였고, PC2는 광합성 명반응 매개변수가 양의 상관을 나타낸 반면 광합성 색소들은 음의 상관관계를 보였다(Fig. 7D).
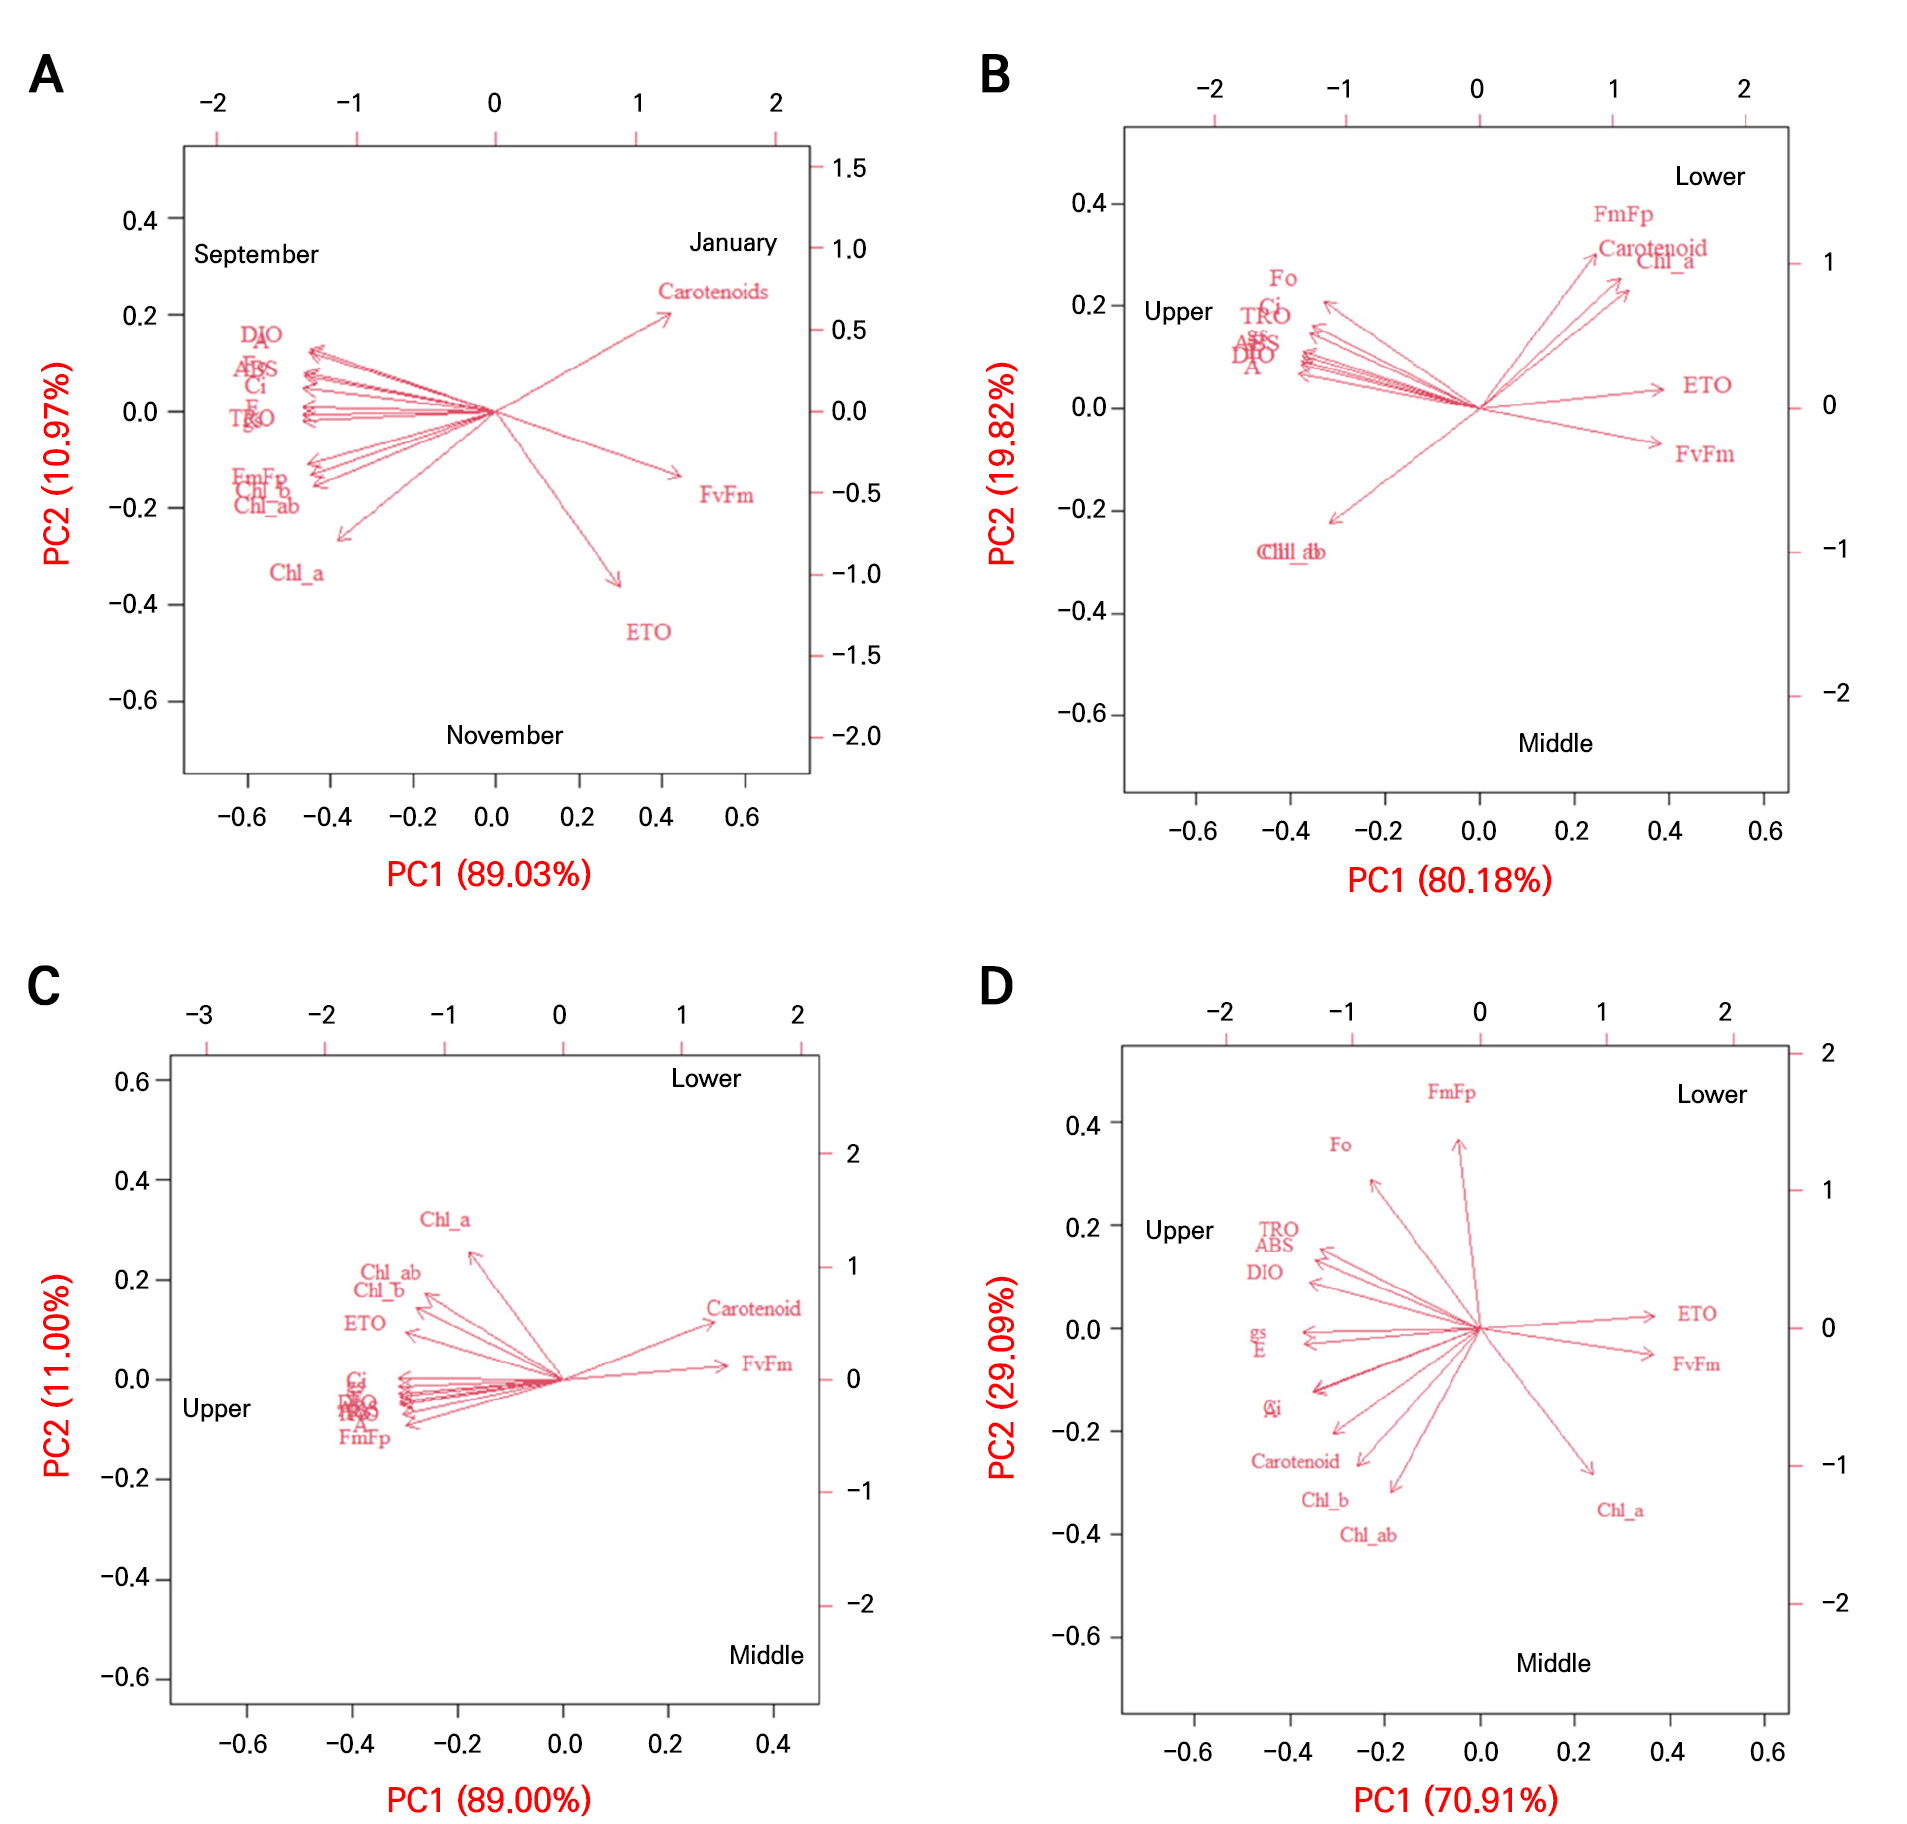
Fig. 7.
Biplots from the principal component analysis (PCA) of the photosynthetic parameters, chlorophyll a fluorescence parameters, and photosynthetic pigments of tomato grown in a greenhouse under seasonal variations. Upper, measured the first to the fifth leaves based on the tomato growing point; Middle, measured the sixth to the tenth leaves based on the tomato growing point; Lower, measured from the eleventh to the fifteenth tomato leaves based on the tomato growing point. A, photosynthetic rate; E, transpiration rate; gs, stomatal conductance; Ci, intercellular CO2; Fo, FO; Fj, FJ; Fi, FI; FmFp, FM(FP); FvFm, FV/FM; ABS, ABS/RC; TRO, TRO/RC; ETO, ETO/RC; DIO, DIO/RC; Chl_a, chlorophyll a; Chl_b, chlorophyll b; Chl_ab, chlorophyll a+b. (A) September and November 2021, January 2022; (B) September 2021; (C) November 2021; (D) January 2022.
PCA 분석 결과, PC1의 주요한 변동 요인 중 하나로 FV/FM 값이 양의 상관을 나타냈고, A, gs, E는 음의 상관을 나타내는 공통적인 영향력을 나타내었다. FV/FM 값은 광합성 효율을 측정하는 지표로, 저온의 온실 환경에서 작물이 스트레스를 받고 있지만, 명반응에서 광계 II의 활성 효율성이 유지되는 상황으로 해석된다. 반면 광합성 암반응과 관련된 매개변수(A, gs, E)는 저온의 온실 환경에서 효율성이 감소가 되고, 이는 명반응과 관련된 전자전달 효소들에 비하여 암반응과 관련된 RuBP같은 탄소 고정 효소의 활성이 저온에 더 많은 영향을 받기 때문인 것으로 판단된다
결 론
토마토 장기 재배 환경에 해당하는 여름, 가을, 겨울의 온실 환경 변화에 따라 토마토 엽위별로 광생리학적 반응 특성을 분석한 결과 다음과 같은 결론을 도출하였다. 9월, 11월, 1월에는 광합성률, 기공전도도, 증산율은 상, 중, 하위엽의 순으로 감소하였다. 특히, 1월의 하위엽은 기공전도도, 증산율이 유의하게 감소하여 광합성 효율에 많은 영향을 주었다. 계절에 따른 온실 환경 변화는 토마토의 광합성 기작에 영향을 주며, 특히 하위엽에서 광합성 효율이 가장 낮아지는 것을 알 수 있었다. 엽록소 a 함량은 계절에 따라 엽위별로 변화를 나타내지 않았지만, 엽록소 b, a+b 함량은 겨울에 더 감소하는 경향으로 나타났다. 광계를 보호하는 색소인 카로티노이드는 겨울철에 함량이 증가하였는데, 이는 광계를 저온으로부터 보호하기 위한 생리적 변화로 판단된다. 그리고 광합성 매개변수 PCA분석에서는 FV/FM 값이 PC1의 주요변수로 양의 상관관계를 나타내고, 광합성률, 기공전도도, 증산율은 음의 상관을 나타냄으로 광합성의 명반응과 암반응은 온실의 환경 변화에 따라 토마토의 광생리적 반응은 민감하게 작용하는 것을 확인할 수 있다. 이처럼 계절적 환경변화에 따라 토마토의 광생리적 반응을 효율적으로 높이고, 생산성을 향상시키기 위해서는 계절별 광량 정도에 따라 적정량의 적엽이 필요하며, 또한 적정 야간 온도를 유지해야 할 것으로 판단된다. 이러한 결과로 미루어보아 계절에 따른 온실 환경 변화는 토마토의 광합성 활동에 영향을 주며, 특히 하위엽에서 계절적인 변화에 따른 광합성 활동의 변화 폭이 더 큰 것을 알 수 있다.
