

Introduction
Materials and Methods
Design of the non-thermal plasma model and water quality characterization
Measurement of germination and growth parameters
Determination and analysis of glucosinolate concentrations and contents
Determination and analysis of phenolic acid concentrations and contents
Statistical analysis
Results
Change in the properties of PAW
Germination of radish sprouts according to the PAW treatment time
Plant growth parameters
Glucosinolate concentrations and contents
Phenolic acid concentrations and contents
Discussion
Conclusion
Introduction
Plasma is the fourth state of matter along with the solid, liquid, and gas states (Hou et al. 2023; Li et al. 2024). It is an ionized gaseous state characterized by a unique mixture of high-energy electrons, ions, and neutral particles coexisting simultaneously (Lata et al. 2022; Karthik et al. 2023). Plasma can be classified into thermal and nonthermal types based on the level of ionization and energy distribution characteristics (Zhang et al. 2023). Plasma occurs naturally in celestial bodies, including the sun, and in atmospheric phenomena such as lightning and auroras (Kimura et al. 2023; Holmstrom et al. 2024). In addition to its natural presence, plasma can be artificially generated and applied in various industrial and scientific fields, leveraging its distinctive characteristics (Liang et al. 2018; Albert et al. 2021; Lin et al. 2022).
Plasma has been actively researched in recent years as an agricultural technology, mainly in the form of plasma-activated water (PAW) rather than direct plasma, and recent studies have shown that plasma enhances seed germination (Kamseu-Mogo et al. 2024), promotes plant growth (Shumeyko et al. 2025), inhibits pathogens, and has bactericidal effects (Agus et al. 2024) on the agricultural side. For agricultural applications, PAW is typically generated using two methods: dielectric barrier discharge (DBD) and pulsed corona discharge (PCD) (Panarin et al. 2023). These methods facilitate reactions with various reactive oxygen species (ROS) and reactive nitrogen species (RNS) (Guo et al. 2025a, 2025b), including hydrogen peroxide (H2O2), hydroxyl radicals (OH・), ozone (O3), superoxide (O2‒), nitrate (NO3‒), and nitrite (NO2‒) (Zhou et al. 2020; Panarin et al. 2023). Nitrate ions (NO3‒) produced by PAW act as a source of nitrogen for plants, contributing to hormone biosynthesis, and promote the accumulation of trans-zeatin in roots, which activates auxin transport and enhances root development (Thirumdas et al. 2018; Stoleru et al. 2020; Ka et al. 2021). PAW also generates H2O2, which plays an important role in plant signaling and stress responses (Dynowski et al. 2008). At low concentrations, H2O2 activates antioxidant production pathways under stress conditions by regulating photosynthesis, stomatal conductance, respiration, growth, and development (Khan et al. 2018; Capitulino et al. 2023; Jahan et al. 2023), whereas at high concentrations it can induce severe oxidative stress, leading to cell death (Gechev and Hille 2005; Jahan et al. 2023). Therefore, it is important to optimize the concentration and duration of the PAW treatment.
Sprouts typically mature within three to five days after germination, before the emergence of true leaves, and can be entirely consumed, including the roots, stems, and seeds, making them increasingly popular worldwide as functional foods and dietary supplements owing to their short cultivation period and high nutritional value (Ebert 2022). Radish sprouts (Raphanus sativus L.) are widely cultivated given their rapid growth and rich bioactive compound content (Baenas et al. 2017). They are particularly abundant in glucosinolates, isothiocyanates, flavonoids, and phenolic compounds, which contribute to their health-promoting properties, including antioxidant, anti-inflammatory, and potential anticancer effects (Rakpenthai et al. 2019; Al-Khayri et al. 2022; Yadav and Dhankhar 2022; Garcia-Ibañez et al. 2023). Among these, glucosinolates play a key role in plant defense mechanisms and serve as precursors for isothiocyanates with reported anticancer potential (Becker and Juvik 2016; Arumugam and Razis 2018), while phenolic compounds enhance functional quality through their antioxidant and anti-inflammatory activities (Kanner 2020; Rashidi et al. 2025). Both are sensitive to redox signaling, potentially indicating stress responses to treatments such as plasma-activated water (PAW) (He et al. 2025). Although interest in sprouts as functional foods is increasing, research on cultivation strategies to enhancing bioactive compound production and the application of plasma technology for agricultural purposes remains limited. Therefore, this study aimed to analyze the physicochemical properties of PAW and evaluate its effects on the germination, growth, and accumulation of bioactive compounds in radish sprouts (Raphanus sativus L.).
Materials and Methods
Design of the non-thermal plasma model and water quality characterization
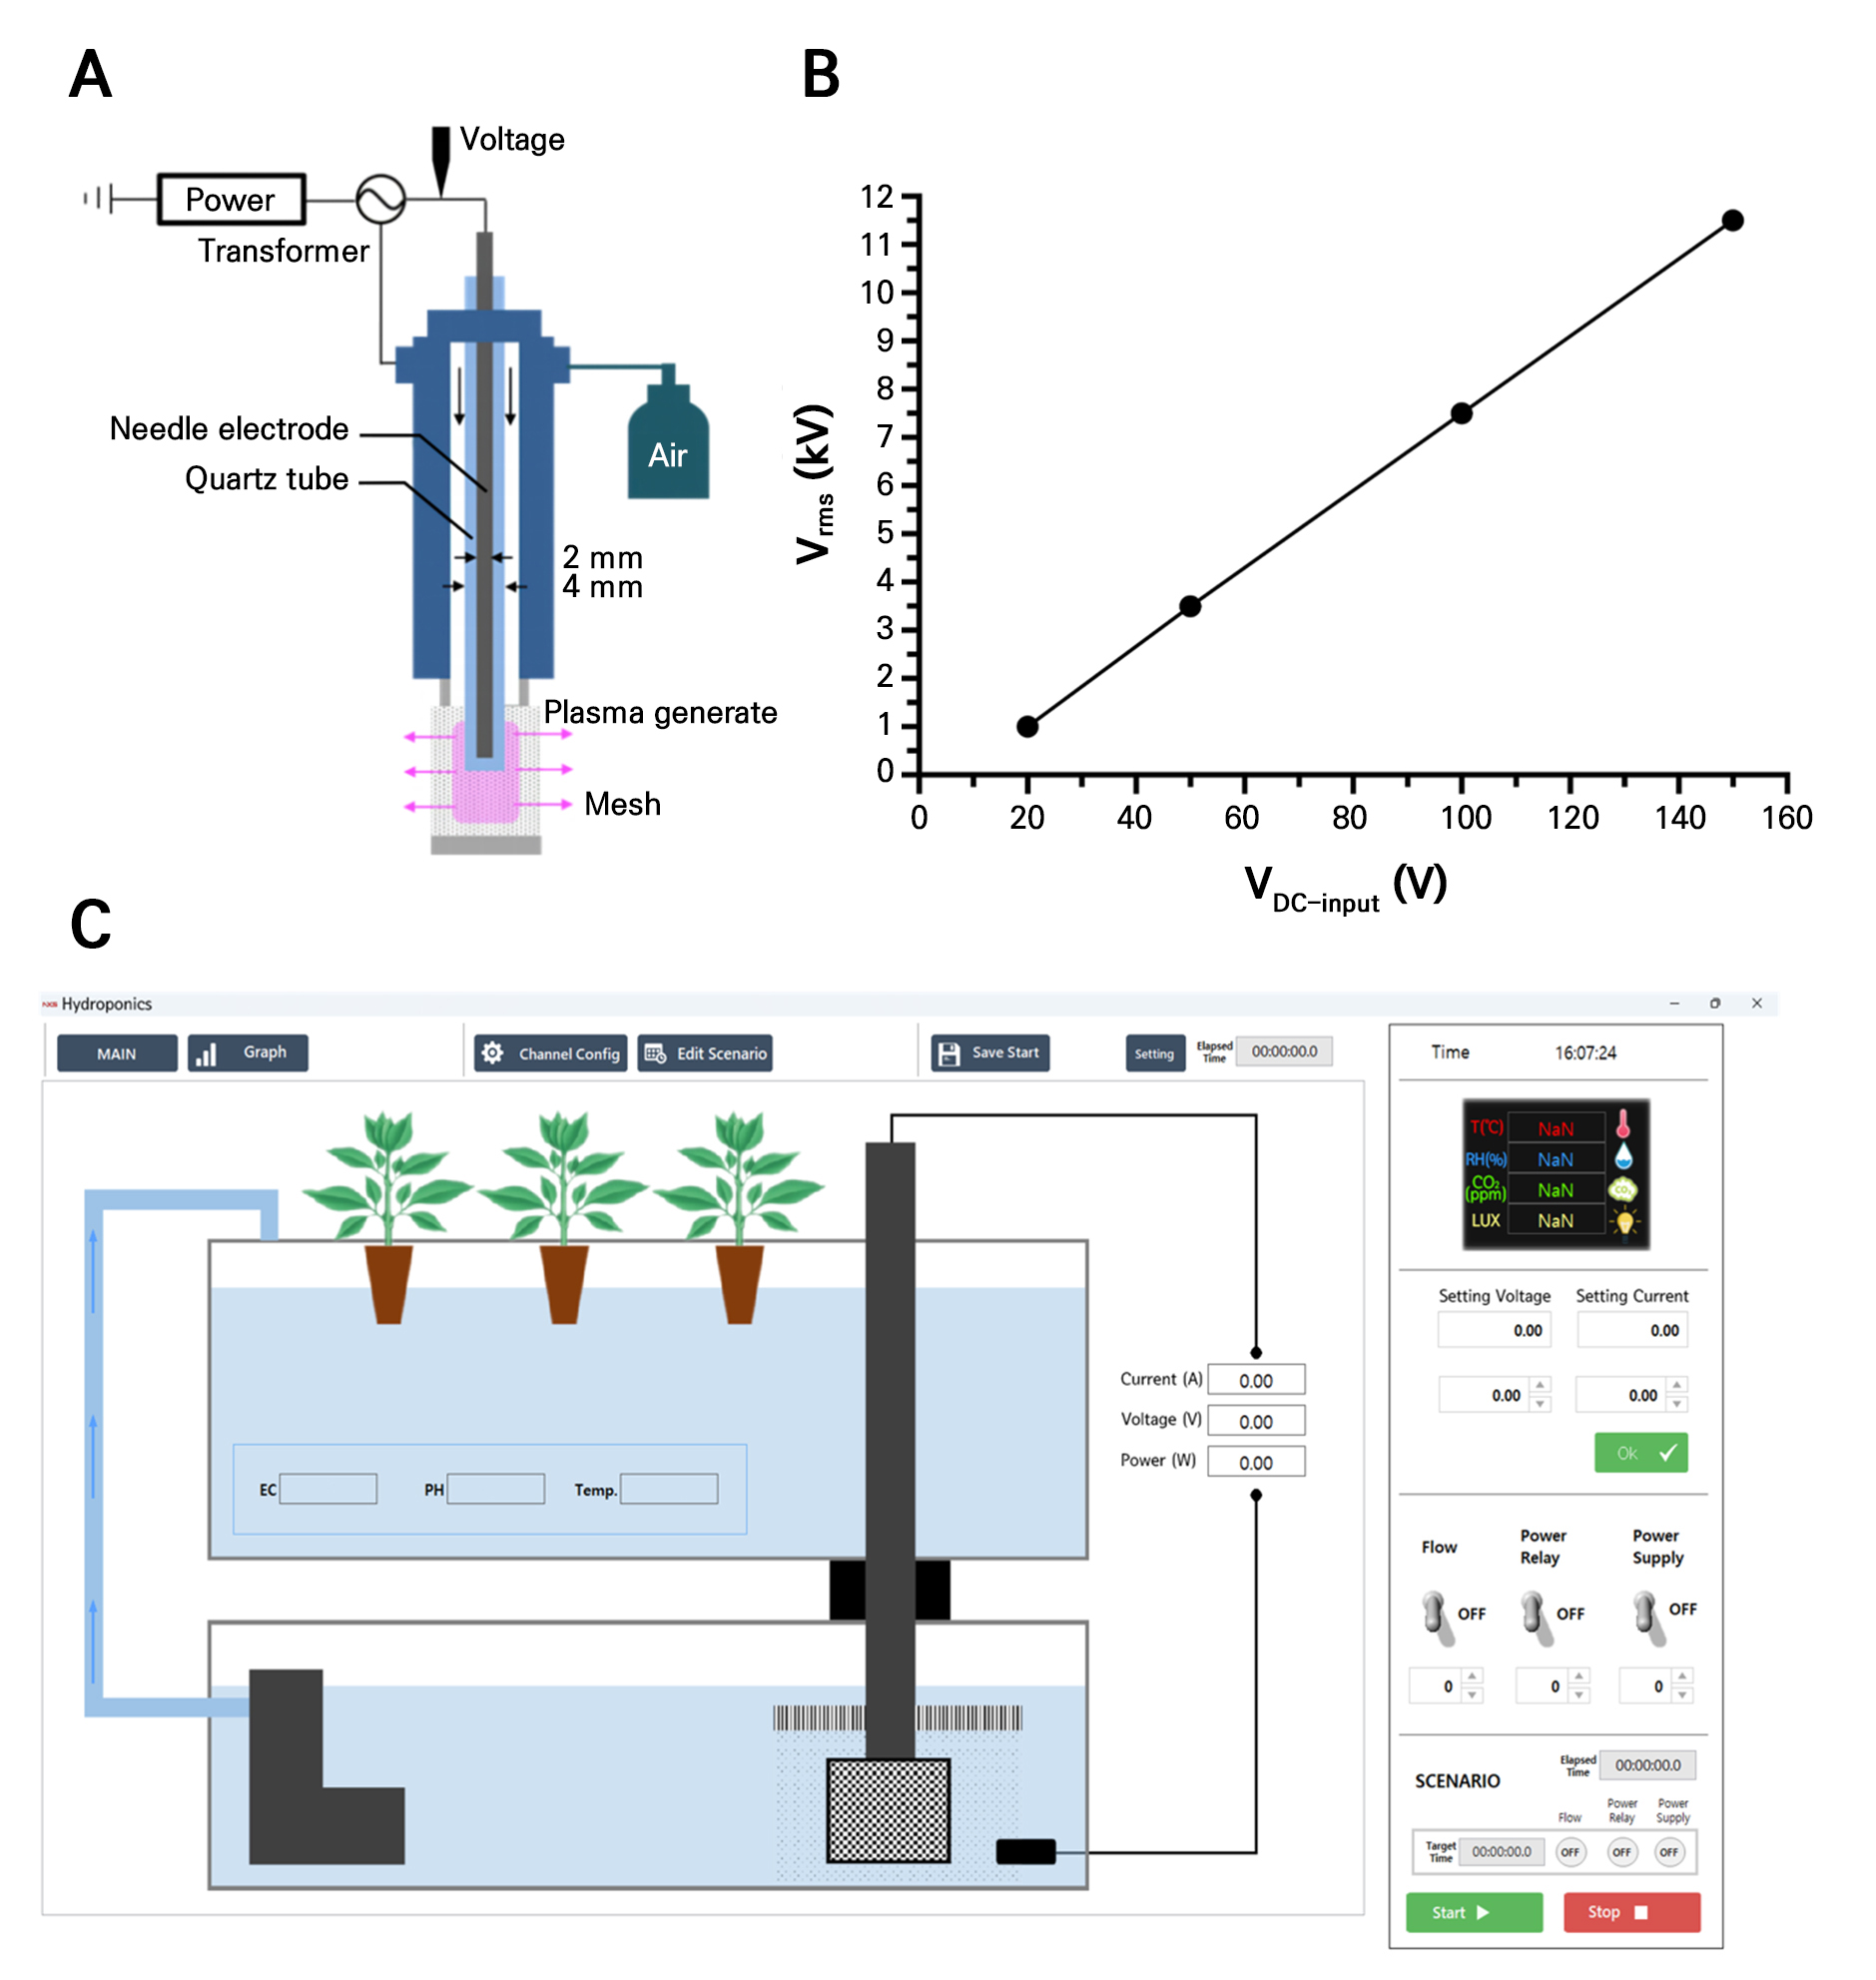
PAW was generated using a corona discharge system, which consisted of an electrode with a radius of 2 mm enclosed within a quartz tube with a radius of 4 mm (Fig. 1A). The voltage required for discharge was amplified using a voltage regulator (NTO-500, NT Electronics, Korea), whereas the input voltage was controlled using a power supply unit (SLI, DBD-Controller, NTO-500, NT Electronics, Korea). The frequency applied for plasma generation was set to 25 kHz, and the maximum voltage used was 4.2 kV (Fig. 1B). The discharge process followed a sine wave pattern, and during corona discharge, air was used as the plasma-forming gas; it was supplied by an air pump with the air flow rate adjusted to 2 L·min-1. The composition of PAW can change over time due to the degradation of reactive species. Therefore, to maintain a stable composition, the plasma device was operated with 500 mL of tap water for 1 h. The freshly prepared PAW was then immediately applied to radish sprout seeds for 0 (control), 10-, 20-, and 30-minute treatments using a plasma system configuration program (Fig. 1C). Inductively coupled plasma mass spectrometry (ICP-MS) and ion chromatography (IC) were used to evaluate the water quality characteristics of the generated PAW. The electrical conductivity (EC) and pH were determined using a portable combined pH/EC/TDS/temperature tester (HI98130; Hanna Instruments, Woonsocket, RI, USA). The ion concentrations and water quality characteristics during the discharge process were assessed using three measurements. Given the possible changes in the composition of PAW over time due to the degradation of reactive species, as mentioned above, in this study, the generated PAW was used immediately after production to minimize such effects. In addition, the water quality characteristics of the generated PAW were analyzed at each time of use using ICP-MS and IC to ensure consistency and minimize compositional changes over time.
Measurement of germination and growth parameters
The experiment was conducted in a plant factory at Chungnam National University (Daejeon, South Korea). Commercially available radish sprout seeds (Raphanus sativus L. ‘Sagyesummer’) were obtained from Asia Seed Co., Ltd., Korea. One hundred seeds were used for each treatment group. The seeds were pre-soaked in tap water for 2 h and then treated with the prepared PAW for 0 (control), 10, 20, and 30 min, representing the different treatments, before being sown in germination trays in a controlled growth chamber. The environmental conditions in the chamber were as follows: a temperature of 24 ± 0.5°C, relative humidity of 75 ± 5%, and light intensity of 80 ± 5 µmol·m-2·s-1. Throughout the experiment, various germination and growth parameters were assessed to evaluate the effects of the PAW treatment. These included the germination rate (GR), germination energy (GE), mean germination time (MGT), germination uniformity (GU), germination speed (GS), and mean daily growth (MDG). After harvesting, shoot and root lengths were determined using a digital caliper (SD500-300PRO; Shin Con Co., Ltd., Korea), and the fresh shoot weight was recorded using an electronic balance (MW-2N; CAS Co., Ltd., Korea). The plant samples were subsequently dried in a hot air oven (HB-501M, Hanbaek Scientific Technology Co., Ltd., Korea) at 70°C for four days, and the shoot dry weight was measured using a microbalance (ARG224 OHAUS, Sigma-Aldrich. Co. LLC, Korea). All measurements were conducted in triplicate with 100 individuals per treatment group.
Determination and analysis of glucosinolate concentrations and contents
For the analysis of glucosinolates, radish sprout shoots harvested after seven days of growth were first subjected to freeze-drying for four days using a freeze dryer (TFD550, Ilshin BioBase Co., Ltd., Korea). The dried materials were ground using a mixer (SMX 800SP, Shinil Co., Ltd., Korea) and pulverized into a fine powder using a mortar and pestle. The powdered sample (100 mg) was transferred to a 2.0 mL microcentrifuge tube, to which 1.5 mL of 70% methanol (v/v) was added. The mixture was vortexed thoroughly and heated in a water bath at 70°C for five minutes to extract the glucosinolates. The resulting solution was centrifuged at 12,000 rpm (13,475 × g; RCF) for ten minutes, and the supernatant was collected. This extraction process was repeated three times. For purification, a mini-column was constructed by plugging the tip of a 1.0 mL pipette tip and packing it with DEAE-Sephadex A-25 resin. The extract was loaded into the column using a Pasteur pipette and washed with 2 mL of ultrapure water to remove residual components. The DEAE-Sephadex resin (30 g) was pretreated by dissolving it in ultrapure water, followed by filtering with an additional 1.5 volume of ultrapure water. Following this step, 0.5 M sodium acetate (68 g·L-1) was added to enhance the ion exchange efficiency. After the washing step, the bottom of the column was sealed using parafilm, and 75 µL of arylsulfatase enzyme was applied to initiate the desulfation reaction. The column was then incubated in the dark at room temperature for 16 hours. After incubation, desulfated glucosinolates (desulfo-GSLs) were collected by eluting the column with ultrapure water (0.5 mL) three times in a 2.0 mL tube. The final eluate was filtered through a 0.45 µm syringe filter and transferred into HPLC vials for analysis. Glucosinolates were quantified using a high-performance liquid chromatography system (1260 Infinity II; Agilent Technologies, United States). Glucosinolates were analyzed according to the ISO 9167 protocol (ISO 2019) with slight modification. Chromatographic separation was achieved using an Inertsil ODS-3 C18 column (150 × 3.0 mm i.d., 3 µm; GL Sciences, Japan). The mobile phase consisted of water (HPLC grade, Duksan Pure Chemical Co, Ltd., Incheon, Korea) as solvent A and acetonitrile (HPLC grade, Duksan Pure Chemical Co, Ltd., Incheon, Korea) as solvent B. Gradient elution was performed as follows: 0–10 min, 1% B; 10–25 min, 1–20% B; 25–40 min, 20–30% B; 40–50 min, 30–1% B, followed by re-equilibration for 10 min. The flow rate, column oven temperature, and injection volume were as follows: 0.4 mL·min-1, 40°C, and 20 µL, respectively. UV detection was carried out at 227 nm, and the total analysis time was 60 min. Glucosinolates were quantified according to the HPLC peak area ratios and with reference to a desulfosinigrin external standard, and glucosinolate contents were expressed as µmol·g-1 dry weight (DW).
Determination and analysis of phenolic acid concentrations and contents
The procedure for analyzing the phenolic acid content followed the same freeze-drying and grinding steps used in the glucosinolate analysis. For each sample in both the control and PAW-treated groups, an amount of 100 mg of powdered radish sprouts was weighed and placed into a 2.0 mL microcentrifuge tube, after which 2.0 mL of 80% methanol (v/v) was added. The samples were sonicated for one hour to facilitate extraction and were subsequently centrifuged at 13,000 rpm (15,814 × g; RCF) for ten minutes. The resulting supernatant was passed through a syringe filter and transferred to an HPLC vial for analysis. Chromatographic separation was achieved using an OptimaPak C18 column (250 mm × 4.6 mm, 5 µm; RS Tech, Daejeon, Korea). The mobile phase consisted of 0.15% (v/v) acetic acid prepared from glacial acetic acid (HPLC grade, ≥99.7%, Fisher Scientific, Belgium) in water (HPLC grade, Duksan Pure Chemical Co, Ltd., Incheon, Korea) as solvent A, and methanol (HPLC grade, 99.9%, HPLC Reagent, Samchun Chemical, Pyeongtaek, Korea) as solvent B. The flow rate and oven temperature were set to 1.0 mL·min-1 and 30°C, respectively. The gradient conditions were as follows: 0–1 min, 95% A/5% B; 1–4 min, linear to 85% A/15% B (held until 9 min); 9–14 min, linear to 80% A/20% B (held until 24 min); 24–54 min, linear to 70% A/30% B; 54–55 min, linear to 55% A/45% B (held until 65 min); 65–75 min, linear to 44% A/56% B; 75–77 min, linear to 40% A/60% B (held until 79 min); 79–80 min, linear to 20% A/80% B (held until 90 min); 90–91 min, linear to 95% A/5% B (re-equilibration held until 98 min). The injection volume was 20 µL, and chromatograms were recorded at 280 nm for quantification. Calibration curves were prepared using authentic standards of chlorogenic acid, benzoic acid, epicatechin, and trans-cinnamic acid. Results were expressed as mg·g-1 dry weight (DW).
Statistical analysis
Statistical analysis of the growth parameters and secondary metabolites was conducted using SPSS software (Version 29.0.1.0, IBM Corp., Armonk, NY, USA). Significant differences in the mean values between the treatments were determined using Tukey’s multiple comparison test (p < 0.05). To model the relationships between the PAW treatment time and metabolite concentrations, nonlinear regression was fitted, and the goodness of fit was evaluated by R2. Graphs and regressions were generated in GraphPad Prism version 10 (GraphPad Software, San Diego, CA, USA).
Results
Change in the properties of PAW
The electrical conductivity (EC) increased significantly with an increase in the plasma treatment time, reaching 0.28 dS·m-1 in the 30-minute treatment, resulting in a 1.75-fold significant increase compared to tap water (Table 1). The pH exhibited a significant decrease as the plasma treatment time increased, with a value of 7.24 measured at the 30-minute treatment, indicating a significant 4.9% reduction compared to tap water. The NO2‒ concentration for the 20- and 30-minute treatments reached 0.030 mg·L-1, showing a significant 275.0% increase compared to tap water. Similarly, the NO3‒ concentration increased significantly with an increase in the plasma treatment time, reaching 45.01 mg·L-1 in the 30-minute treatment, which resulted in a significant 4.98-fold increase compared to tap water. The H2O2 concentration in tap water was 0.006 mg·L-1, and it increased tenfold with the 30-minute treatment, reaching 0.060 mg·L-1.
Table 1.
Physicochemical properties of TW and PAW treated for different times (10, 20, and 30 minutes)
| Water type | EC (dS·m-1) | pH | NO2‒ (mg·L-1) | NO3‒ (mg·L-1) | H2O2 (mg·L-1) |
| TW | 0.16 ± 0.00 d | 7.62 ± 0.00 a | 0.0080 ± 0.001 b | 9.04 ± 0.06 b | 0.0060 ± 0.000 c |
| PAW 10 min | 0.25 ± 0.00 c | 7.45 ± 0.01 b | 0.0280 ± 0.002 a | 41.10 ± 1.15 a | 0.0480 ± 0.003 b |
| PAW 20 min | 0.26 ± 0.01 b | 7.31 ± 0.02 c | 0.0300 ± 0.002 a | 43.40 ± 1.64 a | 0.0520 ± 0.003 ab |
| PAW 30 min | 0.28 ± 0.01 a | 7.24 ± 0.01 d | 0.0300 ± 0.002 a | 45.01 ± 1.86 a | 0.0600 ± 0.003 a |
| Significantz | *** | *** | *** | *** | *** |
zsignificant at *p < 0.05, **p < 0.01, and ***p < 0.001. Data are presented as the mean ± standard error (SE) and are the mean of three measurements (n = 3). Different letters indicate significant differences among the treatments at the 5% level (p < 0.05), according to Tukey’s multiple comparison test.
Germination of radish sprouts according to the PAW treatment time
The cumulative germination and final germination percentage (FGP) increased significantly with an increase in the PAW treatment time (Fig. 2 and Table 2). On the first day of germination, the cumulative germination values for the control and the 10, 20, and 30-minute treatments were 25.7%, 32.7%, 42.7%, and 55.0%, respectively. Compared with the control, cumulative germination was significantly increased by 27.2%, 66.2%, and 114.0% in the 10-, 20-, and 30-minute treatments, respectively. On harvest day (day 7), there was no significant difference between the 20- and 30-minute treatments, with FGP of 91.7% and 93.0%, respectively (Table 2). However, these values were significantly higher than those of the control by 18.0% and 19.7%, respectively. The germination energy (GE) was calculated based on the total number of seeds that germinated within four days, showing a trend similar to that of GR. As the PAW treatment time increased, the GE values increased significantly. In particular, the 30-minute treatment exhibited the highest GE value of 91.33, significantly higher than that of the control. The mean germination time (MGT) decreased as the PAW treatment time was increased, indicating accelerated germination. No significant differences were observed between the 10- and 20-minute treatments. The germination speed (GS) was significantly higher in the 20-minute treatment than in the 10-minute treatment, showing a 14.5% increase compared to the 10-minute treatment. The fastest FGP was observed in the 30-minute treatment, which was significantly higher than that of the control by 52.8%. However, the control group exhibited the lowest MDG value of 11.1, which was significantly lower than that of the PAW treatment groups.
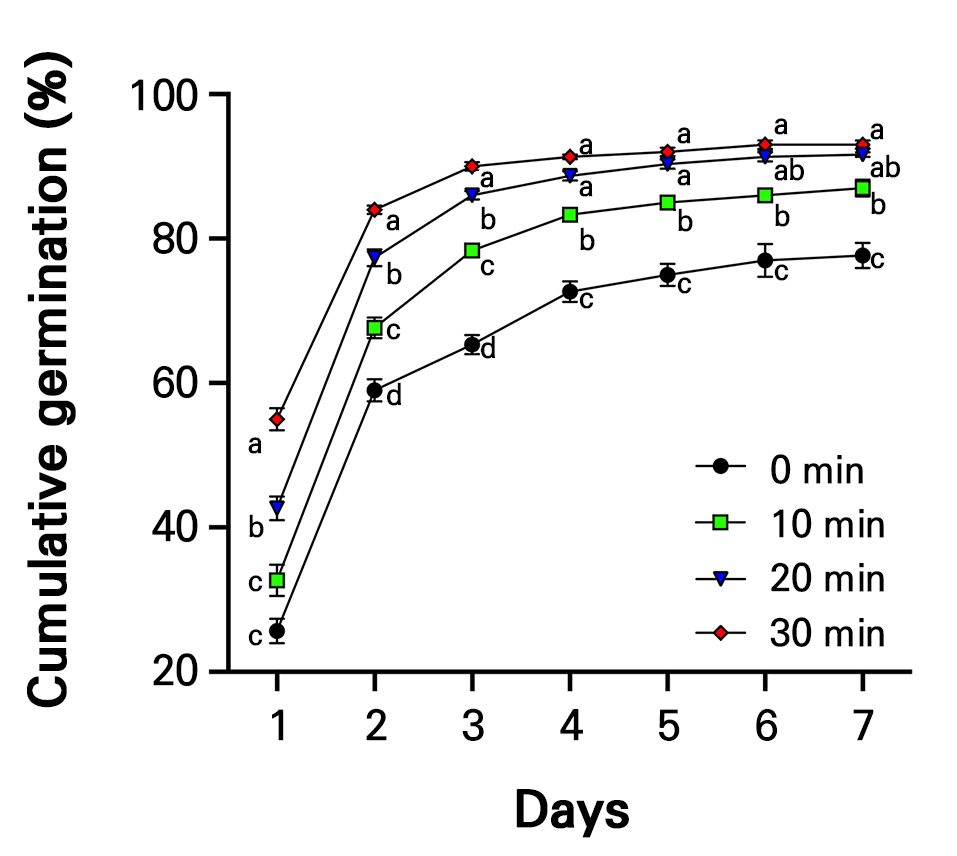
Fig. 2.
Changes in the cumulative germination of radish sprouts treated with plasma-activated water (PAW) for different treatment times over seven days are shown. A total of 100 plant samples were used per treatment group, and the experiment was independently repeated three times. Data are presented as the mean, and error bars indicate the standard error (SE, n = 3). Different letters within the graph indicate significant differences among treatment groups for each day, as determined by Tukey’s multiple comparison test at a significance level of 5% (p < 0.05).
Table 2.
Effects of different PAW treatment times (0, 10, 20, and 30 minutes) on seed germination parameters
|
PAW treatment time (minute) | Germination | ||||
| FGP (%) | GE | MGT | GS | MDG | |
| 0 | 77.70 ± 1.80 c | 72.60 ± 1.50 c | 1.88 ± 0.03 c | 47.17 ± 0.92 d | 11.10 ± 0.25 b |
| 10 | 87.00 ± 1.20 b | 83.00 ± 0.30 b | 1.69 ± 0.06 b | 56.00 ± 1.28 c | 12.71 ± 0.41 a |
| 20 | 91.70 ± 0.30 ab | 88.67 ± 0.70 a | 1.65 ± 0.01 b | 64.10 ± 0.90 b | 13.10 ± 0.05 a |
| 30 | 93.00 ± 0.60 a | 91.33 ± 0.30 a | 1.44 ± 0.01 a | 72.08 ± 0.61 a | 13.29 ± 0.06 a |
| Significantz | *** | *** | *** | *** | *** |
PAW: plasma-activated water; FGP: final germination percentage; GE: germination energy; MGT: mean germination time; GS: germination speed; MDG: mean daily growth.
zsignificant at *p < 0.05, **p < 0.01, and ***p < 0.001 Data are presented as the mean ± standard error (SE) and are the mean of three measurements (n = 3). Different letters indicate significant differences among the treatments at the 5% level (p < 0.05), according to Tukey’s multiple comparison test.
Plant growth parameters
The shoot fresh weight showed no significant difference between the control and the 10-minute PAW treatment, but it decreased significantly to 0.18 g in the 20- and 30-minute treatments. The shoot dry weight was not significantly different between the control and the PAW treatment time groups. The shoot length and root length decreased significantly with an increase in the treatment time compared to the control. In the 30-minute treatment, the shoot length and root length were 3.77 cm and 2.12 cm, respectively, representing reductions of 17.7% and 59.5% compared to the control. The S/R length ratio increased significantly with longer treatment times, reaching a maximum value of 1.82, which was observed in the 30-minute treatment, corresponding to a significant 1.94-fold increase compared to the control. Regarding the shoot water content, longer treatment times reduced the shoot water content. The 10- and 20-minute treatments showed no significant differences from the control, with a water content of 91.7%, whereas the 30-minute treatment resulted in a water content of 88.2%, which was 4.0% lower.
Glucosinolate concentrations and contents
The analysis of the total and individual glucosinolate concentrations and contents in radish sprouts identified three types of aliphatic glucosinolates (progoitrin, sinigrin, and gluconapin) and three types of indolic glucosinolates (4-hydroxyglucobrassicin, 4-methoxyglucobrassicin, neoglucobrassicin, and glucobrassicin), all of which were detected in both the control and PAW treatment time groups. The nonlinear regression analysis showed that the PAW treatment duration was positively correlated with the accumulation of most glucosinolates. Significant differences in the concentrations and contents were observed between the control and PAW treatment time groups. The concentration of progoitrin was highest in the 30-minute treatment (1.11 µmol·g-1·DW) and lowest in the control (0.91 µmol·g-1·DW), indicating a significant 1.22-fold increase compared to the control (Fig. 3A). Sinigrin accumulation was also highest in the 30-minute treatment (16.05 µmol·g-1·DW) and lowest in the 10-minute treatment (11.80 µmol·g-1·DW), with the 30-minute treatment showing a significant 19.5% increase compared to the control (Fig. 3C). Significant increases in the gluconapin concentration were observed in the 20-minute (28.19 µmol·g-1·DW) and 30-minute (29.84 µmol·g-1·DW) treatments compared to the control, whereas the 10-minute treatment showed no significant difference (Fig. 3E). The 4-hydroxyglucobrassicin concentration was also higher in the PAW treatment time groups than in the control. However, no significant differences were observed among the treatments (Fig. 3G). In the 30-minute treatment, the progoitrin content was 0.024 µmol/plant DW, showing significant increases of 28.4%, 28.1%, and 24.9% compared to the control, 10-, and 20-minute treatments, respectively (Fig. 3B). The 30-minute treatment accumulated the highest sinigrin content (0.338 µmol/plant DW), whereas the 10-minute treatment exhibited a lower value than the control (0.027 µmol/plant DW) (Fig. 3D). The gluconapin content showed a positive correlation with an increase in the PAW treatment time, with the 30-minute treatment exhibiting a 1.48-fold increase, at 0.0027 µmol/plant DW, compared to the control (Fig. 3F). The 4-hydroxyglucobrassicin content showed no significant differences among the control, 10-, and 20-minute treatments; however, the 30-minute (0.021 µmol/plant DW) treatment exhibited the highest content (Fig. 3H).
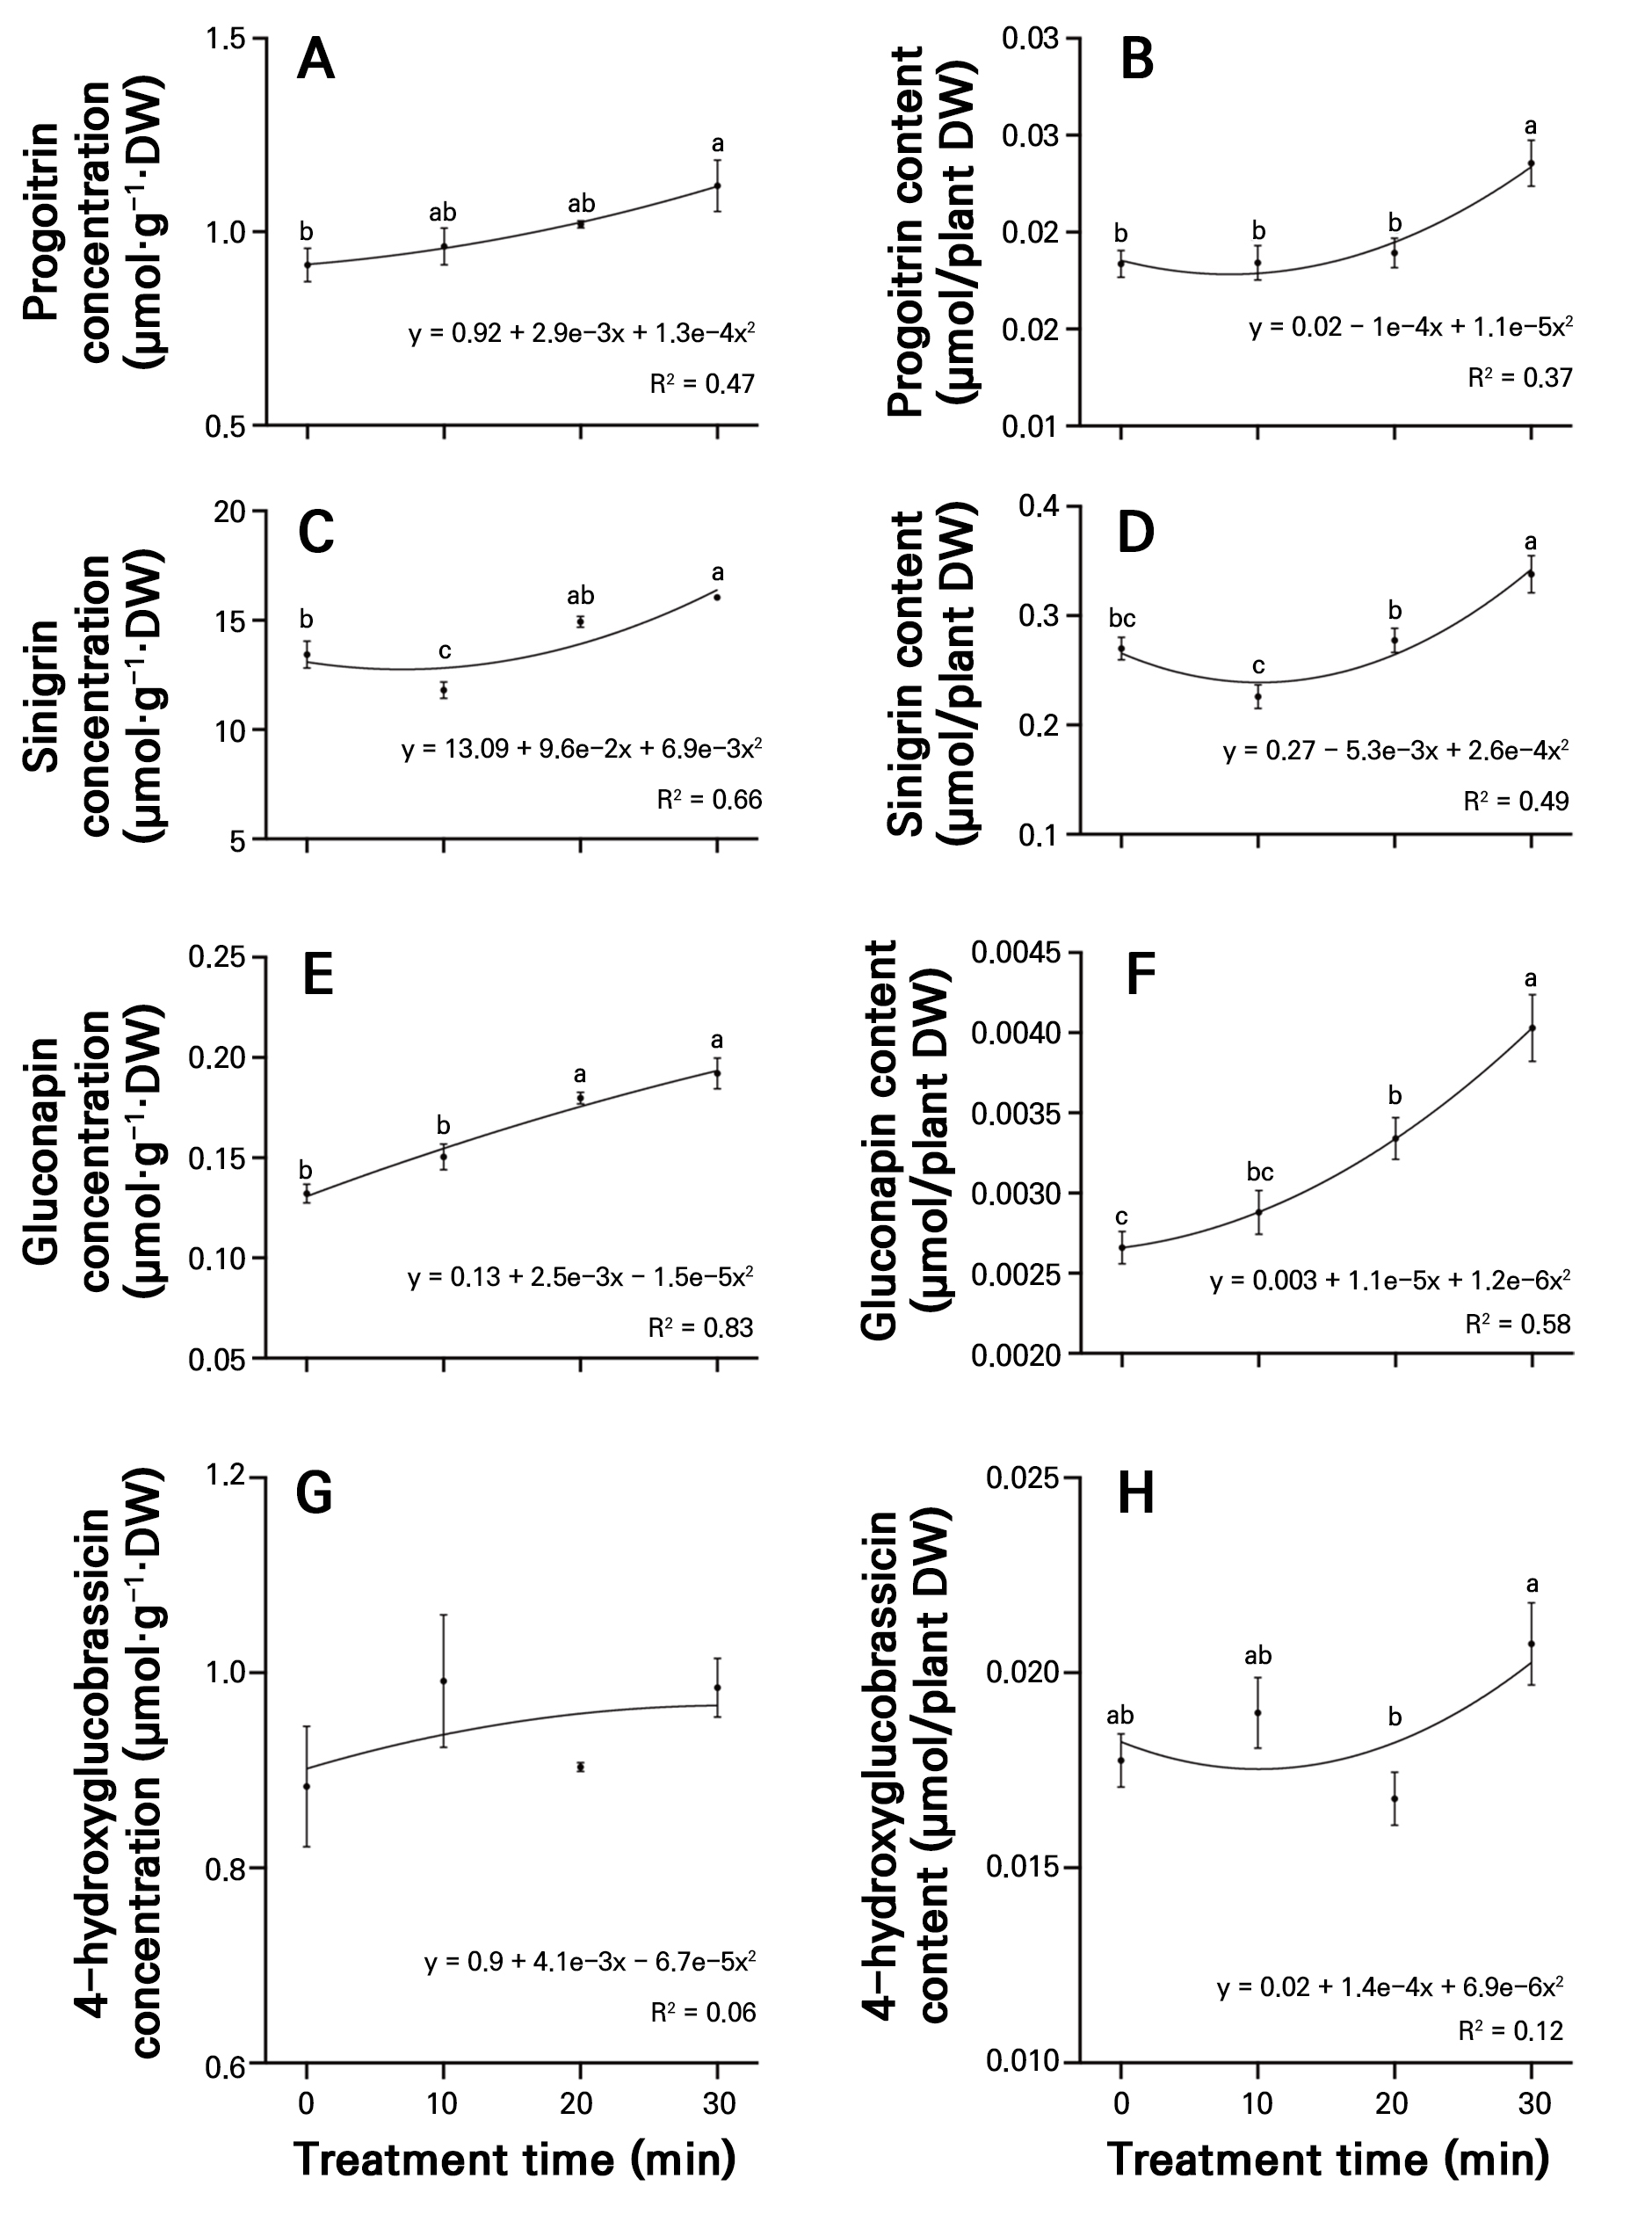
Fig. 3.
Concentrations of progoitrin (A), sinigrin (C), gluconapin (E), and 4-hydroxyglucobrassicin (G), and content of progoitrin (B), sinigrin (D), gluconapin (F), and 4-hydroxyglucobrassicin (H) in radish sprouts treated with different plasma-activated water (PAW) treatments over seven days. Data are presented as mean values using point plots, with error bars representing the standard error (SE, n = 4). Each sample was extracted four times. Different letters indicate significant differences among the data groups, as analyzed using Tukey’s multiple comparison test at a significance level of 5% (p < 0.05).
Compared to the control, the neoglucobrassicin concentration gradually increased with the PAW treatment time, with the 20- and 30-minute treatments exhibiting significant increases of 1.17-fold and 1.22-fold, respectively (Fig. 4A). The 30-minute treatment exhibited the highest glucobrassicin concentration (29.00 µmol·g-1·DW), representing a significant 2.85% increase compared to the control (Fig. 4C). The 4-methoxyglucobrassicin concentration in the control was 1.06 µmol·g-1·DW, while the 20- and 30-minute treatments presented significant increases of 34.43% and 40.20%, respectively (Fig. 4E). The 30-minute treatment showed the highest total glucosinolate concentration (49.26 µmol·g-1·DW), showing a significant 1.1-fold increase compared to the control (Fig. 4G). The contents of neoglucobrassicin and 4-methoxyglucobrassicin increased with an increase in the plasma treatment time, reaching 0.0093 and 0.0312 µmol/plant DW, respectively, in the 30-minute treatment (Fig. 4B and 4F), representing significant increases of 27.4% and 46.48% compared to the control. No significant differences in the glucobrassicin content were observed between the control and PAW treatment time groups (Fig. 4D). Regarding the total glucosinolate content, the 30-minute treatment exhibited the highest value (1.038 µmol/plant DW), but no significant difference was observed compared to the control (Fig. 4H).
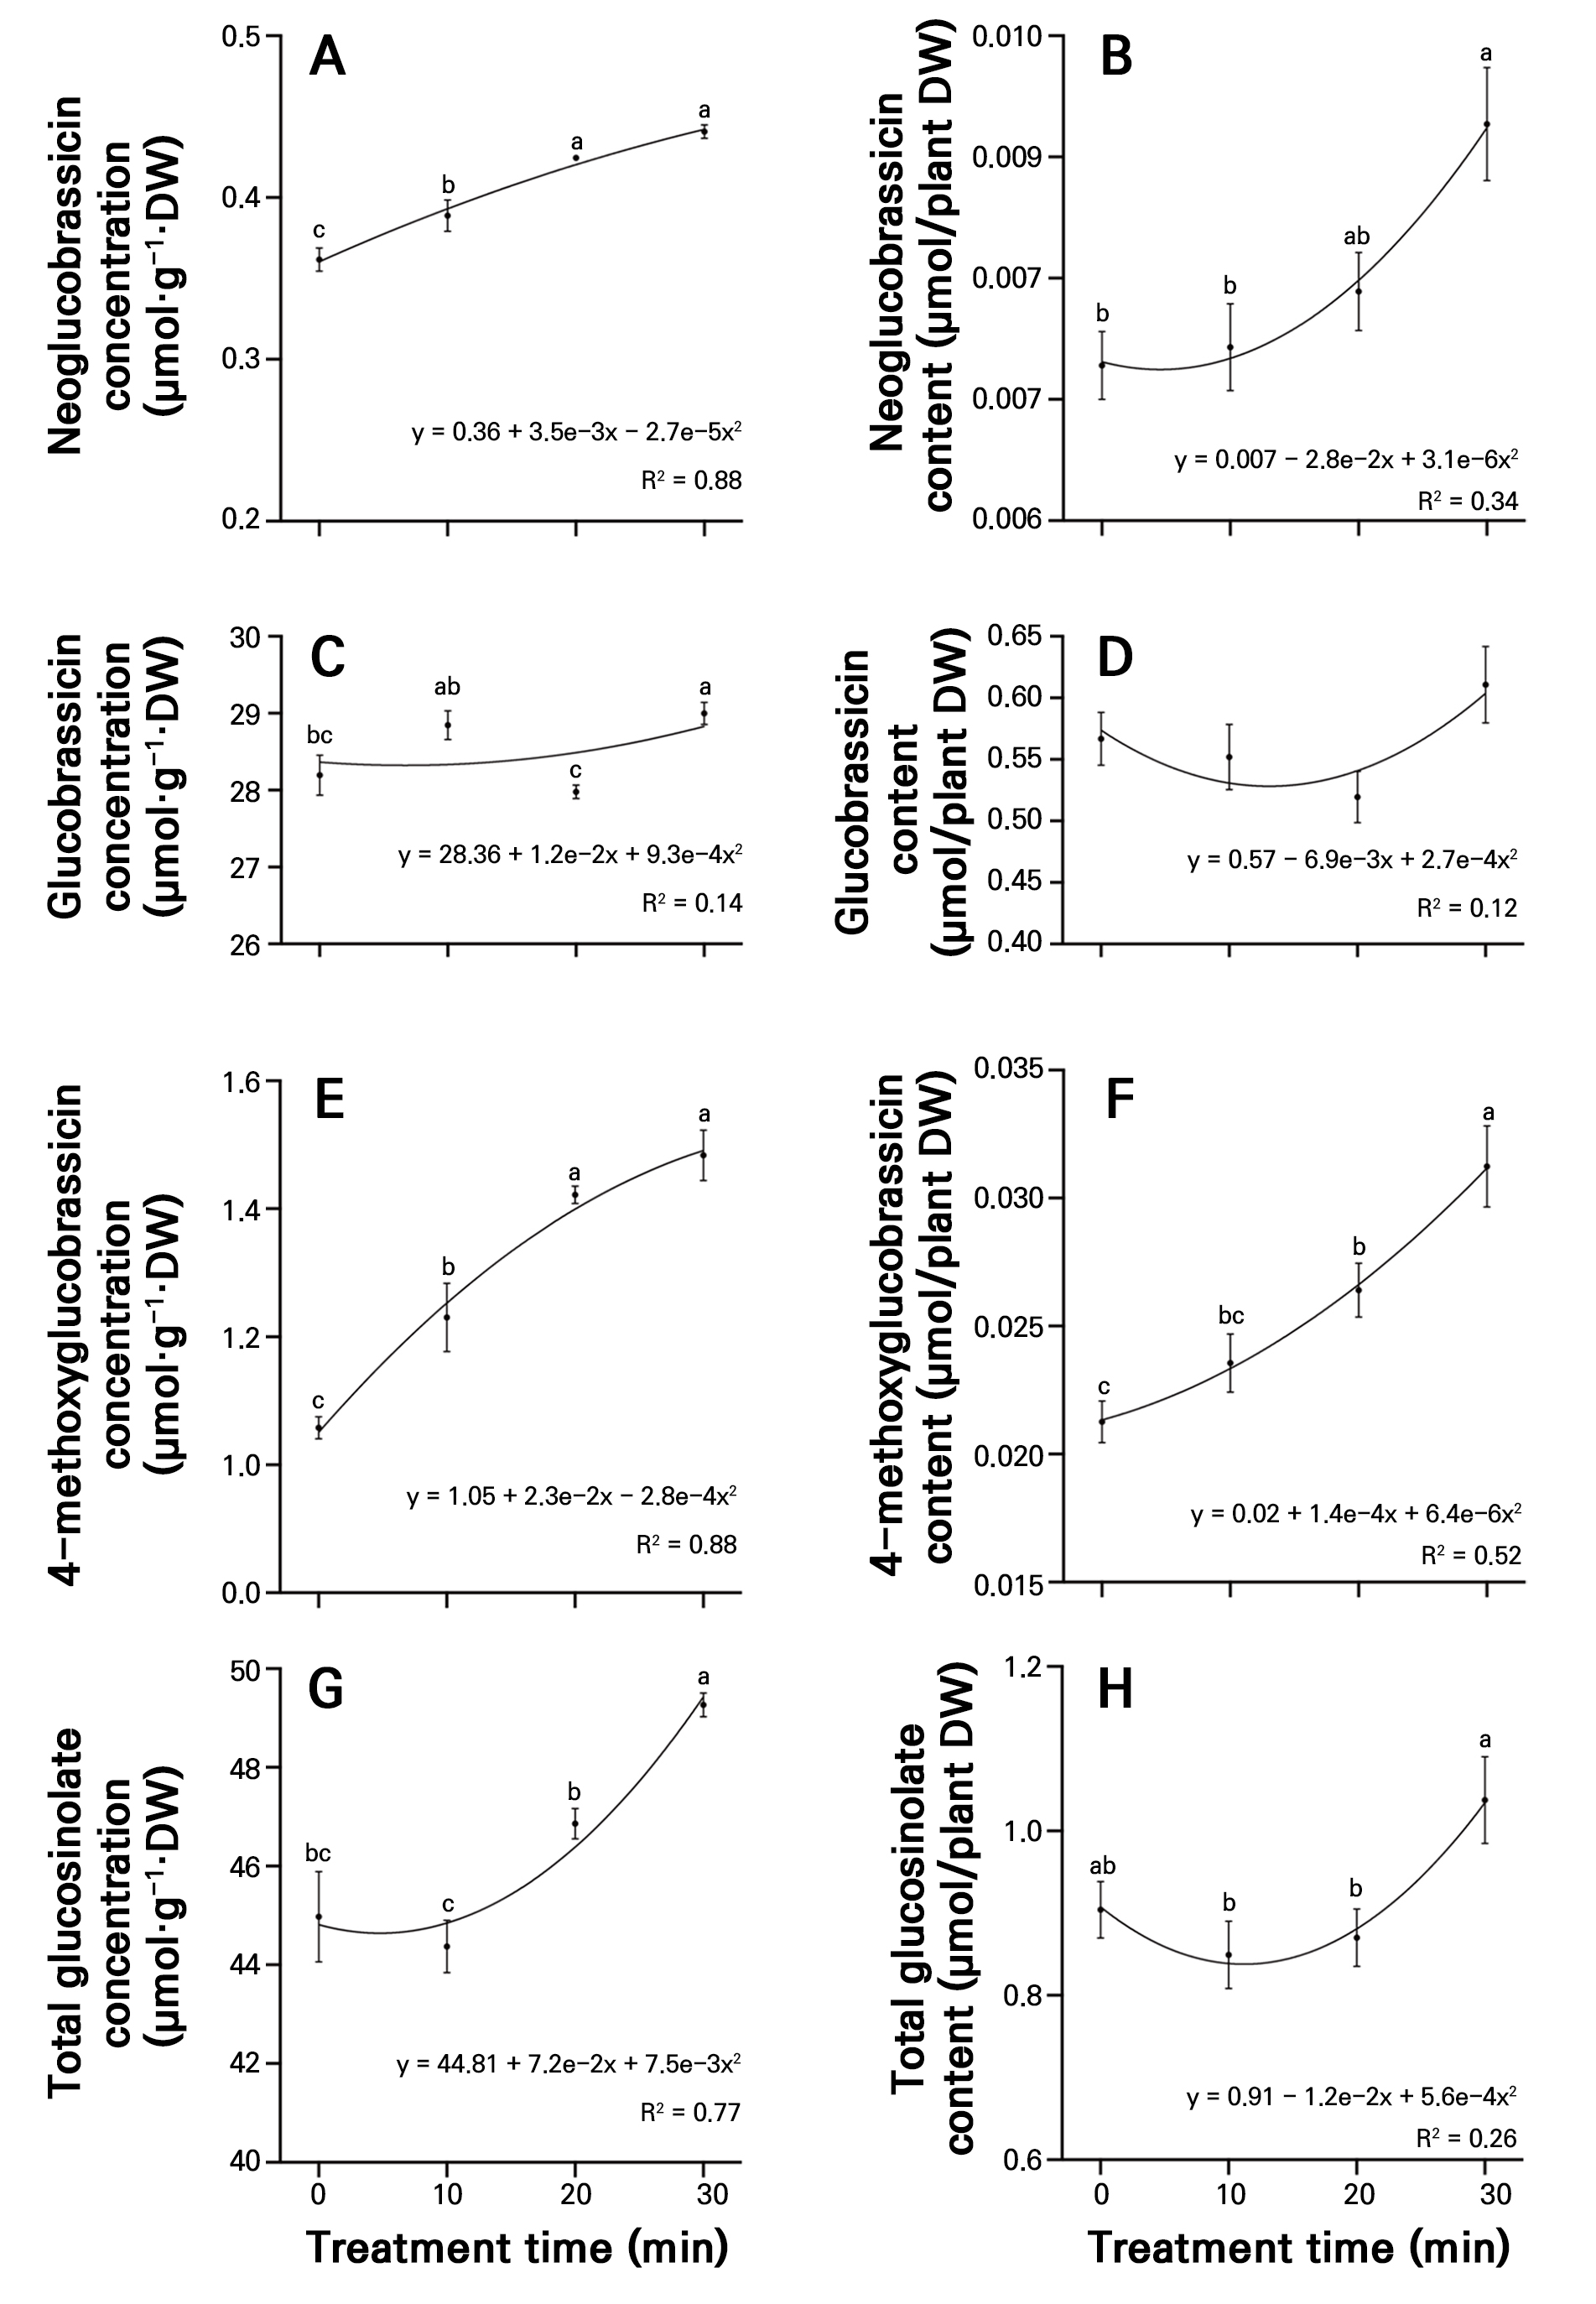
Fig. 4.
Concentrations of neoglucobrassicin (A), glucobrassicin (C), 4-methoxyglucobrassicin (E), and total glucosinolate (G), and content of neoglucobrassicin (B), glucobrassicin (D), 4-methoxyglucobrassicin (F), and total glucosinolate (H) in radish sprouts treated with different plasma-activated water (PAW) treatments over seven days. Data are presented as mean values using point plots, with error bars representing the standard error (SE, n = 4). Each sample was extracted four times. Different letters indicate significant differences among the data groups, as analyzed using Tukey’s multiple comparison test at a significance level of 5% (p < 0.05).
Phenolic acid concentrations and contents
The chlorogenic acid, benzoic acid, epicatechin, trans-cinnamic acid, rutin, and total phenolic acid concentrations and contents were assessed in both the control and PAW treatment time groups. A nonlinear regression analysis showed that the PAW treatment duration was positively associated with the accumulation of most phenolic acids, including chlorogenic acid, benzoic acid, epicatechin, trans-cinnamic acid, and total phenolic acids. The chlorogenic acid concentration in radish sprouts was significantly higher in the 30-minute treatment, at 0.221 mg·g-1·DW, representing a 121.1% increase compared to the control (Fig. 5A). The benzoic acid concentration increased significantly with longer treatment times. The control exhibited a benzoic acid concentration of 0.113 mg·g-1·DW, while the 10-, 20-, and 30-minute treatments exhibited significant increases of 133.6%, 319.5%, and 693.7%, respectively, compared to the control (Fig. 5C). The epicatechin concentration was highest in the 30-minute treatment, reaching 0.191 mg·g-1·DW, which was significantly higher than the control and other treatment groups (Fig. 5E). The chlorogenic acid content in the 10-, 20-, and 30-minute treatments were 1.50-, 1.45-, and 2.32-fold higher, respectively, compared to the control, showing a significant increasing trend with longer treatment times (Fig. 5B). Similarly, the benzoic acid content also exhibited a significant increasing trend with longer plasma treatment durations (Fig. 5D). The epicatechin content showed no significant differences among the control, 10- and 20-minute treatments. However, the 30-minute treatment showed a significantly higher content (0.0040 µmol/plant DW) than the control and the other treatment groups (Fig. 5F).
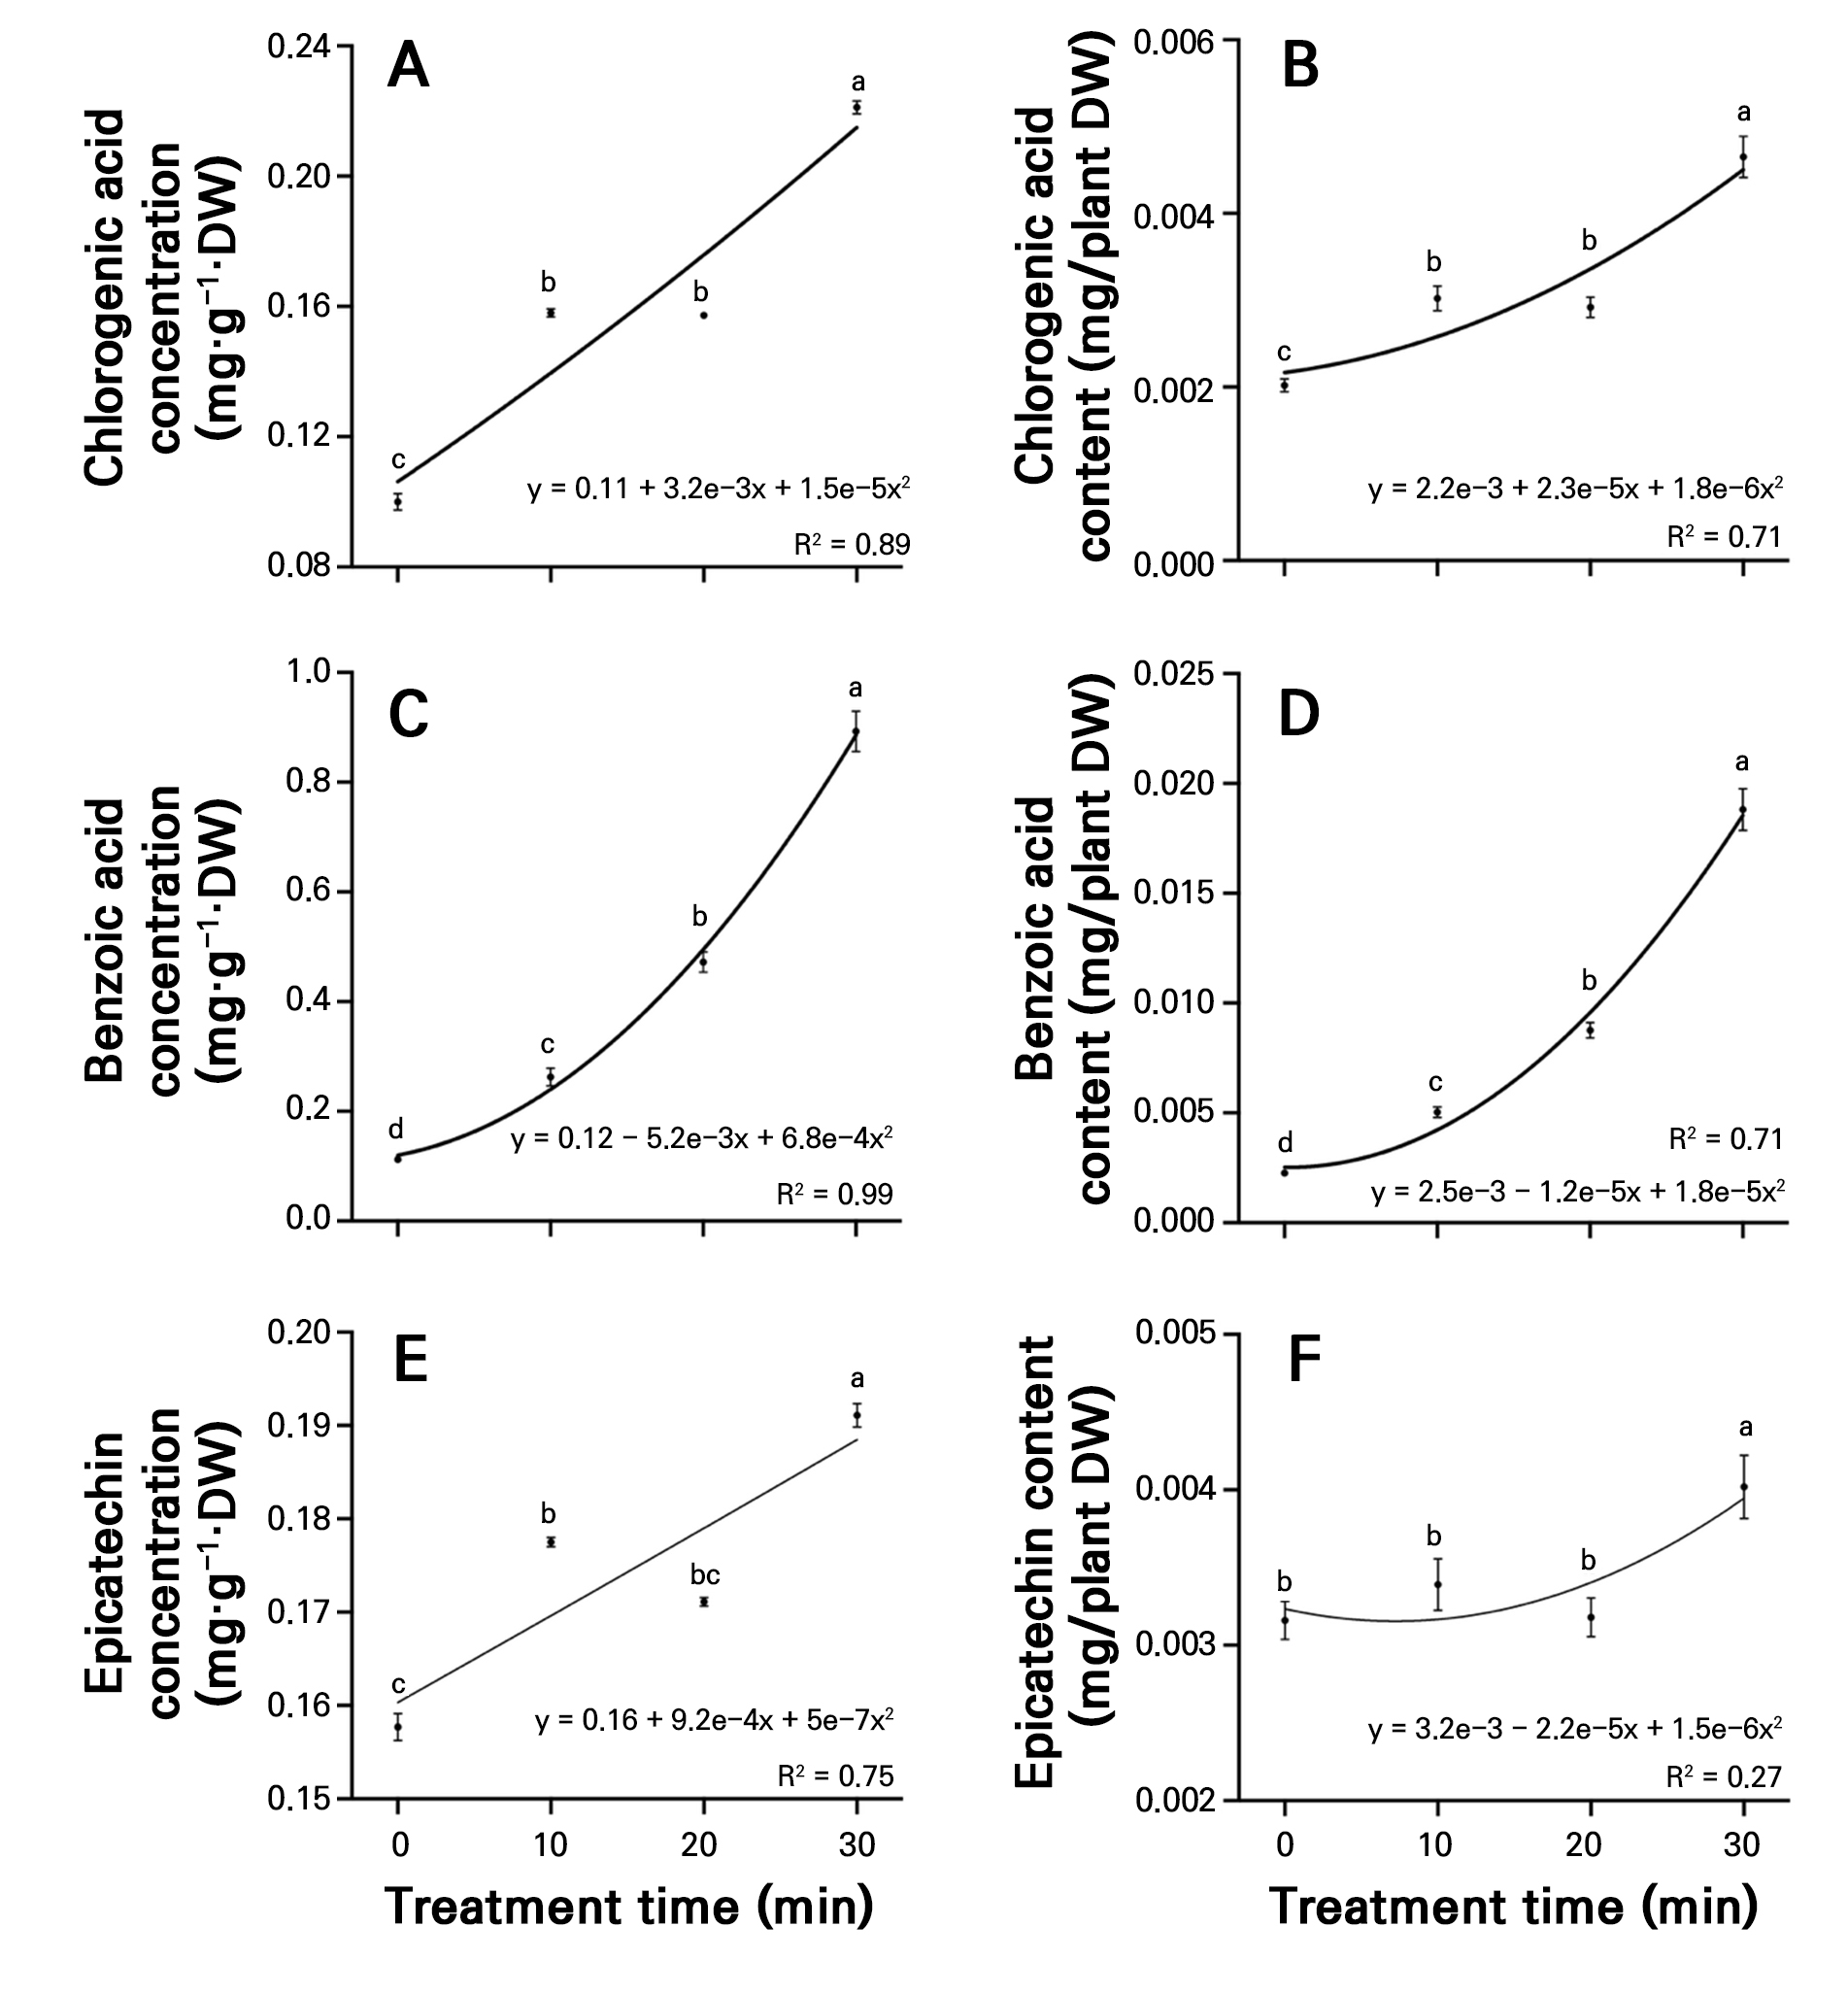
Fig. 5.
Concentrations of chlorogenic acid (A), benzoic acid (C), and epicatechin (E), and content of chlorogenic acid (B), benzoic acid (D), and epicatechin (F) in radish sprouts treated with different plasma-activated water (PAW) treatments over seven days. Data are presented as mean values using point plots, with error bars representing the standard error (SE, n = 4). Each sample was extracted four times. Different letters indicate significant differences among the data groups, as analyzed using Tukey’s multiple comparison test at a significance level of 5% (p < 0.05).
The trans-cinnamic acid concentration significantly increased progressively with longer treatment times, reaching 0.0084 mg·g-1·DW in the 30-minute treatment, representing a 69.5% significant increase compared to the control (Fig. 6A). The total phenolic concentration in the control was 0.474 mg·g-1·DW, while the 10-, 20-, and 30-minute treatments showed concentrations of 0.846, 1.050, and 1.560 mg·g-1·DW, respectively, showing significant 1.8-, 2.2-, and 3.3-fold increases with longer treatment times (Fig. 6C). The trans-cinnamic acid and total phenolic content in the 30-minute treatment exhibited significantly higher values than the control and the 10- and 20-minute treatments, with increases of 77.6% and 245.0%, respectively, compared to the control (Fig. 6B and 6D).
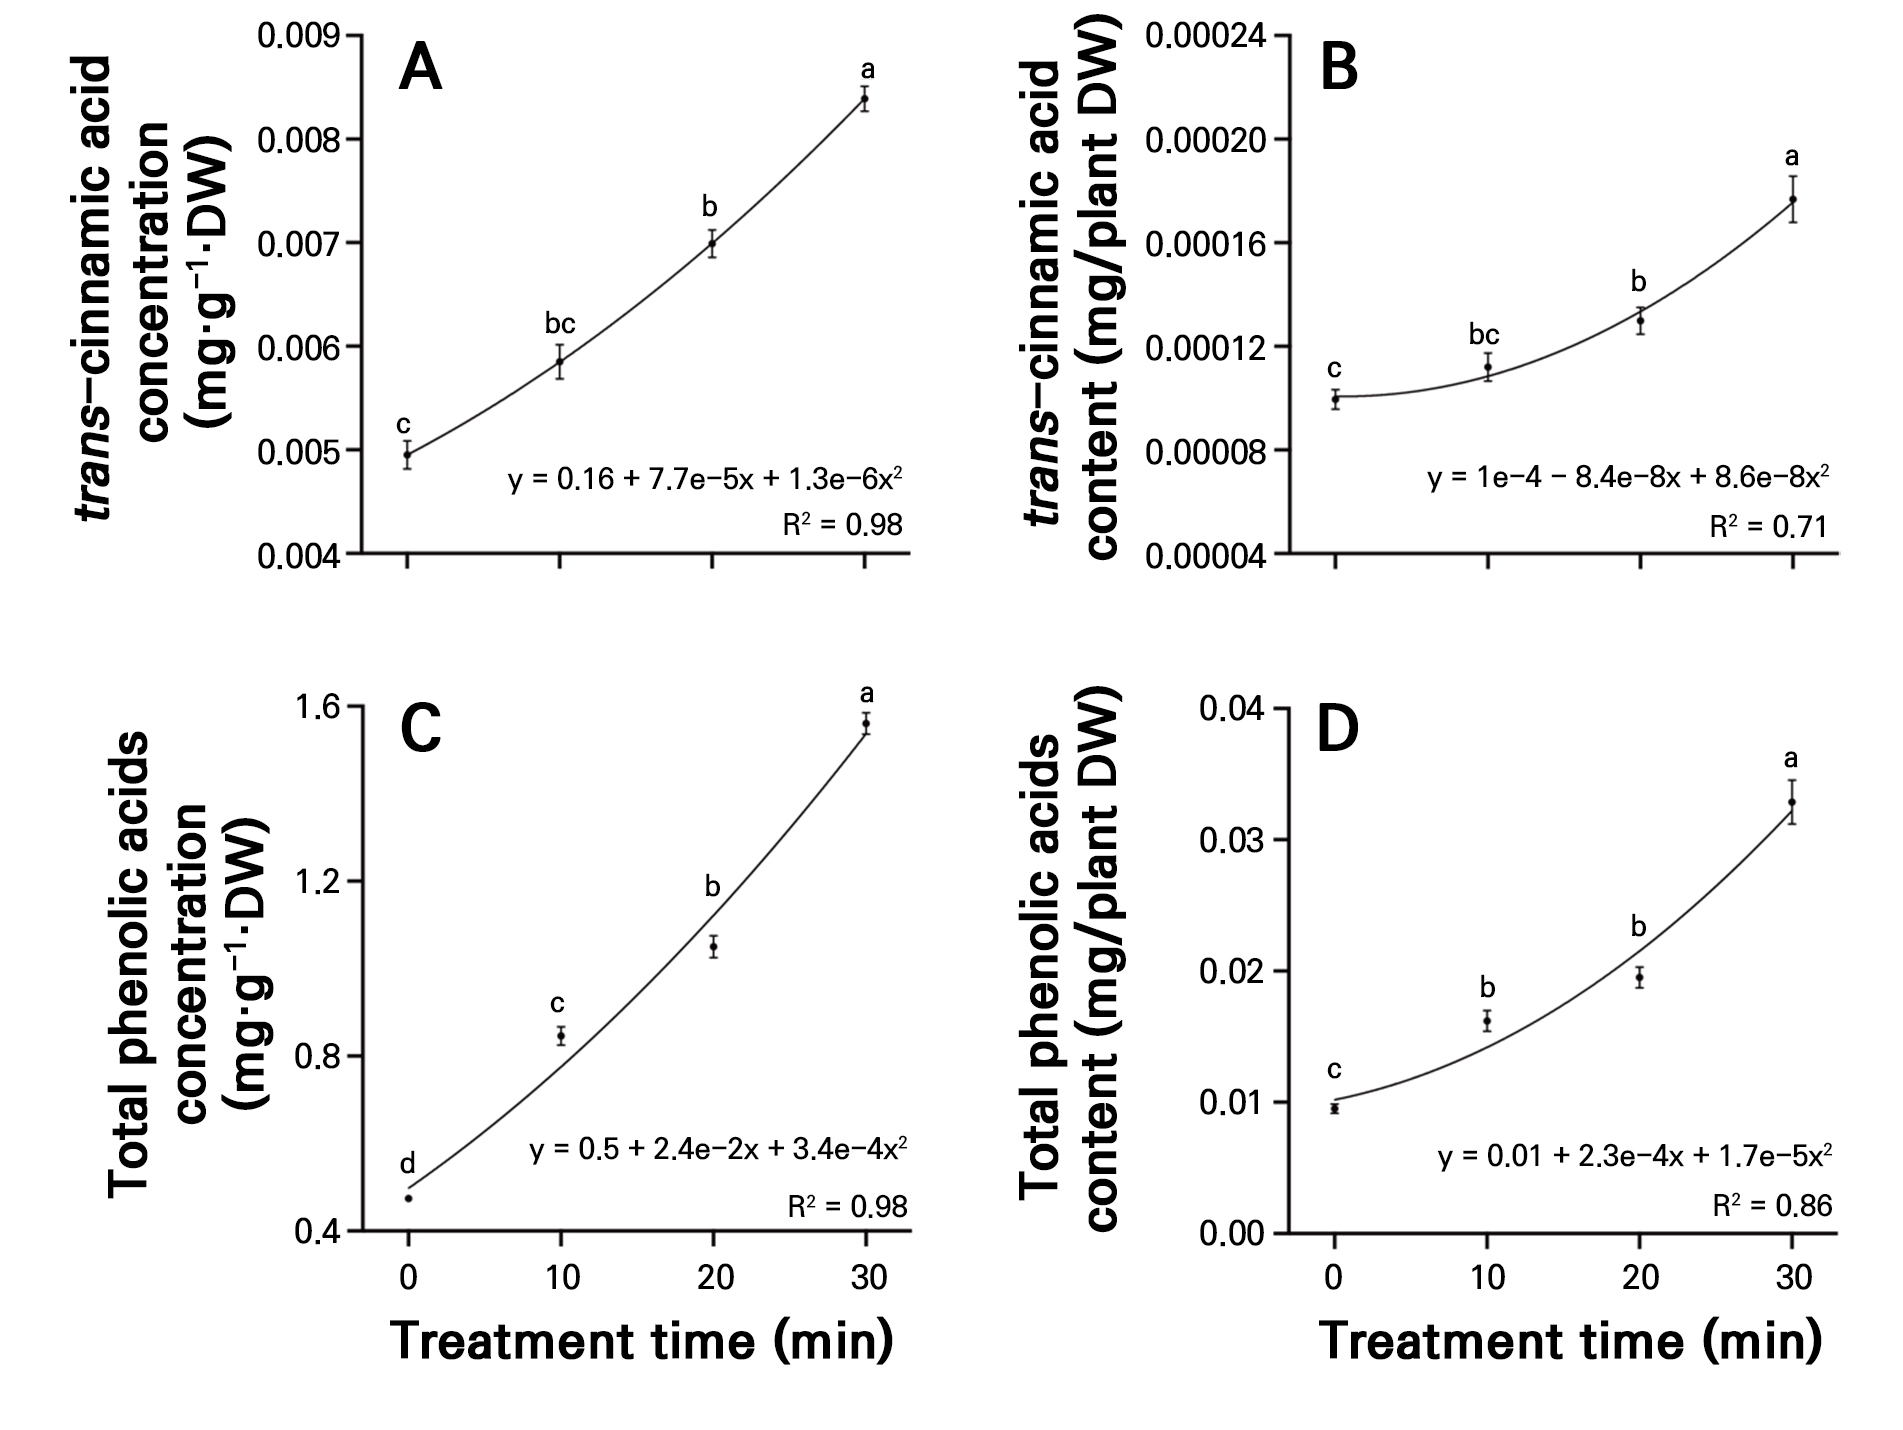
Fig. 6.
Concentrations of trans-cinnamic acid (A) and total phenolic acids (C), and content of trans-cinnamic acid (B), and total phenolic acids (D) in radish sprouts treated with different plasma-activated water (PAW) treatments over seven days. Data are presented as mean values using point plots, with error bars representing the standard error (SE, n = 4). Each sample was extracted four times. Different letters indicate significant differences among the data groups, as analyzed using Tukey’s multiple comparison test at a significance level of 5% (p < 0.05).
Discussion
As the PAW treatment time was increased, significant changes in the electrical conductivity (EC) and pH were observed (Table 1). The most abundant oxygen species generated during plasma treatment process are associated with the electronegativity of O2. High-energy electrons produced by the plasma discharge react with O2 molecules, leading to the formation of ROS such as atomic oxygen (O) (Küllig et al. 2012). These ROS react with water to generate various other ROS, including H2O2, and can also contribute to the increase in NO2‒ and NO3‒ (Tachibana and Nakamura 2019). In this study, the NO2‒ and NO3‒ concentrations showed a significant increasing trend as the PAW treatment time was increased. This can be attributed to the dissociation of nitrogen and oxygen molecules during the plasma reaction, followed by subsequent reactions leading to the accumulation of RNS within the PAW. The NO2‒ and NO3‒generated by plasma discharge react with H2O to form NO2‒and H+, known to be one of the primary causes of the pH reduction in PAW (Sajib et al. 2020). Similarly, Yang et al. (2023) reported that a PAW treatment in strawberries resulted in increased EC and decreased pH levels, attributing the rise in electrical conductivity to the accumulation of inorganic acids and NO3‒. These findings are consistent with the increase in EC and the decrease in pH observed in this study, further indicating that the formation of RNS and inorganic acids in PAW plays a crucial role in modulating the EC and pH levels. With longer PAW treatment times, cumulative germination, FGP, GE, and GS exhibited significant increasing trends, whereas MGT decreased (Fig. 2 and Table 2). Notably, the highest cumulative germination, FGP and GS were observed in the 30-minute PAW treatment, which may be linked to the increase in H2O2 and RNS. In this study, the H2O2 concentration was higher in all PAW-treated water samples than in tap water, further supporting its association with the accumulation of ROS and RNS (Ramalingam and Kim 2014; Shlapakova et al. 2020). H2O2 functions as a key signaling molecule in plants (Wojtyla et al. 2016) and can promote seed germination through various mechanisms, including cell wall loosening (Ma et al. 2017; SongQuan et al. 2020), the activation of aquaporins (Hooijmaijers et al. 2012; Su et al. 2022), and the regulation of gibberellin (GA) biosynthesis (Kai et al. 2016). H2O2 can penetrate cells either by passive diffusion, depending on the lipid composition of the cell membrane, or selective uptake through aquaporins (Hooijmaijers et al. 2012; Wragg et al. 2020). Once inside the cell, H2O2 accelerates germination by regulating antioxidant enzyme activity, enhancing seed metabolism, and modulating cellular signaling pathways (Chu et al. 2022). H2O2 is known to suppress abscisic acid (ABA) signaling and promote GA biosynthesis, thereby contributing to dormancy breaking and enhancing seed germination (Liu et al. 2010). This suggests that the PAW treatment may be a potential method for promoting seed germination.
As the PAW treatment time was increased, both the shoot and root lengths showed a significant decreasing trend (Table 3). In particular, the 30-minute PAW treatment resulted in a shoot length of 3.77 cm and a root length of 2.12 cm, corresponding to 17.7% and 59.5% reductions, respectively, compared to the control. This phenomenon is attributable to an increase in the H2O2 concentration, which can induce cell apoptosis (Park 2018), and the accumulation of excessive ROS, which negatively affects plant growth. High concentrations of H2O2 can oxidize antioxidant systems such as ascorbic acid and glutathione, leading to cellular damage and potentially inhibiting shoot and root growth (Caverzan et al. 2012; Castro et al. 2018; Hasanuzzaman et al. 2019). In the present study, both shoot and root lengths decreased with an increase in the duration of the PAW treatment. Notably, root growth was suppressed more strongly than shoot growth, resulting in a significant increase in the shoot/root length ratio. As the PAW treatment duration was increased, the shoot water content showed a significant decreasing trend. In the 30-minute PAW treatment, the shoot water content was significantly reduced to 88.2%, compared to 91.7% in the control, likely due the increased EC and H2O2 levels induced by the PAW treatment. Elevated EC levels in the root environment can raise the external osmotic pressure, limiting water uptake into plant cells and leading to dehydration and reduced turgor pressure (Hýskova and Ryslava 2018; Rastogi et al. 2000). Although H2O2 at low concentrations may enhance osmotic stress tolerance by modulating antioxidant defenses and the osmotic balance, excessive accumulation can disrupt cellular water homeostasis through oxidative damage (Saglam et al. 2014). Therefore, the observed reduction in the shoot water content may be closely associated with the osmotic stress triggered by the increased EC and H2O2 concentrations following the PAW treatment.
Distinct changes in the glucosinolate and phenolic acid contents and concentrations were observed in radish sprouts depending on the PAW treatment duration. Specifically, both indolic glucosinolates (4-methoxyglucobrassicin, neoglucobrassicin, and glucobrassicin) and aliphatic glucosinolates (progoitrin, sinigrin, and gluconapin) demonstrated significant increases in the 30-minute treatment (Figs. 3 and 4). These results suggest that the observed changes in glucosinolate levels may be intricately linked to the accumulation of H2O2 and NO3‒, which are key reactive species in PAW. As a central ROS, H2O2 functions not only as a signaling molecule in plants but also participates in the redox-mediated regulation of diverse physiological processes, as highlighted in Brassica species by Gantait et al. (2024) and supported by previous findings (Yadav et al. 2016; Bouslimi et al. 2021). In particular, H2O2 can activate signaling cascades such as MAPK pathways, influencing secondary metabolite biosynthesis (Dai et al. 2015; Černý et al. 2018; Manimekalai et al. 2018; Khedia et al. 2019). Moderate levels of H2O2 have been reported to upregulate the genes involved in glucosinolate biosynthesis (Vanegas Torres et al. 2022), which may explain the increased glucosinolate accumulation observed after 30 min of the PAW treatment in this study. The transient decreases at 10–20 min likely reflect early redox or stress adjustments preceding biosynthetic activation and precursor utilization. Although absolute H2O2 levels were low, µM-level ROS are sufficient to trigger signaling, and consistent trends were observed within the assay precision. The time-dependent increase in GLS thus appears primarily signaling-driven, with NO3‒ serving as a stable nutritional background. However, excessive H2O2 levels may trigger oxidative stress responses that negatively affect biosynthetic pathways, possibly by inhibiting enzyme activity or suppressing the transcription factor function (Marinho et al. 2014). This dual role of H2O2 underscores the complexity of the redox balance in regulating secondary metabolism. In addition to ROS, NO3‒, another major reactive species generated in PAW, was significantly increased compared to the control with no substantial differences observed across the PAW treatment times (10, 20, and 30 minutes). NO3‒ acts as an essential nitrogen source, providing tryptophan and methionine as precursors for indolic and aliphatic glucosinolates, respectively, through the nitrate assimilation process (Glawischnig et al. 2004; Bender and Celenza 2009). Elevated nitrate levels can regulate resource allocation and transcript-metabolite networks, expanding precursor pools and altering the balance between glucosinolate biosynthesis and degradation (Jeschke et al. 2019). In this study, the NO3‒ concentrations were approximately four times higher than that of the control (Table 1) and remained similar across the PAW treatment times (10, 20, and 30 minutes), suggesting that the accumulated nitrogen species provided an initial nutritional foundation. However, the time-dependent increase in glucosinolate accumulation appears to be primarily driven by H2O2 signaling, with NO3‒ likely functioning as a complementary essential background condition. Nevertheless, the precise regulatory mechanisms remain to be fully elucidated, and further investigations at the gene expression level are required to clarify how PAW influences glucosinolate biosynthesis via redox-related pathways. Additionally, given that glucoraphenin, a major glucosinolate in radish, was not analyzed, future studies should include this compound and evaluate changes in glucosinolate metabolism.
Table 3.
Effects of different PAW treatment times (0, 10, 20, and 30 minutes) on growth parameters
| PAW treatment time (min) |
Shoot fresh weight (g) |
Shoot dry weight (g) |
Shoot length (cm) |
Root length (cm) |
S/R length ratio | Shoot water content (%) |
| 0 | 0.22 ± 0.010 a | 0.0201 ± 0.0008 | 4.58 ± 0.098 ab | 5.23 ± 0.402 a | 0.94 ± 0.097 c | 91.74 ± 0.002 ab |
| 10 | 0.22 ± 0.011 a | 0.0191 ± 0.0009 | 4.72 ± 0.112 a | 3.97 ± 0.241 b | 1.23 ± 0.078 bc | 91.17 ± 0.003 a |
| 20 | 0.18 ± 0.010 b | 0.0186 ± 0.0007 | 4.20 ± 0.099 b | 3.14 ± 0.234 bc | 1.41 ± 0.106 b | 90.60 ± 0.003 b |
| 30 | 0.18 ± 0.009 b | 0.0211 ± 0.0011 | 3.77 ± 0.102 c | 2.12 ± 0.121 c | 1.82 ± 0.093 a | 88.19 ± 0.006 c |
| Significantz | ** | NS | *** | *** | *** | *** |
Phenolic acid compounds, including chlorogenic acid, benzoic acid, epicatechin, trans-cinnamic acid, and total phenolic acids, showed significant increases in most cases in the 30-minute treatment (Figs. 5 and 6). This may be due to the oxidative signaling induced by the PAW treatment, which stimulates the phenylpropanoid pathway. H2O2 has been reported to enhance the activity of phenylalanine ammonia-lyase (PAL), thereby inducing the biosynthesis of phenolic compounds (Gholizadeh and Kohnehrouz 2010; Świeca 2016). Therefore, the increase in ROS induced by PAW likely enhanced the biosynthesis of various secondary metabolites by activating specific metabolic pathways depending on the ROS concentration and redox balance of the plant. Consequently, the accumulation of H2O2 and NO3‒ induced by the PAW treatment affects the biosynthesis of key secondary metabolites such as glucosinolates and phenolic acids in radish sprouts. While NO3‒ expands nutritional precursor pools, the rapid GLS response in PAW may also be enhanced by RNS-mediated signaling. This study did not experimentally separate nutritional vs signaling effects, and future work with nutrient-balanced controls and ROS/RNS scavengers will disentangle their contributions. In summary, the content of functional compounds can be modulated by fine-tuning the redox balance and metabolic pathways in plants.
Considering that this study analyzed both growth parameters and functional compounds such as phenolics and glucosinolates, the 30-minute treatment appears to be the optimal duration for maximizing metabolite accumulation. However, to minimize growth inhibition, a treatment duration of 20–30 minutes may be more suitable for balancing growth and metabolite enhancement. As a nutrient solution was not applied in this cultivation system, PAW effects were evaluated under tap-water-based conditions to validate its intrinsic activity. Nevertheless, the substantial increase in NO3‒ observed in PAW suggests that it may have partially acted as a supplemental nutrient source, and this possibility cannot be entirely excluded. Therefore, for the practical application of PAW in agriculture, further studies should incorporate nutrient-solution-based treatments to distinguish redox signaling effects from nutritional contributions, while further fine-tuning the treatment duration, concentration, and related parameters.
Conclusion
In this study, we investigated the effects of PAW generated via corona discharge on seed germination, growth, and secondary metabolite accumulation in radish sprouts. PAW treatments for 10, 20, and 30 minutes significantly altered the physicochemical properties of water, increasing the EC, NO2‒, NO3‒, and H2O2 concentrations, and reducing the pH compared to tap water. These changes were associated with enhanced germination parameters, in this case the germination rate, energy, and speed, especially in the 30-minute treatment group. Although prolonged PAW exposure inhibited shoot and root growth, likely due to oxidative and osmotic stress caused by elevated reactive oxygen and nitrogen species (RONS), it also promoted the accumulation of secondary metabolites such as glucosinolates and phenolic acids. These findings suggest that H2O2-induced signaling may play a role in modulating the metabolic pathways associated with functional compound synthesis. Overall, the PAW treatment, when optimized, could serve as a promising strategy for enhancing the seed germination and nutritional quality of functional crops, such as radish sprouts. Further studies are required to refine the treatment parameters and to gain a better understanding of the physiological mechanisms involved in different PAW exposure conditions.
