

Introduction
Materials and Methods
Plant Materials and DNA Extraction
GBS Library Construction and Illumina Sequencing
Variant Calling and Marker Development
Population Structure and Genetic Relationships
Results
GBS Analysis
Population Structure and Genetic Relationships
Fluidigm SNP Assay and Marker Development
Genetic Analysis and Core Marker Set Development for 92 F1 Cultivars
Discussion
Introduction
Watermelon (Citrullus lanatus, 2n = 2x = 22) is an economically important horticultural crop in the Cucurbitaceae family. Watermelon belongs to a xerophytic genus and originated in northeastern Africa 5,000 years ago. Watermelon has been cultivated for over 4,000 years. Cultivated watermelons, so-called desert watermelons, have many desirable traits, such as sweet taste or nutritional value. Thus, genetic diversity tends to be low; however, variation among watermelon accessions has not been studied extensively (Guo et al., 2019). Watermelon breeders have identified variation in consumer preferences among countries. For example, in East Asia, there is a preference for small-sized fruits and thin rinds. In contrast, consumers in the United States tend to prefer large, oblong watermelons with a thick rind (Wu et al., 2019).
According to the FAO, global watermelon production was about 104 million tons. In South Korea, 535,000 tons of watermelon were produced in 2018 (FAO, 2018). Watermelon is one of the popular horticulture crops and is cultivated in central and southern regions of South Korea. The priorities for watermelon breeders in Korea are improving fruit shape and texture, sugar content, and biotic and abiotic stress resistance.
In an analysis of genetic polymorphisms in watermelon cultivars and Plant Introduction (PI) accessions using RAPD markers, cultivated watermelon showed high similarity at the genetic level (92–99%) (Levi et al., 2001). Another analysis of 49 watermelon varieties using a simple sequence repeat (SSR) marker approach (Kwon et al., 2010) revealed that SSR markers are not suitable for commercial watermelons owing to the limited marker number and low variation. However, they also used EST-SSR and genomic BAC library-based SSR markers to identify highly polymorphic markers in 49 cultivars.
Molecular markers have a number of advantages in plant breeding. They provide an easy way to identify the genetic basis of valuable traits and to predict breeding results quickly and precisely (Nasab et al., 2020). The development of fast and accurate next-generation sequencing (NGS) technology has made a significant contribution to plant breeding. Single nucleotide polymorphisms (SNPs) provide comprehensive genome-wide data, with an even distribution across the whole genome; they can be used for high-throughput genotyping assays as a tool in breeding programs (Ganal et al., 2009; Mammadov et al., 2012). Genotyping-by-sequencing (GBS) is a powerful, cost-effective NGS-based approach that uses restriction enzymes to collect only digested genomic regions, reducing genomic complexity. Accordingly the GBS approach can be used for SNP discovery, high-throughput genotyping, and linkage mapping in various plants (Poland and Rife, 2012; Sonah et al., 2013; Peterson et al., 2014).
In this study, we analyzed the genetic diversity in domestic commercial watermelon cultivars and determined a core set of SNPs to differentiate among the cultivars. In particular, we adopted GBS and Fluidigm genotyping to discover genome-wide SNPs. Robust core-SNP markers were selected based on analyses of molecular diversity and genetic relationships.
Materials and Methods
Plant Materials and DNA Extraction
A total of 100 F1 watermelon cultivars were obtained from the Korea Seed and Variety Service (KSVS), Republic of Korea (Table 1). Among F1 cultivars, 48 and 92 cultivars were used for GBS and Fluidigm genotyping, respectively. Five seedlings of each accession were grown in a growth room at 24 ± 1°C. Young leaves of 3-week-old plants were sampled and ground in liquid nitrogen. Total genomic DNA was extracted using the DNeasy Plant Pro Kit (Qiagen, Germantown, MD, USA) according to the manufacturer’s protocol. The quality of the DNA was checked using a DeNovix DS-11 spectrophotometer (DeNovix, Wilmington, DE, USA) and the amount of double-stranded DNA was measured using the Quant-iTTM Kit, according to the manufacturer’s instructions (Themo Fisher Scientific, Waltham, MA, USA).
Table 1.
Watermelon F1 commercial cultivars used for GBS and a Fluidigm analysis
GBS Library Construction and Illumina Sequencing
To construct the GBS library, each genomic DNA sample was digested with ApeKI restriction enzyme (NEB, Ipswich, MA, USA) and ligated to barcoded and common adaptors with T4 DNA ligase. The ligated DNA fragments were pooled and cleaned using the QIAquick PCR purification kit (Qiagen). The cleaned DNA was amplified to prepare the GBS library, and the quantity and quality of which were measured using an Agilent Bioanalyzer (Agilent Technologies, Santa Clara, CA, USA). The GBS library was sequenced with the Illumina HiSeq 2500 system (Illumina, San Diego, CA, USA) by Macrogen (South Korea).
Variant Calling and Marker Development
The raw reads from the GBS library were analyzed using the TASSEL-GBS pipeline (https://bitbucket.org/tasseladmin/tassel-5-source/wiki/Tassel5GBSv2Pipeline). Good barcoded read-tags were mapped on the watermelon reference sequences (97103v2) of the Cucurbit Genomes Database (CuGenDB; http://cucurbitgenomics.org/) using the Burrows-Wheeler Aligner v0.6.1-r104 (BWA) (Li and Durbin, 2010). The resulting SNPs were filtered under the conditions of minor allele frequency (MAF) > 5%, missing data < 20%, and minimum depth > 10 to produce a variant calling format file. The functional effects of the SNPs were predicted using the snpEff toolbox (Cingolani et al., 2012). The filtered SNPs from 48 F1 cultivars were selected based on the polymorphism information content (PIC) (Bostein et al., 1980) value to obtain a core marker set, which was applied to the Fluidigm assay for discriminating 92 watermelon cultivars. The PIC value was calculated using PowerMarker V3.25 (Liu and Muse, 2005). The Fluidigm assay was performed using the Fluidigm Juno system (Fluidigm, San Francisco, CA, USA). Allele-specific primers were used for PCR amplification and SNP genotyping using the Juno 96.96 Dynamic Array IFC (Integrated Fluidic Circuit), and genotypes were analyzed using Fluidigm SNP Genotyping Analysis v4.5.1.
Population Structure and Genetic Relationships
The population structure was evaluated based on a Bayesian model-based clustering method using STRUCTURE v2.3.4 (Pritchard et al., 2000). The K values were set from 1 to 10 with a burn-in period of 10,000 iterations. Markov chain Monte Carlo (MCMC) runs were carried out with 100,000 iterations per run. The number of replications for each K was set to 10. The best K value was predicted according to the Evanno method using STRUCTURE HARVESTER v0.6.94 (Earl et al., 2012) by calculating the ΔK. A principal component analysis (PCA) was performed using the prcomp function and results were visualized using the ggplot2 package (Wickham, 2009) in R. A hierarchical clustering analysis was performed using the poppr package (Kamvar et al., 2014) implemented in R. The poppr package was used to estimate Nei’s genetic distances (Nei, 1978) between F1 cultivars, and a hierarchical clustering analysis was conducted by the unweighted pair group method with arithmetic means (UPGMA). The UPGMA dendrogram was generated using the dendextent package (Galili, 2015).
Results
GBS Analysis
A GBS analysis of 48 watermelon F1 commercial cultivars, registered in the KSVS (Cimcheon, Republic of Korea), produced 204.1 million reads, which were analyzed in the Tassel-GBS pipeline (Table 2). A total of 18,888 bi-allelic SNPs were mapped to SNP positions with the good barcoded reads. After filtering the SNPs with thresholds of MAF >5% and missing data <10%, we obtained 9,397 SNPs. These SNPs were distributed across the reference genome (Suppl. Fig. 1). Then, we obtained 2,300 SNPs with >10× depth coverage, including one SNP variant for every 178,595 bases of the watermelon reference genome (Table 3).
Table 2.
Summary of genotyping-by-sequencing of the 48 F1 watermelon cultivars
| Number of cultivars | 48 |
| Total number of reads | 204,148,192 |
| Total number of good barcoded reads | 102,101,726 |
| Size of all tags | 257,680 |
| Size of all SNP positions | 18,888 |
| Size of filtered SNPs | 9,397 |
Table 3.
Number of variants and variant rate for each chromosome
| Chromosome | Length (bp) | Variants (SNPs) | Variant rate (bp) |
| 1 | 36,935,898 | 289 | 127,805 |
| 2 | 37,915,939 | 150 | 252,772 |
| 3 | 31,872,261 | 166 | 192,001 |
| 4 | 27,110,815 | 126 | 215,165 |
| 5 | 35,887,987 | 174 | 206,252 |
| 6 | 29,507,460 | 245 | 120,438 |
| 7 | 31,939,013 | 119 | 268,395 |
| 8 | 28,201,227 | 139 | 202,886 |
| 9 | 37,727,573 | 185 | 203,932 |
| 10 | 35,099,344 | 141 | 248,931 |
| 11 | 30,886,124 | 299 | 103,298 |
| Total | 363,083,641 | 2,033 | 178,595z |
Population Structure and Genetic Relationships
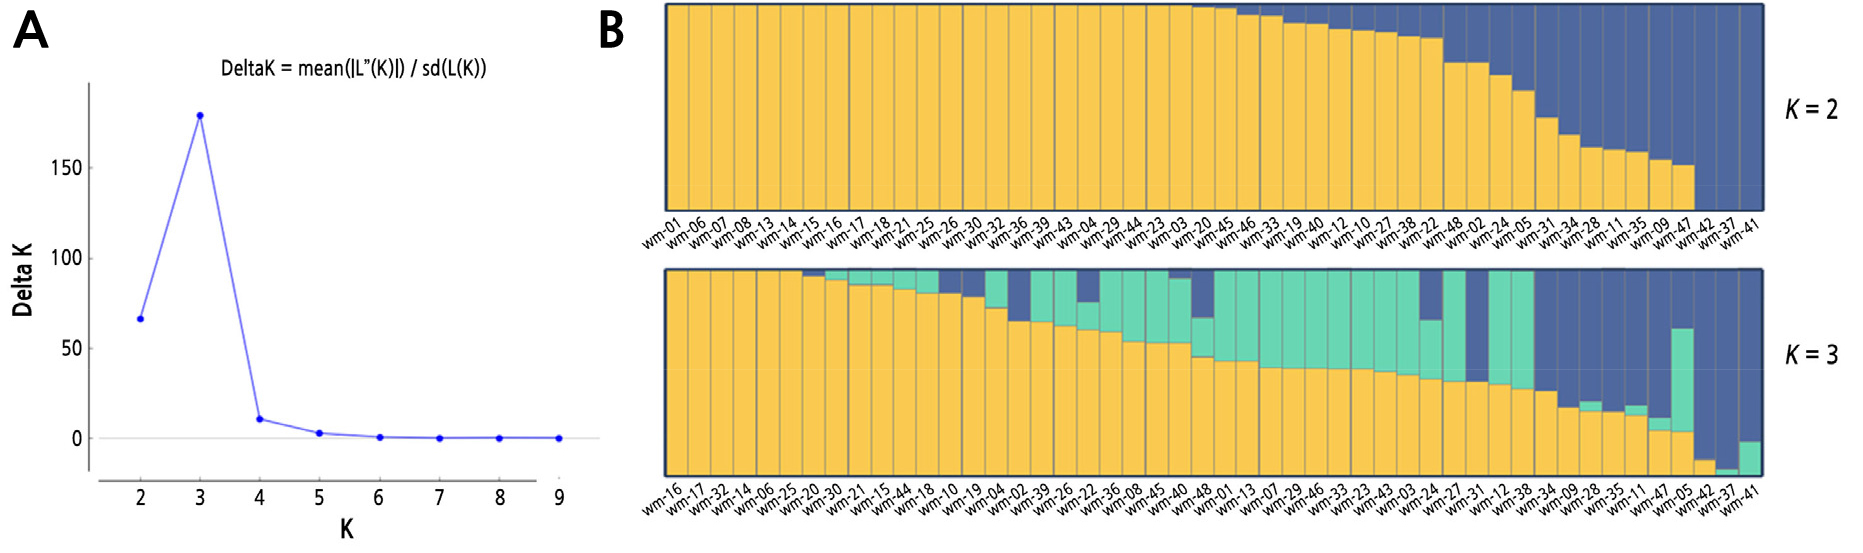
To identify subgroups of the 48 F1 commercial cultivars, a population structure analysis was performed using a Bayesian clustering approach as implemented in STRUCTURE (Fig. 1). The optimal number of subpopulations was 3, as determined by the calculation of ΔK (Fig. 1A). When considering the unknown parental populations, each subpopulation was ambiguously assigned to specific subspecies or varieties. To further understand the genetic relatedness and diversity of the cultivars, we built a tree based on the UPGMA algorithm with 2,300 SNPs (Suppl. Fig. 2). Most samples were assigned to group I (similarity –97.5%), and only three cultivars were exclusively clustered to group II (‘WM41’ and ‘WM37’) and group III (‘WM42’). The three cultivars were also detected in the population structure analysis without admixture setting K= 2 and little admixture setting K = 3 (Fig. 1B).
Fluidigm SNP Assay and Marker Development
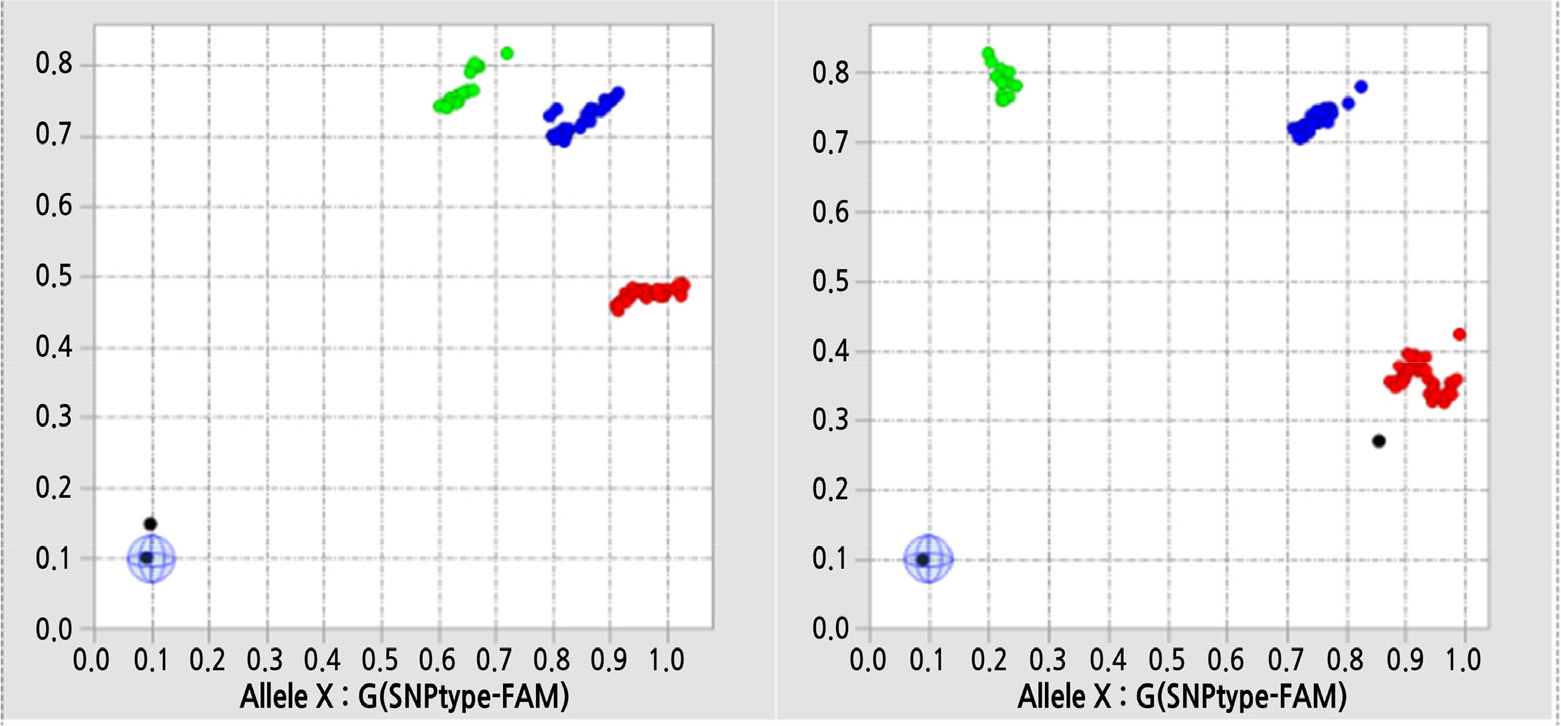
To develop highly polymorphic SNP markers to discriminate cultivars, a subset of 238 SNPs was selected based on PIC > 0.3 and physical distance on each chromosome. These 238 SNPs were tested for the genotyping of newly prepared 92 F1 cultivars (Table 1) using the Fluidigm Juno system. The success rates of amplification per F1 cultivar ranged from 83.5% to 100%, with an average of 92.8%. The genotype calling results for four assays are summarized in Fig. 2. A subset of 141 bi-allelic SNPs was obtained, and these SNPs were used for a genetic analysis.
Genetic Analysis and Core Marker Set Development for 92 F1 Cultivars
For an overview of the 141 SNPs, PCA was applied (Fig. 3). The first two principal components (PC1 and PC2) accounted for 30.5% of the total variance (18.6% and 11.9%, respectively). A cluster analysis using the silhouette test resulted in K = 3 clusters, as visualized by scatter plots (Fig. 3). Most of the cultivars were separated and clustered into three subgroups.
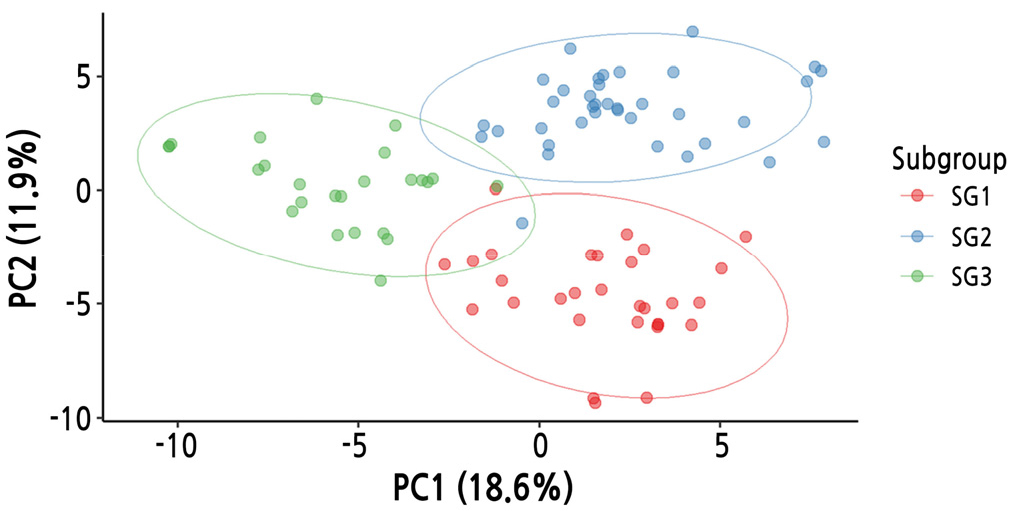
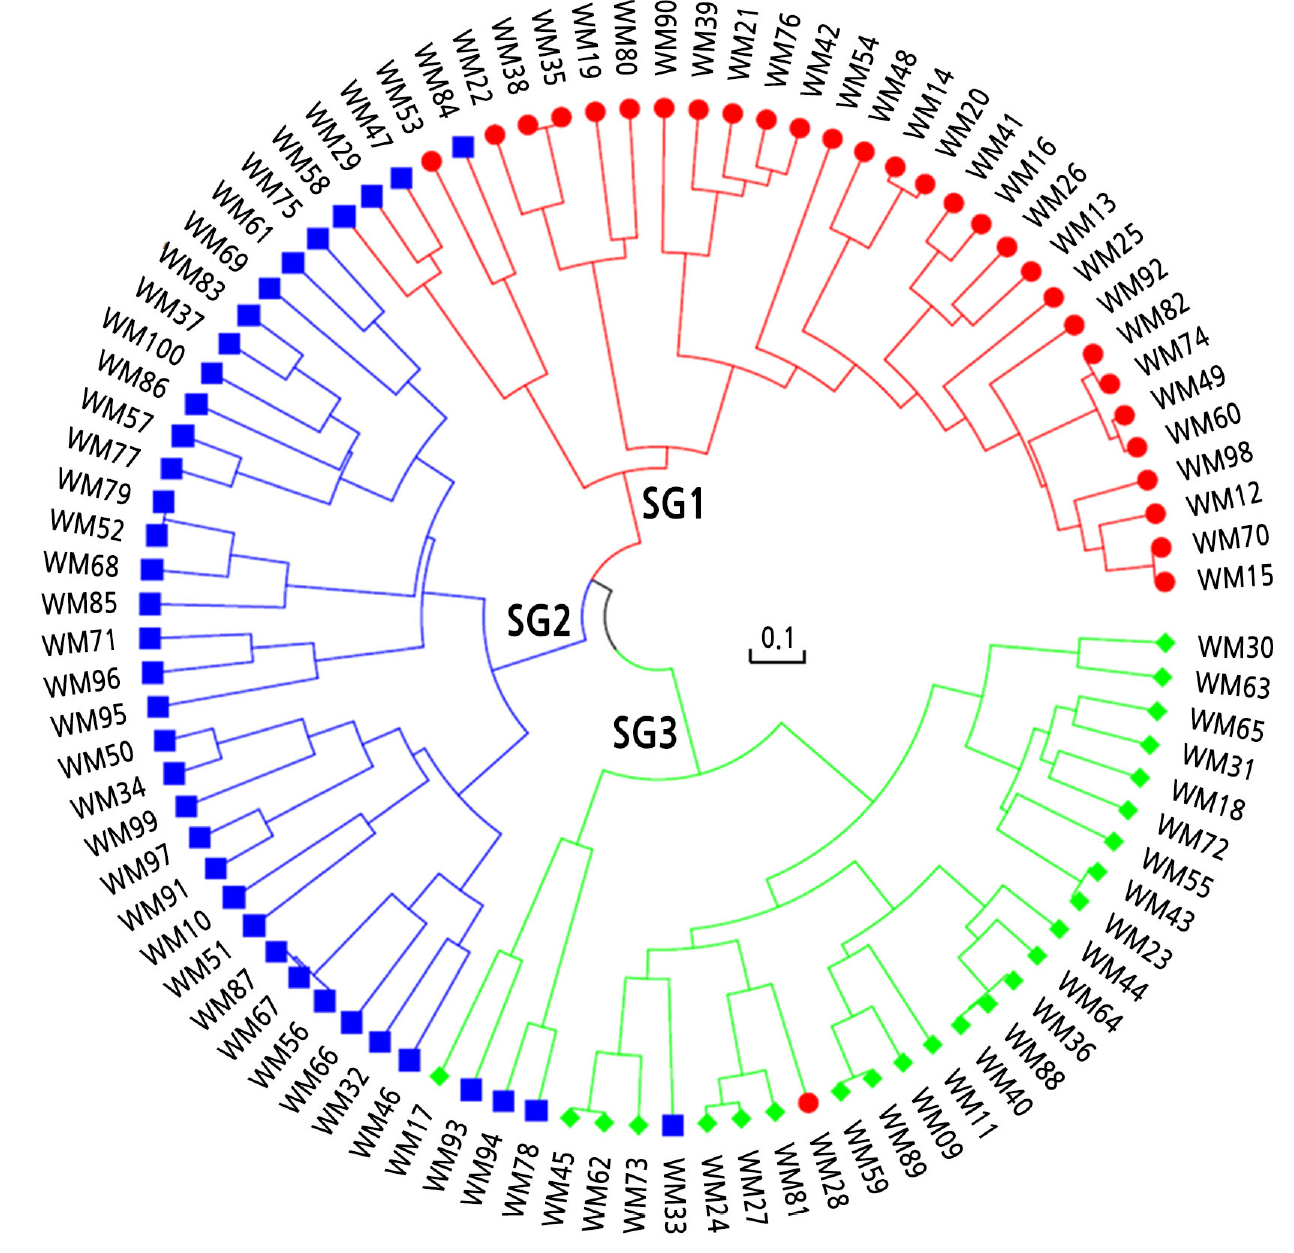
Next, with the subset of 141 SNPs, hierarchical clustering was performed using the UPGMA algorithm based on Nei’s genetic distances (Fig. 4). The cultivars were separated into three clusters using the cutree function in R: subgroup 1 (n = 30), subgroup 2 (n = 37), and subgroup 3 (n = 23). The cluster number (K = 3) was the same; however, the subgroup membership differed slightly between the PCA and hierarchical clustering methods.
The subset of 141 SNPs was reduced to 96 SNPs for the analysis using the Fluidigm Juno 96.96 system. To prepare these 96 SNPs, a threshold PIC of > 0.36 and the physical position of SNPs were considered. The core set of 96 SNP markers has a heterozygosity per F1 cultivar of 9.2% to 82.3%, with an average of 48.9%. The average values of MAF, gene diversity, heterozygosity, and PIC were 0.596, 0.473. 0.509, and 0.361, respectively (Suppl. Table 2). The UPGMA dendrogram based on the 96 SNPs did not show any differences in topology from that based on 141 SNPs.
Discussion
In this study, the Fluidigm analysis platform was used as a cost-effective approach for the development of core SNP markers to differentiate commercial watermelon cultivars. First, we obtained variants including SNPs based on genome-wide complexity reduction by selectively sequencing the barcoded fragments digested with ApeKI restriction enzymes (Poland and Rife, 2012; He et al., 2014; Jung et al., 2020). With a filtering threshold of >10× depth coverage, we obtained a number of reasonably valid SNPs (2,300 SNPs) for downstream analyses. The SNPs were analyzed based on the annotated transcripts in the reference genome using snpEff (Cingolani et al., 2012). For example, 1,203 of 4,108 transcription-related factors (24.1%) were detected in exonic regions (Suppl. Table 1), consistent with soybean GBS results, in which 20.73% of SNPs resided in exonic regions when using a methylation-sensitive ApeKI restriction enzyme (Sonah et al., 2013).
Based on the SNPs, we analyzed the population structure and genetic relationships of 48 commercial watermelon cultivars to understand their molecular diversity. The cultivars were assigned to three subpopulations in the population structure analysis. However, a dendrogram based on genetic distances (Suppl. Fig. 2) revealed little variation in the genetic background, which is a well-known characteristic of watermelon cultivars, which have mainly been bred for a high sugar content and large fruits (Wu et al., 2019; Kim et al., 2021).
Next, we focused on the selection of polymorphic SNPs to establish a core set of markers able to discriminate among domestic watermelon cultivars registered in the KSVS. We determined a subset of 238 SNPs with an even distribution based on physical distance and PIC > 0.3 in a molecular diversity analysis. The SNPs were tested in 92 F1 cultivars using the Fluidigm Juno system. After further filtering, 141 bi-allelic SNPs were identified. The average heterozygosity was 50.9% between the F1 cultivars. The genotyping data showed moderate genetic distances, and the SNP markers could be used to test the purity of the registered F1 cultivars (Kishor et al., 2020). Further, the genotyping data were analyzed by a PCA and hierarchical clustering analysis, in which the 92 cultivars were classified into three subgroups. For most cultivars, consistent results were obtained by the two approaches; however, nine cultivars showed differences in group assignments between the PCA and hierarchical clustering analysis. This inconsistency can be explained by the small number of tested SNPs and narrow genetic background of the tested cultivars. The subset of 141 SNPs was reduced to a core subset of 96 SNPs for an analysis using the Fluidigm Juno 96.96 platform. The dendrogram based on 141 SNPs was identical to the dendrogram based on 96 SNPs (data not shown). With this core SNP set, we could accurately identify the registered 92 F1 cultivars.
In this study, we reported a core set of 96 SNP markers for the identification of domestically registered 92 F1 watermelon cultivars. Genetic analyses revealed that the domestic cultivars have low levels of genetic diversity. However, the newly developed SNP markers are useful to differentiate domestic watermelon cultivars by a high-throughput analysis platform, such as the Fluidigm genotype system. In addition, the newly established markers could protect proprietary rights for new cultivars developed by breeders at the molecular level.
Supplementary Material
Supplementary materials are available at Horticultural Science and Technology website (https://www.hst-j.org).
- HORT_20220008_Table_1s.pdf
Number of SNPs by the variant type and genomic region
- HORT_20220008_Table_2s.pdf
Genotype summary of 96-plex watermelon SNP primers based on 92 watermelon F1 commercial cultivars
- HORT_20220008_Figure_1s.pdf
SNP density of 48 watermelon cultivars.
- HORT_20220008_Figure_2s.pdf
Dendrogram of hierarchical clustering results for the genetic distance analysis.
