

Introduction
Materials and Methods
Plant Materials and Growth Conditions
Growth Characteristics
Anthocyanin Content
Statistical Analyses
Results and Discussion
Conclusions
Introduction
Due to increased demand for high-quality agricultural products and environmental changes, it has become difficult to maintain stable production (Jeong et al., 2020). To solve this problem, interest in crop cultivation using plant factory with artificial lighting (PFAL) is increasing (Um et al., 2010). Research on crop cultivation using PFAL has increased in Asia (Korea, Japan, Taiwan, China), Europe (Netherlands, United Kingdom), the Middle East, and the United States of America due to unstable crop productivity and the sharp increase in vegetable prices (Choi et al., 2014).
A PFAL is an automated agricultural system that can produce crops in planned production, as with industrial products, regardless of season and location by artificially controlling an environment (light, temperature, CO2, and nutrition) suitable for plant production in a closed facility (Takatsuji, 2008). PFAL can cultivate uniform, high-quality crops with increased yields and phytochemicals compared to open-field cultivation products by establishing an optimal cultivation environment (Goto, 2012). In addition, PFAL has several advantages, such as producing uniform plants, higher annual yield, saving resources, and short production cycles (Heo et al., 2012). Therefore, many studies have been conducted on the commercial use of PFAL, which are widely used for academic purposes (Kim et al., 2021).
For the precise control of the environment, various artificial light sources are used in PFAL. These include high- pressure sodium lamps, metal halide lamps, fluorescent lamps, and light-emitting diodes (LEDs) (Park et al., 2012; Kim et al., 2021). Among them, LEDs are the most studied and used because they can light of various wavelengths, emit less heat that can damage plants, and save installation space owing to their small size (Lee et al., 2015; Bae et al., 2017; Kim et al., 2021). LEDs also have a long lifespan, high light efficiency, and low power consumption; therefore, they are commonly used in PFAL as artificial light sources (Choi et al., 2014). However, even if LEDs are used, artificial light sources still incur the highest cost in the operation of PFAL (Cha et al., 2012). Therefore, it is important to determine an appropriate light intensity and photoperiod for plant growth to improve the economic efficiency of PFAL and its products.
Light is an important environmental factor that affects the growth and development of plants. Dorais et al. (1991) reported that tomato yield increased under high light intensity (150 µmol·m-2·s-1). Plants grown under high light intensity show higher dry weight and growth (Park et al., 2012). The photoperiod affects the flowering response, growth, and development of plants (Salisbury and Ross, 1992). Chrysanthemum plant height increased as the photoperiod increased (Berghage et al., 1991). It has also been reported that the fresh and dry weights of various lettuce varieties increase as the photoperiod increases (Koontz and Prince, 1986). In PFAL, many studies have been conducted to change plant growth by controlling the light intensity and photoperiod using LEDs. Hwang et al. (2016) reported that when white dandelion (Taraxacum coreanum Nakai) was grown in PFAL, the yield increased when the photoperiod was longer than 12 h but decreased at light intensities above 150 µmol·m-2·s-1. Yan et al. (2019) reported that lettuce yield increased as the photoperiod increased (16 h), but under high light intensity (above 200 µmol·m-2·s-1), the yield decreased. Therefore, because the suitable light intensity and photoperiod for plant growth differ among plant species, it is important to determine the optimal light intensity and photoperiod to increase the yield of crops in PFAL.
Brassica juncea L. (red mustard), along with lettuce and pak choi, is one of the major leafy vegetables consumed in Korea (Lee et al., 2012). Red mustard is a suitable crop for PFAL because of its short growth period, plant height, and wide edible area (Lee et al., 2010). In addition, red mustard has been used worldwide as a model plant suitable for research on the response of plants to light in facilities (Dougher and Bugbee, 2001; Kim et al., 2004; Park et al., 2012). However, studies on photoperiod and light intensity effects on red mustard in a PFAL are insufficient.
Therefore, this study was conducted to investigate the effects of light intensity and photoperiod on the growth and anthocyanin content of red mustard in a PFAL.
Materials and Methods
Plant Materials and Growth Conditions
Red mustard (Brassica juncea L., Danong Co. Ltd., Namyangju, Korea) was sown on a urethane sponge. After sowing, germination, and seedling nurseries were carried out in a PFAL with RGB LEDs (red:green:blue = 7:1:2, ES LEDs Co. Ltd., Seoul, Korea) at a temperature of 20 ± 1°C, light intensity of 180 ± 10 µmol·m-2·s-1 photosynthetic photon flux density (PPFD), and photoperiod 12/12 (light/dark) for 9 days. Thereafter, a similar cultivation environment was maintained; however, the light intensity was 150 or 300 µmol·m-2·s-1 PPFD, the photoperiod was 8/16, 12/12, and 16/8 (light/dark), and the daily light integral (DLI) of each treatment was calculated using the formula (LEDTonic, 2019) below (Table 1).
Daily light integral (mol·m-2·d-1) = light intensity (µmol·m-2·s-1) × photoperiod (h) × 0.0036
Light intensity was measured at the upper part of the red mustard using a photometer (HD2101.1, Delta OHM Co. Ltd., Padova, Italy), and the light wavelength was measured using a spectroradiometer (ILT950, International Light Co. Ltd., MA, USA). Hoagland nutrient solution (Hoagland and Anon, 1950) at pH 6.0 and EC 1.5 dS·m-1 was supplied using the closed hydroponic culture.
Table 1.
Light intensity, photoperiod, and daily light integral (DLI) value of each treatment in the experiment
| Light intensity (µmol·m-2·s-1) | Photoperiod (h) | DLIz (mol·m-2·d-1) |
| 150 | 8 | 4.3 |
| 12 | 6.5 | |
| 16 | 8.6 | |
| 300 | 8 | 8.6 |
| 12 | 13.0 | |
| 16 | 17.2 |
Growth Characteristics
The fully grown red mustards were harvested and leaf length, leaf width, number of leaves, leaf area, chlorophyll content (SPAD), fresh and dry weights of the shoots and roots, and chlorophyll fluorescence (Fv/Fm) were measured. Shoot and root weights for each treatment were measured using an electronic scale (EW 220-3 NM, Kern and Sohn GmbH., Balingen, Germany). Shoots and roots were dried in a drying oven (Venticell-222, MMM Medcenter Einrichtungen GmbH., Munich, Germany) at 70°C for 72 h and then measured. Chlorophyll content was expressed as the SPAD value and was measured using a portable chlorophyll meter (SPAD-502, Konica Minolta Inc., Tokyo, Japan). Chlorophyll fluorescence was measured at the growth point of the second leaf using a portable chlorophyll fluorescence analyzer (FluorPen FP100, Photon Systems Instruments spol. Brno, Czech Republic). L* and a* were measured using a colorimeter (CR-200, Minolta Co., Japan). A higher value of L* indicates a brighter color, and a positive a* value indicates a red color. Dry matter was calculated using the following formula:
Dry matter (%) = plant dry weight / plant fresh weight × 100
The photosynthetic rate was measured from the growth point of the fifth fully developed using a portable photosynthetic meter (CIRAS-3, PP Systems International Inc., MA, USA). Measurement conditions were controlled at an air volume of 150 mL·min-1, a leaf area of 4.5 mm2, a leaf temperature of 25°C, a CO2 concentration of 500 µmol·mol-1, and light intensities of 150 and 300 µmol·m-2·s-1 PPFD.
Anthocyanin Content
Red mustard leaves were frozen in liquid nitrogen and stored at –72°C (NF140SF, Nihon Freezer Co. Ltd., Japan) until analysis. To determine the total anthocyanin content, 2 g of sample was collected from the second leaf at the growth point of the red mustard leaf, and 2 mL of a 95% ethanol and 1.5 N HCl mixed at 85:15 (v/v) was added to a mortar and ground. After transferring 1 mL of the ground sample to a microtube, it was stored in the dark at 4°C for 24 h, and then centrifuged at 13,000 rpm for 20 min. The obtained 1 mL of supernatant was diluted. The total anthocyanin content was calculated by measuring the absorbance at 535 nm using a spectrophotometer (Libra S22, Biochrom Co., Ltd., UK) (Fuleki and Francis, 1968).
Statistical Analyses
Experimental treatments were performed using a randomized complete block design. Each treatment group consisted of 30 plants. A total of 10 plants were used per replicate, and the replication was completed three times. Statistical analyses were performed using statistical analysis software (SAS 9.4, SAS Institute Inc., Cary, NC, USA). The experimental results were analyzed using analysis of variance (ANOVA), Tukey’s multiple range test, and Fisher’s least significant difference test. Differences were considered significant at p < 0.05. The graph was plotted using SigmaPlot software package (SigmaPlot 12.5, Systat Software Inc., San Jose, CA, USA).
Results and Discussion
The growth of red mustard increased with high light intensity and a long photoperiod (Table 2 and Fig. 1). Leaf length, leaf width, and leaf area showed higher values as the photoperiod increased. Dry matter (%) increased with high light intensity and long photoperiod. High light intensity and long photoperiods can increase the photosynthetic rate of crops, causing the accumulation of assimilation products in the leaves (Gardner et al., 2020a). Park et al. (2012) and Kim et al. (2016) reported that the growth of lettuce and Ixeris dentata (Thunb.) Nakai increased as the photoperiod increased. Therefore, it is presumed that the growth of red mustard was improved by the accumulation of assimilation products due to higher photosynthesis rates at a high light intensity and a long photoperiod.
Table 2.
Growth characteristics of red mustard (Brassica juncea L.) as affected by different light intensities and photoperiods at 16 days after transplanting
| Treatment |
Leaf length (cm) |
Leaf width( cm) |
Number of leaves |
Leaf area (cm2) |
Fresh weight (g/plant) |
Dry weight (g/plant) |
Dry matter (%) | ||||
|
Light intensity (µmol·m-2·s-1) (A) |
Photoperiod (h) (B) | Shoot | Root | Shoot | Root | ||||||
| 150 | 8 | 19.0 cz | 10.0 c | 6.7 a | 424.30 d | 21.03 d | 2.23 c | 0.90 d | 0.10 c | 4.53 bc | |
| 12 | 19.4 bc | 10.2 c | 6.8 a | 454.71 d | 22.82 cd | 3.32 c | 0.98 d | 0.14 c | 4.29 c | ||
| 16 | 22.4 ab | 12.4 b | 6.4 a | 654.54 bc | 38.98 b | 6.29 b | 2.08 c | 0.32 b | 5.35 ab | ||
| 300 | 8 | 22.3 ab | 12.3 b | 6.4 a | 635.61 c | 31.87 bc | 4.06 c | 1.80 c | 0.19 c | 5.70 a | |
| 12 | 23.4 a | 13.4 ab | 7.1 a | 804.94 ab | 49.62 a | 7.50 b | 2.90 b | 0.35 b | 5.68 a | ||
| 16 | 25.2 a | 15.2 a | 7.0 a | 881.46 a | 58.27 a | 10.20 a | 3.82 a | 0.49 a | 6.21 a | ||
| F-test | A | *** | *** | NS | *** | *** | *** | *** | *** | *** | |
| B | ** | *** | NS | *** | *** | *** | *** | *** | * | ||
| A × B | NS | NS | NS | NS | NS | NS | NS | NS | NS | ||
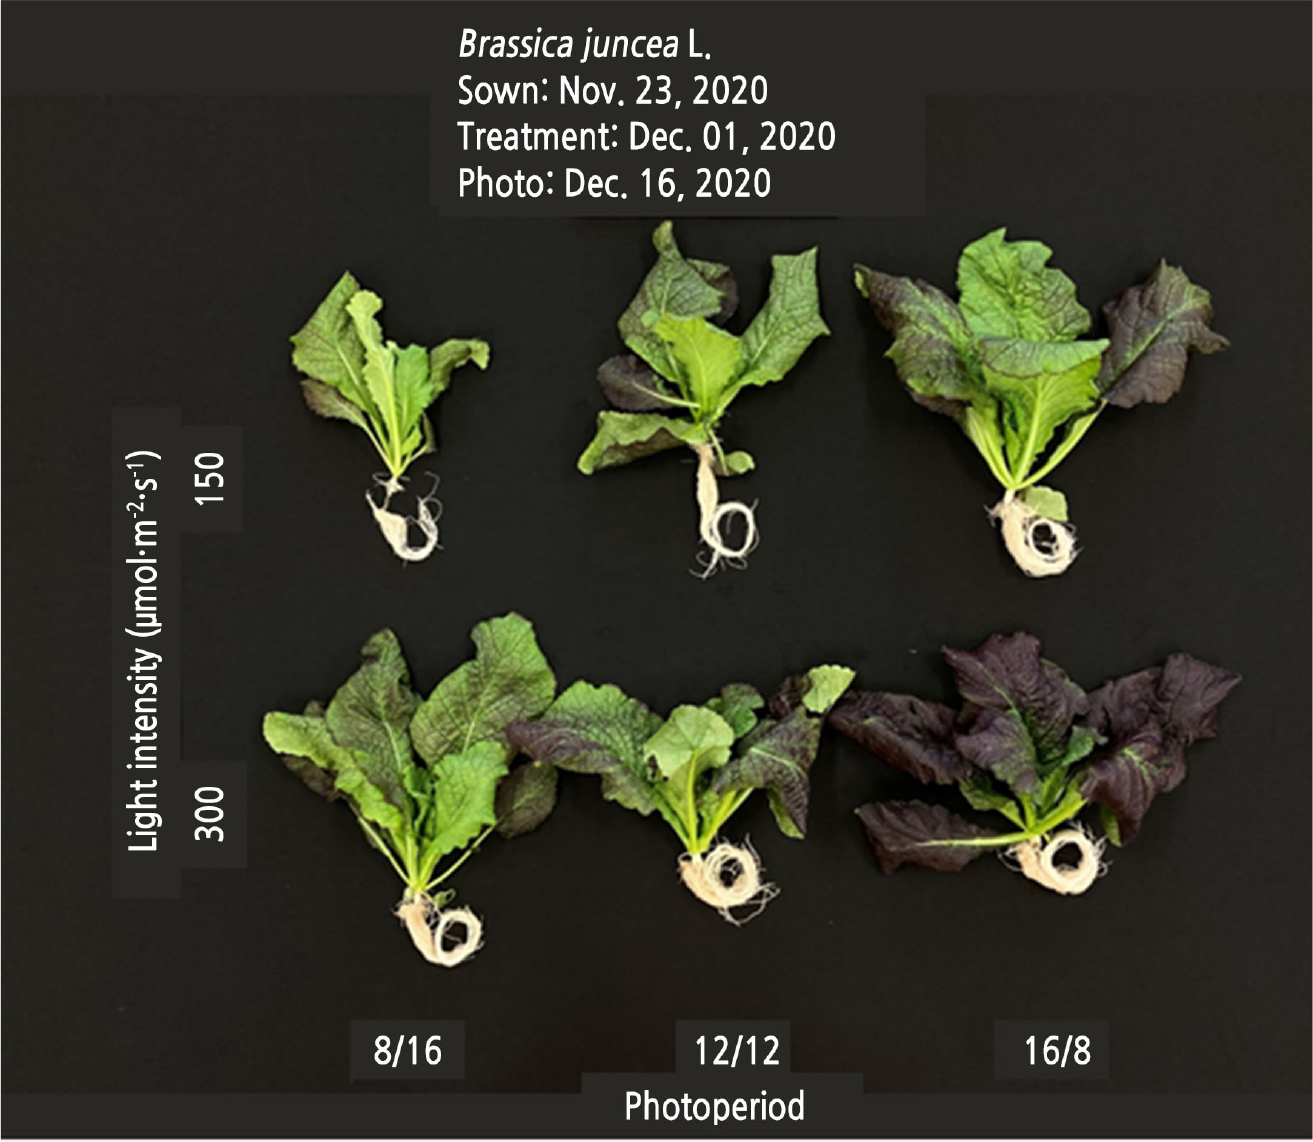
Under high light intensity and longer photoperiod, red mustard showed a dark red color (Fig. 2). The higher the L* value, the brighter the color; the higher the a* value, the higher the red color. The L* value decreased as the photoperiod increased and the a* value increased as the photoperiod increased. Plants under high light intensity had low brightness and high saturation owing to their active pigment synthesis (Rezai et al., 2018). The stronger the dark red color in red mustard, the higher its marketability (RDA, 2018). Therefore, high light intensity and a longer photoperiod are more advantageous for producing high-quality red mustard.
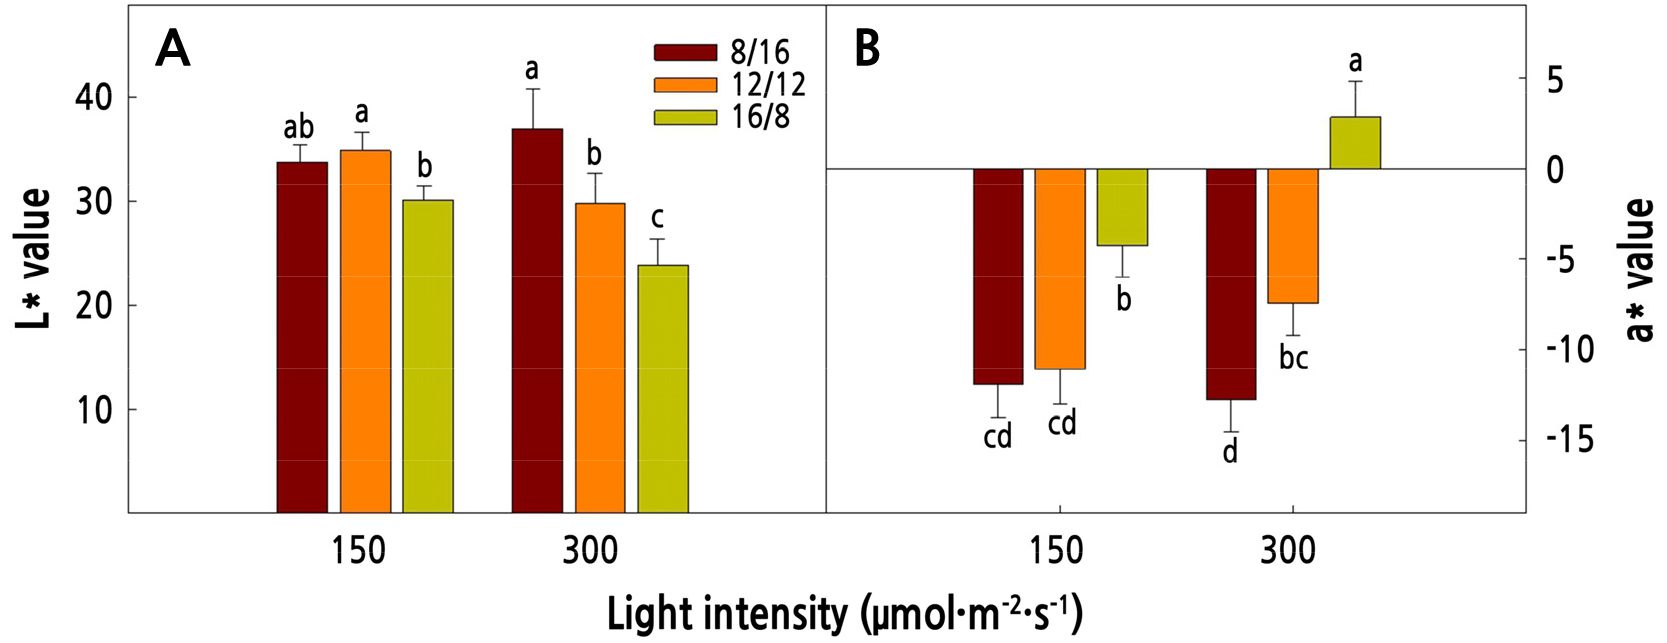
Fig. 2.
The L* (A) and a* (B) values of red mustard (Brassica juncea L.) as affected by different light intensities and photoperiods at 16 days after transplanting. Vertical bars represent the standard deviation of the mean (n = 9). Different letters in the same column indicate significant differences based on Duncan’s multiple range test (p < 0.05). A higher L* value indicates a brighter color, and a positive a* value indicates a red color.
The photosynthetic rate increased at 300 µmol·m-2·s-1, which was the highest light intensity treatment, and there was no significant difference depending on the photoperiod (Fig. 3). SPAD increased as the photoperiod increased, regardless of the light intensity. Photosynthesis is generally higher under high light intensity, and continues to increase until it reaches the photosaturation point when the CO2 concentration is saturated (Gardner et al., 2020b). Lee et al. (2012) reported that the photosynthetic rate increased with increasing photoperiod in red mustard and pak choi. Kim et al. (2016) reported that the SPAD of leafy vegetables (i.e., Ixeridium dentatum) increased as the photoperiod increases. Therefore, photosynthesis and SPAD of red mustard increased due to active photosynthesis and pigment synthetase under high light intensity and a long photoperiod.
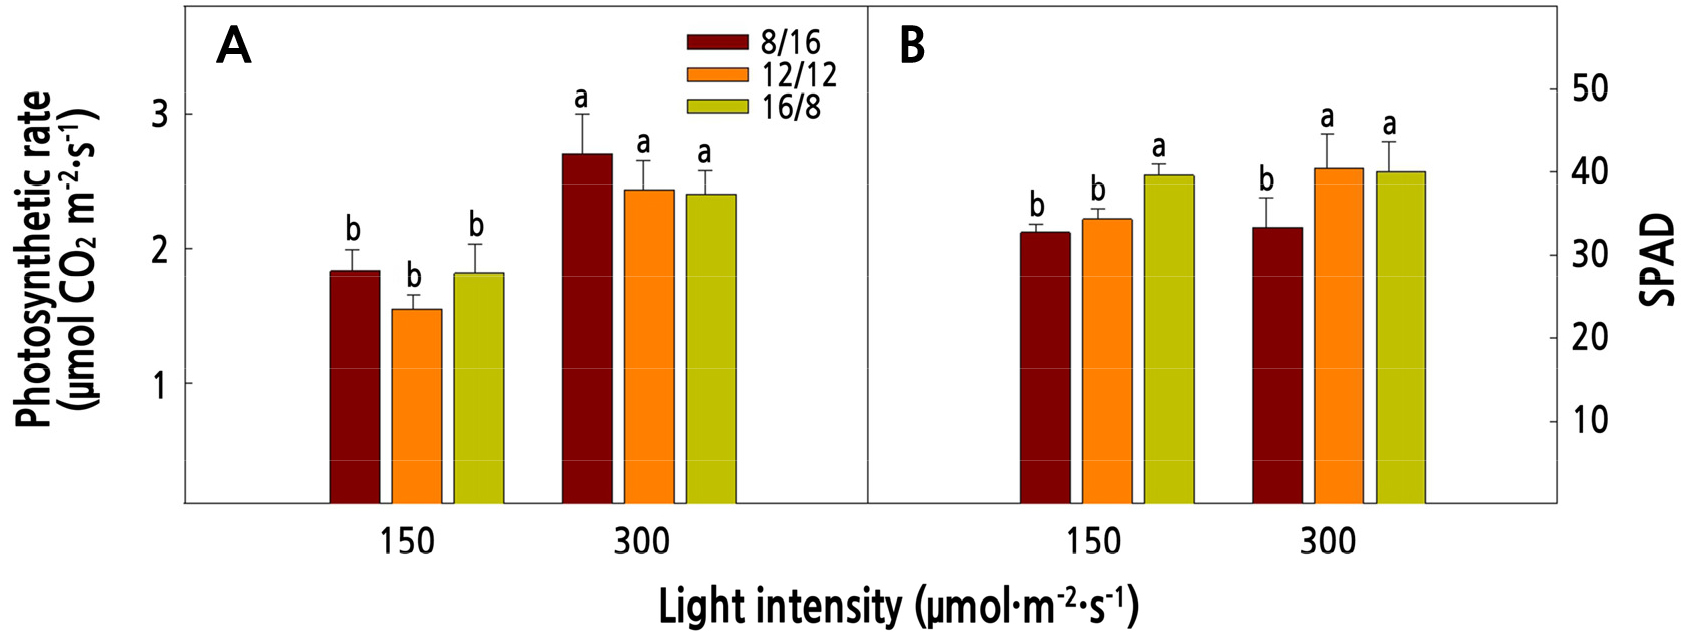
Fig. 3.
Photosynthetic rate (A) and SPAD (B) of red mustard (Brassica juncea L.) as affected by light intensities and photoperiods at 16 days after transplanting. Vertical bars represent the standard deviation of the mean (n = 6). Different letters in the same column indicate significant differences based on Duncan’s multiple range test (p < 0.05).
The anthocyanin content of red mustard increased as the light intensity and photoperiod increased (Fig. 4). Anthocyanins are purple-colored pigments that act as antioxidants, which protect plants from abiotic stress (Islam et al., 2002; Ma et al., 2021). The higher the color value, the greater the amount of anthocyanin in the leaves (Shimizu and Nakamura, 1993; Islam et al., 2002), and the crops with distinct colors are highly estimated for their commercial value (Ferrante et al., 2008). In this study, the color value of red mustard grown under high light intensity and a long photoperiod was high (Fig. 2). Light is one of the most factors involved in the anthocyanin biosynthesis pathway, when organs absorb light, the organ part of absorbing light, light intensity, light quality determines the quantity of the anthocyanins (Ma et al., 2021). Park and Lee (1999) reported that the anthocyanin content of leafy vegetables increased under high light intensity. In addition, the activity of enzymes and genes related to anthocyanin synthesis increases when crops are continuously irradiated by high light intensity (Sato et al., 1996; Guo et al., 2022). Therefore, it is considered that the activity of anthocyanin synthetase increases under high light intensity and long photoperiods, which causes an increase in anthocyanin content.
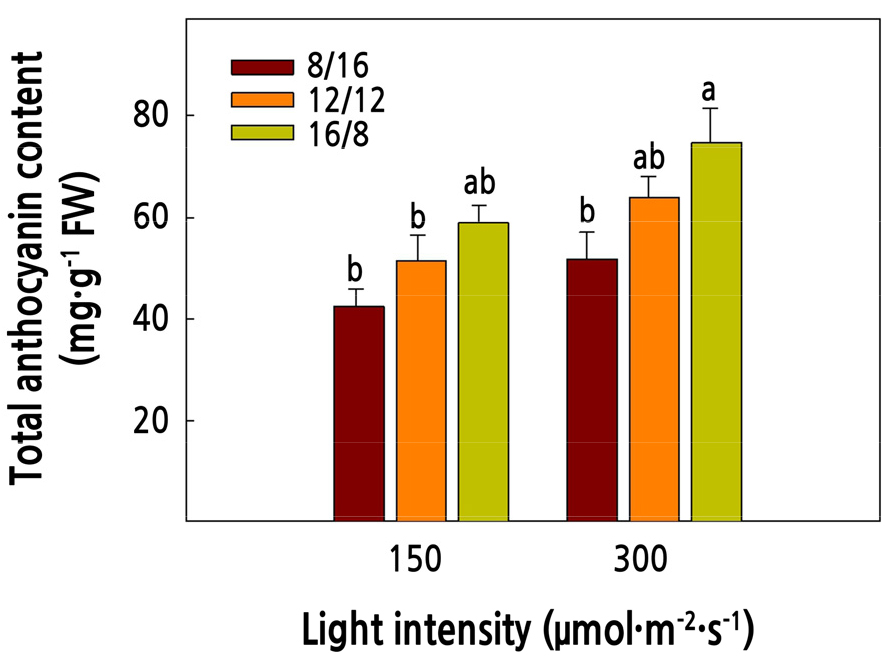
Fig. 4.
Total anthocyanin content of red mustard (Brassica juncea L.) as affected by light intensities and photoperiods at 16 days after transplanting. Vertical bars represent the standard deviation of the mean (n = 6). Different letters in the same column indicate significant differences based on Duncan’s multiple range test (p < 0.05).
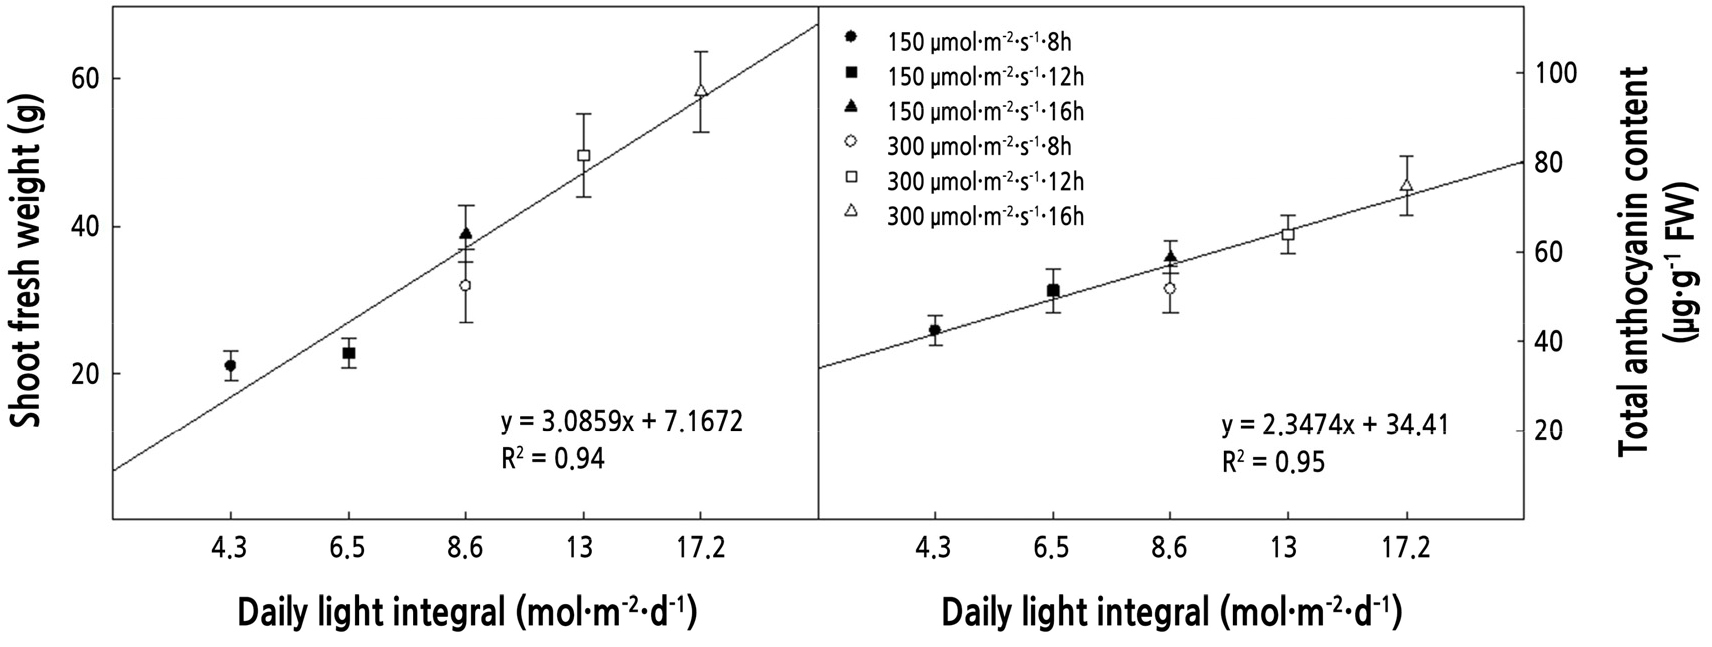
The DLI is the level of photosynthetically active radiation delivered over 24 h (Faust et al., 2005). As the DLI increased, the fresh weight and the total anthocyanin content showed a positive correlation (Fig. 5). The 150 µmol·m-2·s-1 with 16/8 photoperiod (low light intensity with long photoperiod) and 300 µmol·m-2·s-1 with 8/16 photoperiod (high light intensity with short photoperiod) had the same DLI, and fresh weight and total anthocyanin content showed no significant differences. He et al. (2020) reported that the quantum energy reaching photosystem II in plants under the same DLI conditions was similar. However, under the same DLI, the morphology and color can be different according to the change of photoperiod and light intensity. Kitaya et al. (1998) reported that at the same DLI, the longer photoperiod increased hypocotyl length and leaf area of ‘Summer-green’ lettuce. Kelly et al. (2020) reported that in ‘Rex’ and ‘Rouxai’ lettuce, there was no morphological change at the same DLI, but the color value was changed. In this study, at the same DLI, there is no difference in leaf area, fresh weight, and dry weight, but the color value and SPAD showed a difference (Table 2, Figs. 2 and 3B). Furthermore, DLI can act as an important indicator for establishing a strategy to control the operating cost of plant factory. The electricity cost has a large portion of the operating cost of a plant factory for using the light source (Kozai and Niu, 2019). Some countries, including Korea, the industrial electricity using the TOU (Time of usage) method, which electricity costs vary by season and time of day (Park et al., 2021). Therefore, by controlling the photoperiod while maintaining the same DLI, it is possible to save the electricity cost of the plant factory, and the results of this study can be used as an indicator to save operating costs in the production of plant factories of red mustard.
Conclusions
This study investigated the growth and anthocyanin content of red mustard under various light intensities and photoperiods in a PFAL. Leaf length, leaf width, leaf area, fresh and dry weights, and anthocyanin content of crops were the greatest at a light intensity of 300 µmol·m-2·s-1 and a 16/8 photoperiod. Fresh weight and total anthocyanin content increased as the DLI increased. There was no significant difference between the fresh weight and the anthocyanin content when the DLI was the same, even if the light intensity and photoperiod were different. In conclusion, shoot growth and anthocyanin content of red mustard increased as the light intensity and photoperiod increased. This study can be used as basic data to control the production and anthocyanin content of red mustard in a PFAL using DLI.
