

Introduction
Materials and Methods
Chemicals and Solvents
Preparation of Cannabis Plants
Sample Preparation
Standard Calibration Curve
GC-MS Analysis
Statistical Analysis
Results
Generation of Standard Calibration Curves for CBD and THC
CBD and THC Contents of Cheongsam Plants
CBD and THC Contents of Cherry Blossom, Hot Blonde, and Queen Dream
Discussion
Introduction
Cannabis has been widely used medicinally for centuries as well as for nourishment, textiles, and oil production (Andre et al., 2016; Ahsan et al., 2022). Recently, interest in its therapeutic properties has been increasing (Bryant et al., 2018). Phytocannabinoids are terpenophenolic chemicals that account for at least 70 of more than the approximately 400 components responsible for the pharmacological properties of cannabis plants (Elsohly and Slade, 2005). Thus, cannabis plants are currently extensively farmed and consumed as a type of phytomedicine worldwide (Lam et al., 2022). Based on their potential to produce Δ9-tetrahydrocannabinol (THC) and cannabidiol (CBD), cannabis plants can be classified into three types: i) the low THC and CBD type (fiber-type hemp), ii) the high CBD but low THC type (medicinal hemp), and iii) the high THC but low CBD type (marijuana). The genetics of cannabis plants plays a major role in determining the CBD-to-THC ratio, although ecological and harvesting circumstances (e.g., cultivation and storage conditions, state of maturity at harvest) also play an important role (Potter, 2014).
Δ9-tetrahydrocannabinolic acid (THCA) and cannabidiolic acid (CBDA) are the most abundant phytocannabinoids synthesized in cannabis. The decarboxylation of THCA and CBDA to THC and CBD, respectively, can occur during plant maturation and/or light and heat treatments (Hanuš et al., 2016; Wang et al., 2016). In humans, THC is known as the main psychoactive compound of cannabis plants; it can induce sensations through its interaction with cannabinoid receptor type 1 (CB1; Yeasmin and Choi, 2020). On the other hand, CBD is known to be non-psychoactive. However, it has several therapeutic effects, such as anti-inflammatory, anticonvulsive, anxiolytic, analgesic, neuroprotective, anticancer, and antioxidant effects (Appendino et al., 2011; Fernández-Ruiz et al., 2011; Alexander, 2016; Campos et al., 2016; Pisanti et al., 2017; Pellati et al., 2018; Corsi et al., 2019; Yeasmin and Choi, 2020). Recently, increasing efforts have focused on breeding strains with high CBD contents due to the increased interest to CBD's medicinal properties (Swift et al., 2013; ElSohly et al., 2016; Chandra et al., 2017).
To distinguish between ‘medicinal hemp’ and ‘marijuana’ more accurately, the total THC and CBD contents must be determined by proven scientific procedures, which is impossible with naked-eye observations or by smelling these products (Hädener et al., 2019). There are several approaches available for a phytocannabinoids analysis, including gas chromatography (GC) and liquid chromatography (LC). In addition to these, thin layer chromatography (TLC), nuclear magnetic resonance (NMR), and near-infrared (NIR) spectroscopy, as well as others, are also established (Capriotti et al., 2021). GC is a chromatographic technology used to separate and analyze substances from diverse matrices that can be vaporized and remain unchanged (Min, 2012; Kim et al., 2016; Nahar et al., 2020). GC coupled with various detection technologies [e.g., flame ionization detector (FID) and mass spectrometry (MS)] are among such analytical tools that have been used extensively to analyze phytocannabinoids (Hewavitharana et al., 2005; Tayyab and Shahwar, 2015; Tassoni et al., 2016; Akutsu et al., 2017; Nahar et al., 2020). In this study, we aim to analyze CBD and THC contents in different tissues of cannabis plants by means of GC-MS. In our GC-MS analysis, various contents of CBD and THC contents were found in different tissues of the Cheongsam, Cherry Blossom, Hot Blonde, and Queen Dream cultivars. However, female flowers accumulated the highest levels of CBD and THC compared to the other tissues (leaves, stems, and roots) in all tested cannabis cultivars.
Materials and Methods
Chemicals and Solvents
Cannabidiol (CBD) and Δ9-tetrahydrocannabinol (THC) standard solutions (1 mg·L-1 in methanol or acetonitrile) were purchased from Cerilliant (Round Rock, TX, USA). GC-grade ethanol (EtOH) was purchased from Sigma Aldrich (St. Louis, MO, USA).
Preparation of Cannabis Plants
Four cultivars of cannabis plants, Cheongsam (Rural Development Administration, Korea; Park et al., 2021), Cherry Blossom (Blue Forest Farms, USA), Queen Dream (Blue Forest Farms, USA), and Hot Blonde (Blue Forest Farms, USA), were used in this study (Ahsan et al., 2022). Cannabis seeds were germinated on Petri dishes containing a filter paper thoroughly soaked with tap water. After germination, young seedling plants were transplanted into pots containing coco peat. Cannabis plants were grown for two months under a vegetative growth condition. Specifically, the temperature and humidity controllers were set to 25°C and 60%, respectively. The light intensity was adjusted to –300 µmol·m-2·s-1 at the top of the terminal bud by adjusting the height of the lamp, and an 18 h light/6 h dark cycle was used. The plants were then grown for one month under reproductive growth condition in which the temperature, relative humidity, and light conditions were identical to the vegetative conditions, but an 8 h light/16 h dark cycle was used.
As cannabis plants are dioecious and the Cheongsam seeds used in this study were not feminized, we were not able to distinguish between male and female plants until the plants started flowering. Thus, the sexuality of the tested samples is indicated only for 90-day-old Cheongsam plants. However, feminized seeds of Cherry Blossom, Queen Dream, and Hot Blonde were used. Thus, we only observed female flowers, but not male flowers, from these three cultivars.
Sample Preparation
After three months of vegetative and reproductive growth of the cannabis plants, the leaf, stem, root, and flower tissues were sampled and used for the GC-MS analysis. To extract the cannabinoids, each sample was dried in a drying oven at 150°C for 30 min for decarboxylation. Dried tissues were weighed, ground using a Silamat S6 device (Ivolar Vivodent Inc., USA) and with glass beads, mixed with GC-grade EtOH (1 mL EtOH added per 1 mg sample), thoroughly mixed by vortexing for 1 min, and incubated at room temperature for 1 h under vigorous shaking. Undissolved plant debris for each sample was removed by centrifugation at 13,000 rpm for 5 min. The supernatant of each sample was transferred to a new tube, filtered with a syringe filter (pore size of 0.2 µm, Pall Corporation, USA), and used for the GC-MS analysis.
Standard Calibration Curve
To generate the standard calibration curves for CBD and THC, amounts of 5, 10, 25, 50, and 100 µg·mL-1 of CBD or THC standard solutions were prepared by serial dilution in GC-grade EtOH and were then analyzed by GC-MS. For quantification, the corrected peak area value from each analysis was collected and used to generate a standard calibration curve.
GC-MS Analysis
A GC/MSD system (5977A Series, Agilent Technologies, Santa Clara, CA, USA) and DB-5ms columns (Agilent Technologies, Santa Clara, CA, USA) were used for the GC-MS analysis. The oven temperature was held at 80°C for 1 min and then increased to 240°C at a 10°C·min-1 rate, to 240°C to 260°C at a 5°C·min-1 rate, and to 260°C to 300°C at a 20°C·min-1 rate and was finally held at 300°C for 10 min. The injector and mass interface temperature was 300°C. Helium was used as a carrier gas at a flow rate of 1 mL·min-1. The injection mode was split and the scanned mass range was from 40 to 450 m/z. Two µL of each sample was injected for the analysis. The result was analyzed using the National Institute of Standards and Technology spectral library version 11 (NIST 11 spectral library). Specific peaks corresponding to CBD and THC were observed by GC-MS analyses of tissue samples prepared from cannabis plants. Corresponding corrected peak areas of CBD and THC were collected. The CBD and THC concentrations (µg·mL-1) were back-calculated using corresponding standard calibration curves for CBD and THC. Finally, the CBD and THC contents were expressed in a percentage (%) of CBD (or THC) in the dry weight of the cannabis plant tissues, which was calculated by dividing the calculated CBD and THC concentrations (µg·mL-1) by the tissue weights used.
Statistical Analysis
For the statistical analysis, analysis of variance (ANOVA) and Duncan’s multiple range test were utilized with IBM SPSS (IBM Corp. Released 2021. IBM SPSS Statistics for Windows, Version 28.0. Armonk, NY: IBM Corp). Data were expressed as the mean ± standard deviation (SD) from triplicates of each experiment. Significant differences were considered at P ≤ 0.05.
Results
Generation of Standard Calibration Curves for CBD and THC
From our analysis, CBD and THC standard solutions generated chromatographic peaks at specific retention times (Rt) with different corrected peak area (CPA) values, which were increased in a dose-dependent manner. For CBD, a specific chromatographic peak was observed at a Rt of 13.206 min, whereas a specific chromatographic peak of THC was observed at a Rt of 13.997 min (Fig. 1A and 1B). Standard calibration curves of CBD and THC were generated using the CPA of each sample. In the GC-MS analysis of the CBD standard solution, the 5, 10, 25, 50, and 100 µg·mL-1 of CBD solutions generated 13,783,212; 32,762,775; 250,520,814; 554,709,530, and 1,044,922,621 arbitrary unit (AU) of CPAs, respectively. On the other hand, the 5, 10, 25, 50, and 100 µg·mL-1 of THC solutions generated 15,613,883; 34,901,090; 225,287,089; 504,864,972, and 1,023,665,156 AU of CPAs, respectively. Standard calibration curves of CBD and THC were generated using the CPA of each sample (Fig. 1C and 1D). In the analysis using the CBD and THC standard solutions, the regression equations were Y = 11,080,056.813 × X–41,702,368.504 [R2 = 0.995; where Y is the CPA concentration (µg·mL-1) and X is the CBD concentration (µg·mL-1)] and Y = 10,796,749.340 × X–49,410,036.919 [R2 = 0.999; where Y is the CPA concentration (µg·mL-1) and X is the THC concentration (µg·mL-1)], respectively. These regression equations were also used to determine the concentrations of CBD and THC in the tissue samples prepared from the cannabis plants.
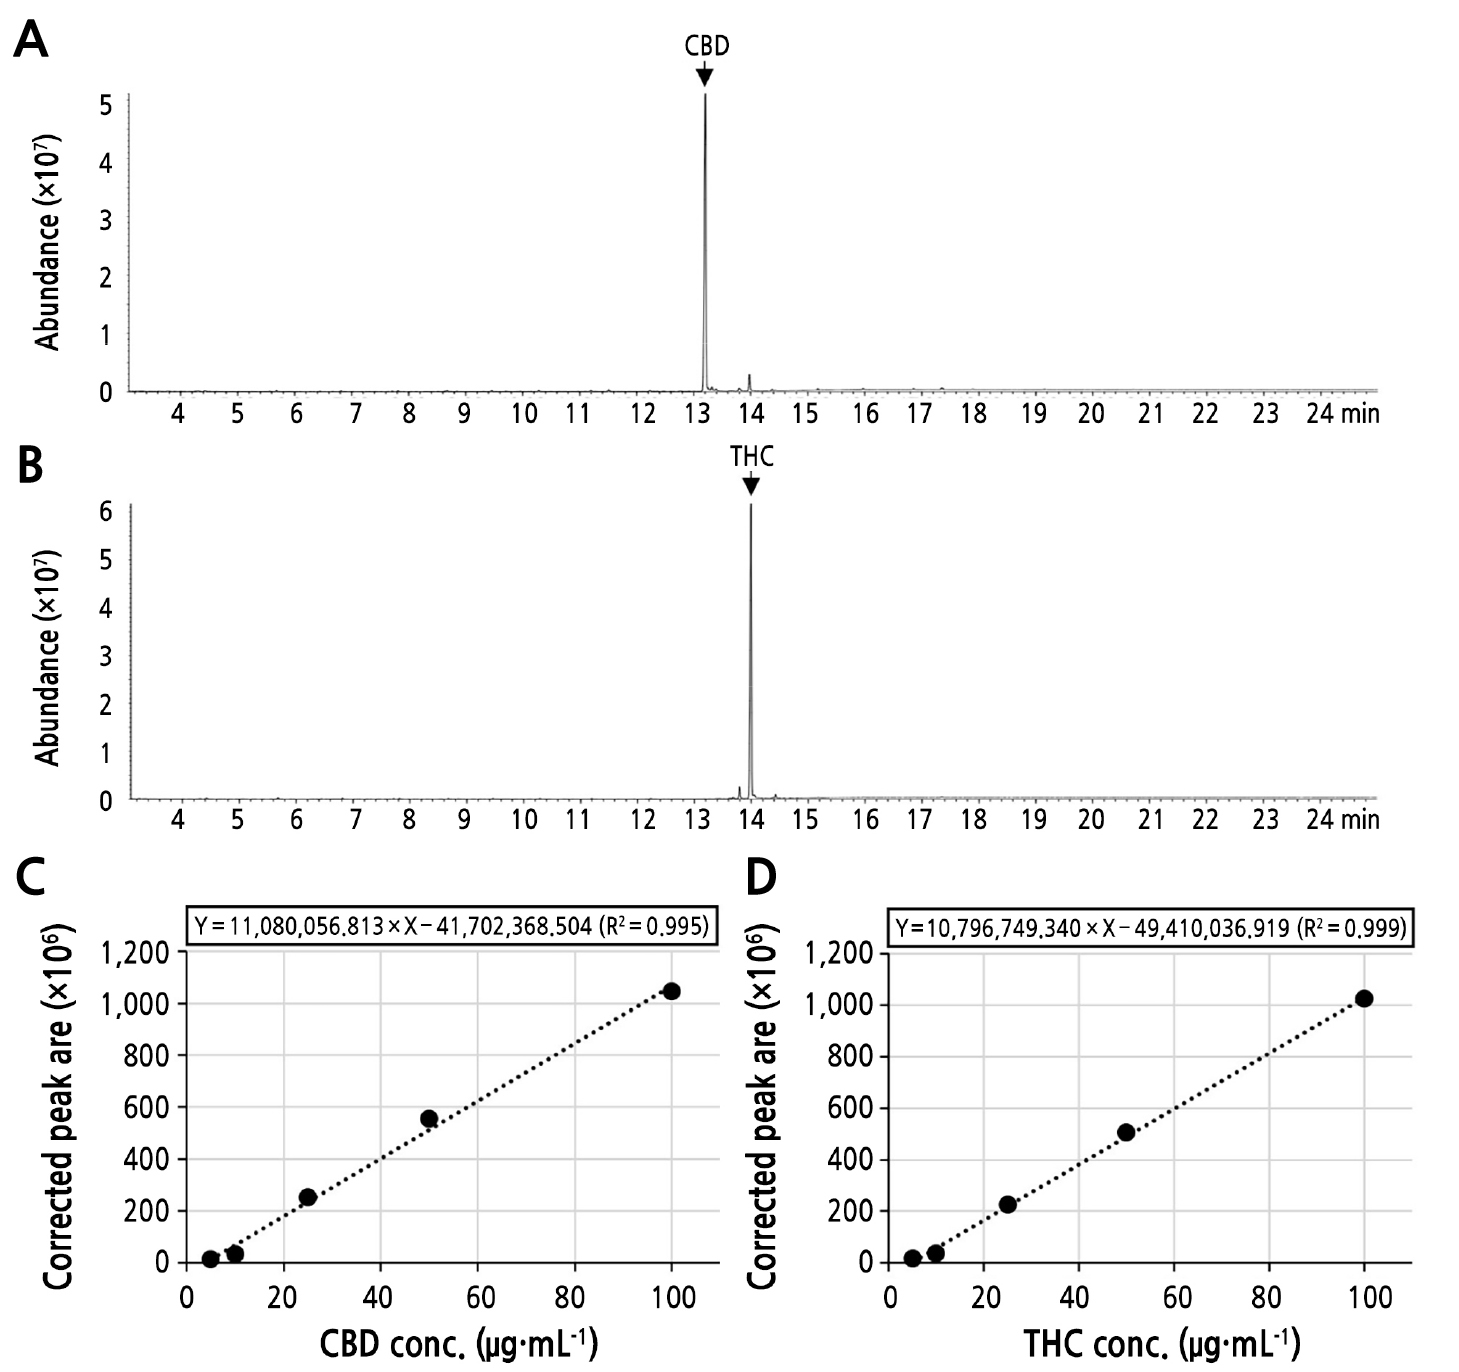
Fig. 1.
Generation of standard calibration curves for CBD and THC. GC-MS total ion chromatograms (TICs) obtained from the analyses of 100 µg·mL-1 of CBD (A) and THC (B). Specific peaks generated in CBD and THC are indicated by arrows. Standard calibration curves generated by GC-MS analyses of different concentrations of CBD (C) and THC (D). For the GC-MS analyses of the CBD and THC standards, 2 µL of the 5, 10, 25, 50 and 100 µg·mL-1 solutions was injected in each case. The corrected peak area value of each sample was collected and used to generate a regression curve. The regression equation and coefficient of determination (R2) are shown above the curve.
CBD and THC Contents of Cheongsam Plants
To analyze the CBD and THC contents, Cheongsam plants at different developmental stages (30 and 90 days for vegetative and reproductive growth stages, respectively) were sampled and analyzed by GC-MS. It was found that 30-day-old Cheongsam plants accumulated very low amounts of both CBD and THC in all tested tissues (Fig. 2A and 2B). In 30-day-old Cheongsam plants, lower leaves showed the highest CBD (0.12%) and THC (0.007%) contents. The overall CBD and THC contents in 30-day-old Cheongsam plants were much lower than those in 90-day-old plants. In 90-day-old Cheongsam plants, distinct accumulations of CBD and THC were observed depending on the tissues tested (Fig. 2A and 2B). The CBD contents of the upper and lower leaves of 90-day-old female plants were –0.39% to –0.08 %, respectively. Leaf tissues of male and female plants accumulated similar amounts of CBD and THC. Female flowers had higher CBD (–0.52%) and THC (–0.029%) contents than male flowers. Male flowers of Cheongsam plants contained less than half the amounts of CBD (–0.012%) and THC (–0.014%) than female flowers. Upper and lower stems of both male and female plants accumulated much lower amounts of CBD (0.00 to 0.03%) and THC (0.00 to 0.001%) than leaves (>10 times higher CBD and THC) and female flowers (>17 times higher CBD and THC). Notably, CBD and THC were not detected from any of the root samples tested. Taken together, our findings suggest that Cheongsam plants accumulate higher amounts of CBD and THC in the reproductive stage (or in older plants) and that they tend to accumulate higher amount of CBD and THC in leaf and flower tissues than in the stem and root tissues.
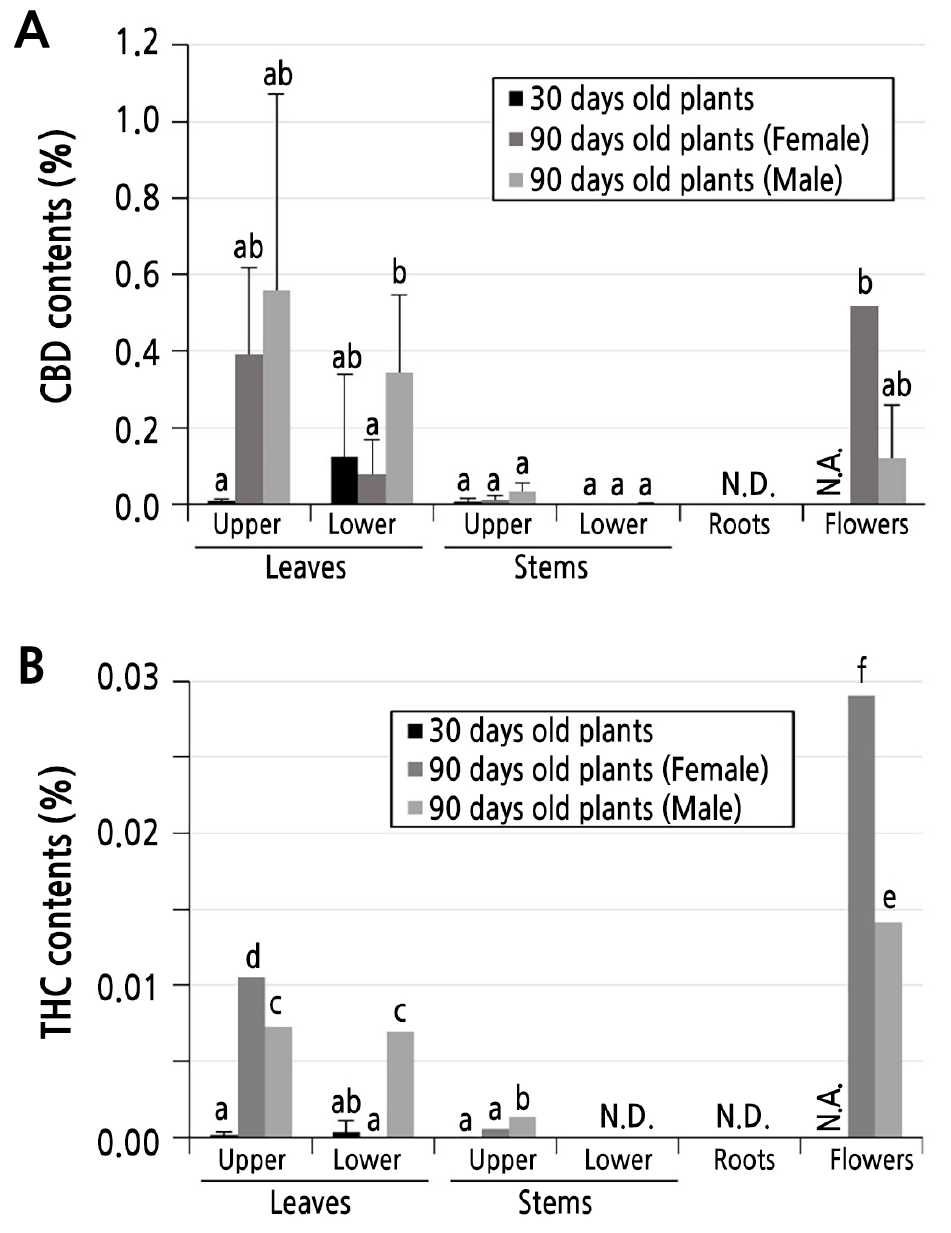
Fig. 2.
CBD and THC contents (%) of Cheongsam plants. CBD (A) and THC (B) contents of Cheongsam plants at different developmental stages (30 and 90 days for vegetative and reproductive growth stages, respectively). Data are presented as the mean ± standard deviation (n = 3). Different letters over the bar indicate significant differences between the means according to Duncan's multiple range test (p < 0.05). N.A.: data not available (no flowers for 30-day-old plants). N.D.: not detected. Upper: leaf and stem tissues sampled within 20 cm above ground. Lower: leaf and stem tissues sampled within 20 cm below the terminal bud.
CBD and THC Contents of Cherry Blossom, Hot Blonde, and Queen Dream
Three cultivars of cannabis plants, Cherry Blossom, Hot Blonde, and Queen Dream, were also tested for their CBD and THC contents using a GC-MS analysis. As cannabis plants at the vegetative stage tend to accumulate lower amounts of CBD and THC (Fig. 2), we only tested these three cultivars of cannabis plants at the flowering stage (90-day-old plants) (Spitzer-Rimon et al., 2019). Notably, all three of these cultivars were feminized. Thus, we only observed female flowers without observing male flowers. In Cherry Blossom, the CBD contents were 1.15, 0.29, 0.43, and 2.45% in the leaf, lower stem, upper stem, and flower tissues, respectively (Fig. 3A). On the other hand, the overall THC contents were 11- to 29-fold lower than the CBD contents in Cherry Blossom plants. In Hot Blonde, the CBD contents were 1.44, 0.11, 0.25, and 3.05% in the leaf, lower stem, upper stem, and flower tissues, respectively (Fig. 3B). The CBD contents in Queen Dream plants were 1.03, 0.03, 0.05, and 3.54% in the leaf, lower stem, upper stem, and flower tissues, respectively (Fig. 3C). Similar to Cherry Blossom, the Hot Blonde and Queen Dream plants contained 10- to 25-fold lower THC contents than CBD contents.
Discussion
In this study, EtOH was used as an organic solvent for phytocannabinoid extraction. In the GC-MS analysis “Ethanol as Internal Standard (IS) method,” the EtOH concentration expressed in mg·L-1 units is constant and equal to its density (Korban et al., 2020). Any attempt to establish an ethanol concentration in mg·L-1 unit by transferring from mg·kg-1 or mg·L-1 units will always lead to the same value. Thus, the ethanol concentrations in both the calibration and any ethanol- containing test samples are constant and equal to the ethanol density (Korban et al., 2020). In addition, previous studies have suggested that EtOH shows high affinity for phytocannabinoids, with absolute EtOH being the most commonly used organic solvent (Dussy et al., 2005; Bruci et al., 2012; Gunjević et al., 2021). In GC/FID, GC/EI-MS, and GC/MS, a multivariate analysis can also be employed to discriminate a large number of cannabis plant samples and extracts into different chemovars based on analyses of their ethanol extracts (Fischedick et al., 2010; Hazekamp and Fischedick, 2012; Elzinga et al., 2015; Giese et al., 2015; Hazekamp et al., 2016; Ciolino et al., 2018; Béres et al., 2019; Namdar et al., 2019). Consistent with previous research, we also propose the use of EtOH as an extraction solvent for use with cannabis plants for a standardized GC-MS analysis.
For medicinal cannabis plants, female flowers are the main products, as they contain more glandular trichomes than male flowers and other organs. Glandular trichomes are known to accumulate hundreds of specific metabolites, including phytocannabinoids CBD and THC (Spitzer-Rimon et al., 2019). Cannabigerol (CBG), a direct precursor of CBD and THC, is synthesized in the plastid of the secretory glandular trichomes and exported via an unknown mechanism into the secretory reservoir of glandular trichomes. CBG is then converted into CBDA or THCA by their corresponding synthases (Gülck and Møller, 2020). Heat can convert THCA and CBDA into THC and CBD, respectively (Tanney et al., 2021). Leaves and stems have the second highest amounts of glandular trichomes after flowers (Andre et al., 2016). Other morphological parts, including seeds (Ross et al., 2000), roots (Stout et al., 2012), and pollen (Ross et al., 2005), also contain low amounts of glandular trichomes in different degrees depending on whether the cannabis is the drug type or fiber type. Thus, the concentrations of CBD and THC are dependent on the tissue type, age, variety, growth conditions at harvest time, and storage conditions (Khan et al., 2014). In our experiments, cannabis cultivars also showed different potency levels for producing CBD and THC depending on their organs (Figs. 2 and 3). Consistent with previous reports, female flowers demonstrated the highest potency for producing CBD and THC in all tested cultivars (Andre et al., 2016; Gülck and Møller, 2020). After female flowers, leaf tissues accumulated higher amounts of CBD and THC than the other organs tested here. Thus, female flowers would be the best target for testing the phytocannabinoid potency and/or CBD-to-THC ratio of unknown cannabis plants.
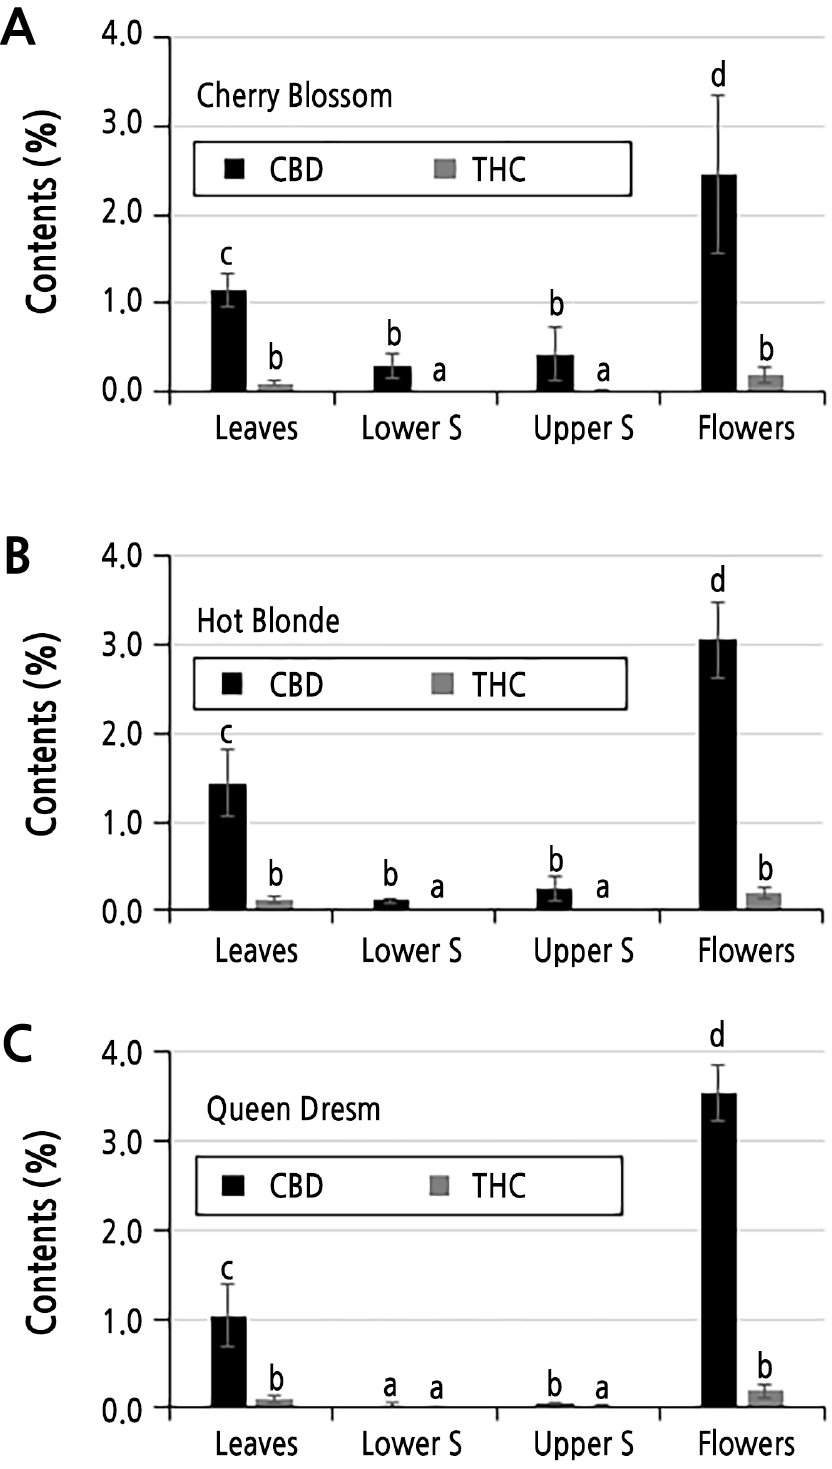
Fig. 3.
CBD and THC contents (%) of Cherry Blossom, Hot Blonde, and Queen Dream plants. CBD and THC contents of different tissues of Cherry Blossom (A), Hot Blonde (B) and Queen Dream (C) plants. Three different cultivars of hemp plants at the reproductive growth stage (90-day-old) were used. Data are presented as the mean ± standard deviation (n=3). Different letters over the bar indicate significant differences between the means according to Duncan's multiple range test (p < 0.05). Lower S: lower stem tissues sampled within 20 cm above ground. Upper S: upper stem sampled within 20 cm below the terminal bud.
In this study, we tested CBD and THC contents in different tissues of four cannabis cultivars. In our experimental conditions, the Cherry Blossom, Hot Blonde, and Queen Dream cultivars showed higher potency for CBD and THC production than Cheongsam. However, the CBD and THC contents can vary not only depending on the tissue type and variety but also depending on the growth conditions, harvest time, and storage conditions (Khan et al., 2014). Thus, it will be important to test the effects of different growth conditions on the CBD and THC contents of cannabis plant in further studies.
