

Introduction
Materials and Methods
Plant Materials and Growth Condition
Photosynthesis Response
Chlorophyll and Carotenoid Contents
Chlorophyll a Fluorescence
Growth Characteristics and Water Saturation Deficits
Results and Discussion
Soil Water Content (SWC)
Photosynthesis Response
Chlorophyll and Carotenoid Contents
Chlorophyll a Fluorescence
Growth Characteristics and Water Saturation Deficits (WSD)
Conclusion
Introduction
Climate change is the most pressing environmental issue confronting humanity, caused mainly by an increase in greenhouse gas emissions stemming from human activities. Carbon dioxide produced by fossil fuels and industrialization accounts for roughly 65% of greenhouse gas emissions, with atmospheric CO2 levels increasing from 315.98 ppm in 1959 to 411.43 ppm in 2019 (Malhi et al., 2021). The emission of greenhouse gases has steadily raised the atmospheric temperature; in the case of the Korean Peninsula, the average temperature has risen by 1.8°C over the last 100 years. In particular, the average temperature over the last 40 years (since 1971) has risen sharply by 1.4°C (Yu et al., 2020).
Climate change is also projected to affect precipitation patterns in various regions and to increase the duration and/or intensity of drought worldwide (Jiang et al., 2020). These changes can affect both the quantity and quality of crop production, with some estimating that by 2100, approximately 5–20% of global GDP may be adversely affected (Stern, 2006).
According to the Intergovernmental Panel on Climate Change (IPCC) Fifth Assessment Report, if the global mean temperature rises by 1.5–2.5°C, approximately 20–30% of animal and plant species will become extinct, which will have an irreversible negative impact on the ecosystem, such as a drastic change in geographical distributions (IPCC, 2014). The IPCC (2014) used the Representative Concentration Pathway (RCP) scenario to propose a broad range of future climate changes. RCP refers to the degree of the effect of altering the energy balance due to radiative forcing, e.g., greenhouse gases. RCP 6.0 is a representative intermediate scenario that depicts a situation in which the greenhouse gas reduction policy has been partially met. The RCP 6.0 scenario predicts that the global mean surface temperature will rise by 1.4–3.1°C between 2081 and 2100 (Newth and Gunasekera, 2018), with the carbon dioxide (CO2) concentration and temperature increasing by 670 ppm and 2.7°C, respectively, on the Korean Peninsula (Korea Meteorological Administration, 2018). Climate change can directly influence the cultivation of economically valuable species with seasonal phenology and productivity fluctuations. Therefore, it is necessary to determine the relationship between the physiological characteristics of each species and pertinent environmental factors.
Jujube (Ziziphus jujuba Mill.) is a species of Rhamnaceae that grows in the regions around China, Mongolia, and Central Asia. It is also an economically and culturally significant crop in Australia, Russia, Northern Africa, Southern Europe, and Central and South America (Hernández et al., 2016). Jujube is a preferred species for restoring vegetation and in ecological reconstruction efforts owing to its outstanding adaptability to marginal land and a broad range of climate conditions. It is an ideal crop in arid and semi-arid areas of temperate and subtropical regions (Jiang et al., 2020). Jujube also possesses various medical properties, including anticancer, anti-inflammatory, antioxidant, antifungal, anti-allergic, sedative, hypnotic, and anxiolytic effects (Guo et al., 2015; Wang et al., 2022). As a result, its popularity among consumers has increased worldwide.
Most previous studies of jujube focused on the quality of its fruits and on its therapeutic effects (Guo et al., 2015; Almansa et al., 2016; Hernández et al., 2016; Jiang et al., 2020), with few studies investigating the tree's physiological response and development (Cruz et al., 2012; Xia et al., 2014).
The impact of environmental conditions on the growth of seedlings should be reviewed, especially to cultivate jujube, a commercially valuable plant, sustainably; however, no preliminary studies have been conducted. Only a few studies have focused on the consequences of extreme climate events such as drought stress. This study aims to provide baseline data for the development of efficient plant management strategies and damage prediction models by evaluating the impacts of climate change (RCP 6.0) and drought stress on the growth and physiological characteristics of Z. jujuba var. inermis.
Materials and Methods
Plant Materials and Growth Condition
The National Institute of Forest Science provided 2-year-old Z. jujuba var. inermis grafts on March 20, 2020. The plants were potted in 15-L plastic pots containing a 1:1:1 mixture (V/V/V) of peat moss, perlite, and vermiculite. One plant was grown in each pot for 50 days. Additionally, Multifeed 20 (N:P:K = 20:20:20) was diluted to 2 g/L and fertilized twice with 400 ml each to promote rooting. Before the leaves unfolded, the heights were evenly adjusted to 40 cm.
Natural light soil-plant daylight system (SPDS) chambers with precise environmental control were used to simulate atmospheric carbon dioxide concentrations and temperatures under climate change conditions at the Korea National University of Agriculture and Fisheries' Climate Change Education Center. Ten trees were assigned to each of the following groups: Control (Control-WW), control + drought (Control-DS), Climate change (RCP 6.0-WW), and Climate change + drought (RCP 6.0-DS). The CO2 concentration in the Control group was maintained at 400 ppm and the interior temperature of the chambers was regularly altered based on meteorological conditions from the previous three years. The CO2 concentration in the Climate change group (RCP 6.0) was 650 ppm, and the interior temperature was set to Control + 3°C (Fig. 1). Control-DS and RCP 6.0-DS were subjected to moderate drought stress for 12 days by cutting off the water supply from July 27 to August 7.

During the experiment, a meteorological sensor mounted in the chamber was used to measure the temperature and relative humidity. Furthermore, the soil moisture content was monitored at 2-h intervals by inserting a soil moisture sensor (soil moisture sensor, 10HS, ONSET, USA) to a depth of 15 cm in each treatment group.
Photosynthesis Response
The photosynthetic and stomatal responses were measured using a portable photosynthesis system (Li-6800, Li-Cor Inc., Lincoln, NE, USA) on August 7th and 8th, with five repetitions. The photosynthetic photon flux density was set to 1,000 µmol·m-2·s-1 during the measurement with an LED light source attached to the photosynthesis-measuring device. The net photosynthesis rate (A), stomatal transpiration rate (E), stomatal conductance (gs), and intercellular CO2 concentration (Ci) were measured, and the intrinsic water use efficiency (WUEi) and stomatal limitation (Ls) were computed by applying the measured results (Zheng et al., 2011; Xia et al., 2014). Furthermore, based on the method of Ethier and Livingston (2004), the intercellular CO2 response curve (A-Ci) at CO2 concentrations of 0–1,400 µmol·m-2·s-1 was measured, and the maximum carboxylation rate (Vcmax), maximum electron transport rate (Jmax), and mesophyll conductance (gm) were calculated (Sharkey et al., 2007; Kodama et al., 2011). The temperature in the chamber was kept constant at 25 ± 1°C, while air inflow into the chamber was kept constant at 600 µmol·s-1.
Chlorophyll and Carotenoid Contents
Five leaves from each treatment group were collected after the completion of all physiological response experiments; an amount of 0.1 g of leaf pieces was placed in a 20 ml glass container containing 10 ml of a dimethyl sulfoxide (DMSO) solution, and pigments were extracted in a thermostat chamber for 6 h at 60°C (Hiscox and Israelstam, 1979). The extracted sample was examined for absorbance at wavelengths of 663, 645, and 470 nm using an ultraviolet/visible spectrophotometer (UV/VIS spectro-photometer, HP 8453, Hewlett-Packard, USA). The quantities of chlorophyll a, b, total chlorophyll, and carotenoids were computed (Arnon, 1949; Lichtenthaler, 1987; Lee et al., 2021a). A SPAD meter was also used to compare leaf colors.
Chlorophyll a Fluorescence
On August 7, chlorophyll fluorescence was measured six times per treatment group by means of an OKJIP analysis (a polyphasic increase of chlorophyll a fluorescence transients). Leaves were dark-adapted for 20 minutes before the measurement using a leaf clip. A plant efficiency analyzer (PEA; Hansatech Ltd., King's Lynn, Norfolk, England) was used to record the data. The saturating light pulse intensity was set to 3,500 µmol·m-2·s-1 for the measurements, with a pulse duration of 1 second, and the chlorophyll fluorescence density was assayed at 50 µs (stage O), 300 µs (stage K), 2 ms (stage J), 30 ms (stage I), and 500 ms (stage P) (Sousaraei et al., 2021). The following results were obtained from the OKJIP analysis: relative variable fluorescence at the J-step (VJ), relative variable fluorescence at the k-step (V), reaction center per absorption flux (RC/ABS), slope at the origin of the fluorescence rise (Mo), quantum yield at t = 0 for energy dissipation (φDo), efficiency with which an electron can move from reduced intersystem electron acceptors to PS I end electron acceptors (δRo), energy dissipation flux per reaction center at t = 0 (DIo/RC), performance index on absorption basis (PIabs), driving force on absorption basis (DFabs) and structure function index on absorption basis (SFIabs) (Strasser et al., 2000; Wang et al., 2012; Lotfi et al., 2018; Choi and Jung, 2020; Shin et al., 2020; Lee et al., 2021a).
Growth Characteristics and Water Saturation Deficits
At the end of the experiment, five samples were used to examine the height and diameter at the root collar (DRC). A tape measure was used to measure the height of the samples, and the DRC was measured at a point 1 cm above the ground using Vernier calipers. Additionally, to determine the dry weight (DW), samples were separated into leaves, stems, and roots and then placed in a dryer (DS-80-5, Dasol Scientific Co. Ltd., Gyeonggi-do, Korea) for 48 h at 80°C. The results computed the T/R ratio, leaf weight ratio, and root weight ratio.
To examine the water saturation deficits (WSD), the fresh weight (FW) was measured immediately after leaf cutting. Subsequently, to measure the turgid weight (TW), water was allowed to be absorbed for at least 24 h to reach the equilibrium state for maximum water-holding at a dark room temperature (20–25°C). Thereafter, the samples were dried for 48 h at 80°C to determine the DW, and the WSD (WSD = TW – DW / FW - DW) was calculated (Lee et al., 2022).
The statistical analysis was conducted using the SPSS statistics program version 19.0 (IBM Corp. Armonk, NY), and the variance homogeneity was assessed using Levene's test. If the assumptions were satisfied, one-way analysis of variance and Duncan's multiple range test post hoc analysis were used; otherwise, Welch's test and Games-post Howell's hoc analysis were used. All statistical analyses were conducted at a significance level of p < 0.05.
Results and Discussion
Soil Water Content (SWC)
Immediately before re-irrigation, the SWC of Control-WW decreased by approximately 5.4% (on August 3rd at 12 pm), whereas that of RCP 6.0-WW decreased by 3.5% (on August 3rd at 12 pm). With identical irrigation cycles and volumes, the degree of decline in SWC under the climate change treatment was greater. Furthermore, after the drought treatment, the SWC values of Control-DS and RCP 6.0-DS were 24.5% and 25.8%, respectively. A gradual decrease in RCP-DS was observed, reaching nearly 0% on August 3rd at 8 am, whereas Control-DS reached 0% on August 4th at 12 pm, indicating a sharper decline in RCP 6.0-DS than Control-DS (Fig. 2).
This result implies the tendency for SWC to decrease more rapidly than the Control under RCP 6.0. As overall biomass levels, such as the leaf weight and height, in RCP 6.0 were greater, water consumption would likely rise as well.

Photosynthesis Response
Comparing the net photosynthetic rate (A) of jujube, RCP 6.0-WW showed a higher tendency than Control-WW. However, RCP 6.0-WW had decreased E and gs values (Table 1). When atmospheric CO2 concentrations increase under high light intensity levels, the CO2 saturation concentration of plants and the maximum photosynthetic rate increase (Hopkins and Hüner, 2008). Kimball et al. (2002) reported that the partial pressure of CO2 in plants increases with an increase in the atmospheric CO2 concentration, which facilitates the diffusion of CO2 from the atmosphere to the photosynthetic organs, thereby increasing the photosynthetic rate. This CO2 fertilization effect can be observed in forest trees such as Liriodendron tulipifera L. (Lee et al., 2013), Quercus serrata Murray, and Abies koreana E. H. Wilson (Song et al., 2020) and in fruit trees such as Prunus persica (Lee et al., 2021b) and Vitis vinifera (Son et al., 2014).
Nonetheless, a relatively high rate of photosynthesis can also increase water consumption within the plant, depending on the species. When the atmospheric CO2 concentration and temperature increase, stomatal conductance is reduced due to osmotic stress. The mechanism of transpiration suppression was elucidated in previous studies (Leymarie et al., 1999; Lee et al., 2005; Lee et al., 2021b). In particular, in angiosperms, when the atmospheric CO2 concentration surpasses 600 µmol·m-2·s-1, gs tends to decrease significantly. It has been observed that this stomatal closure optimizes the effectiveness of water use by enhancing water use efficiency (Brodribb et al., 2009).
In this instance, the rate of photosynthesis increases due to the high residual CO2 concentration in the cell, occurring even when the stomata are closed (Zhou and Quebedeaux, 2003; Lee et al., 2021a). The photosynthetic rate is determined not by the atmospheric CO2 concentration but by the intracellular CO2 concentration in the area where carboxylation occurs in the chloroplast. Generally, it is assumed that the intracellular CO2 concentration is in equilibrium with the intercellular CO2 concentration (Ci) (Hopkins and Hüner, 2008). In RCP 6.0-WW, when the atmospheric CO2 concentration was adjusted to 670 µmol·m-2·s-1, jujube tended to show reduced stomatal conductance and increased stomatal limitation (Ls). Although the atmospheric CO2 inflow can be reduced, it is clear that maintaining a high Ci facilitates the increase in A (Table 1).
Similarly, when drought stress was additionally induced under these conditions, A in Control-DS decreased by approximately 57% compared to that in Control-WW. A in RCP 6.0-DS was reduced by approximately 73% compared to that in RCP 6.0-WW, resulting in a more rapid decline (Table 1). According to Cruz et al. (2012), jujube actively regulates the osmotic pressure from the early stage of stress to respond to drought stress so as to maintain the leaf turgor pressure, reduce stomatal conductance, and shorten the stomatal release time to the maximum, thereby regulating the rate of transpiration.
Plants typically respond to drought stress at moderate drought intensity levels by regulating photosynthesis via stomatal limitation. Nonetheless, at severe or chronic drought intensity levels, plants react to non-stomatal limitations (Chaves et al., 2009), resulting in a metabolic and structural shift. Non-stomatal limitations impact the photosynthetic capacity and drought tolerance (Wang et al., 2012).
The Control-DS had comparatively high intrinsic water use efficiency (WUEi) rates; however, no significant differences were found (p > 0.05), indicating that the water balance in these plants was maintained relatively well. The total value in the climate change groups was approximately double that of the control, indicating that the rise in WUEi is related to climate change conditions (Table 1). The stomatal closure response to high CO2 levels in the atmosphere is crucial in determining the water use efficiency (Farquhar and Sharkey, 1982).
Table 1.
Effects of drought stress on several photosynthetic parameters of Z. jujube under control and RCP 6.0 conditions
| Treatment |
Az (µmol·m-2·s-1) |
Ey (mmol·m-2·s-1) |
gsx (mmol·m-2·s-1) |
Ciw (µmol·m-2·s-1) |
WUEiv (µmol·mmol-1) |
LSu (%) |
| Control-WW | 7.3 bt | 1.46 d | 108.9 d | 272.9 a | 68.8 a | 30.4 a |
| Control-DS | 3.1 a | 0.60 b | 40.1 b | 263.0 a | 78.1 a | 33.7 a |
| RCP 6.0-WW | 10.2 c | 0.94 c | 64.5 c | 350.2 b | 171.6 b | 45.2 b |
| RCP 6.0-DS | 2.8 a | 0.21 a | 14.6 a | 276.8 a | 193.5 b | 53.3 b |
As a result of climate change conditions that increase atmospheric CO2 levels and temperatures, both A of jujube and the reaction to reduce water loss, in this case stomata closure, increase. Maintaining water in the plant, especially under drought stress, is crucial to ensure that these plants adapt to climate change conditions.
The photosynthetic capacity of plants declines when they are exposed to high CO2 concentrations for an extended period, despite an increase in photosynthetic rate due to the effect of CO2 fertilization (Cen and Sage, 2005; Ainsworth and Rogers, 2007; Wang et al., 2012; Song et al., 2020). The photosynthetic capacity is determined by the balance between the maximum carboxylation rate (Vcmax), which indicates Rubisco activity, and the regeneration rate of ribulose-1,5-bisphosphate (RuBP), which is limited by the electron transfer efficiency. Therefore, the maximum electron transfer rate (Jmax) is an important indicator.
With jujube, Vcmax decreased by approximately 19.6% and Jmax by 27.8% in RCP 6.0-WW compared to Control-WW, implying that climate change conditions reduce the photosynthetic capacity. Additionally, a significant reduction in the photosynthetic capacity was observed. Notably, RCP 6,0-DS had the lowest Vcmax and Jmax values. The overall photosynthetic capacity was significantly reduced as the efficiency of Rubisco in fixing CO2 decreased and the regeneration of RuBP was delayed (Fig. 3).
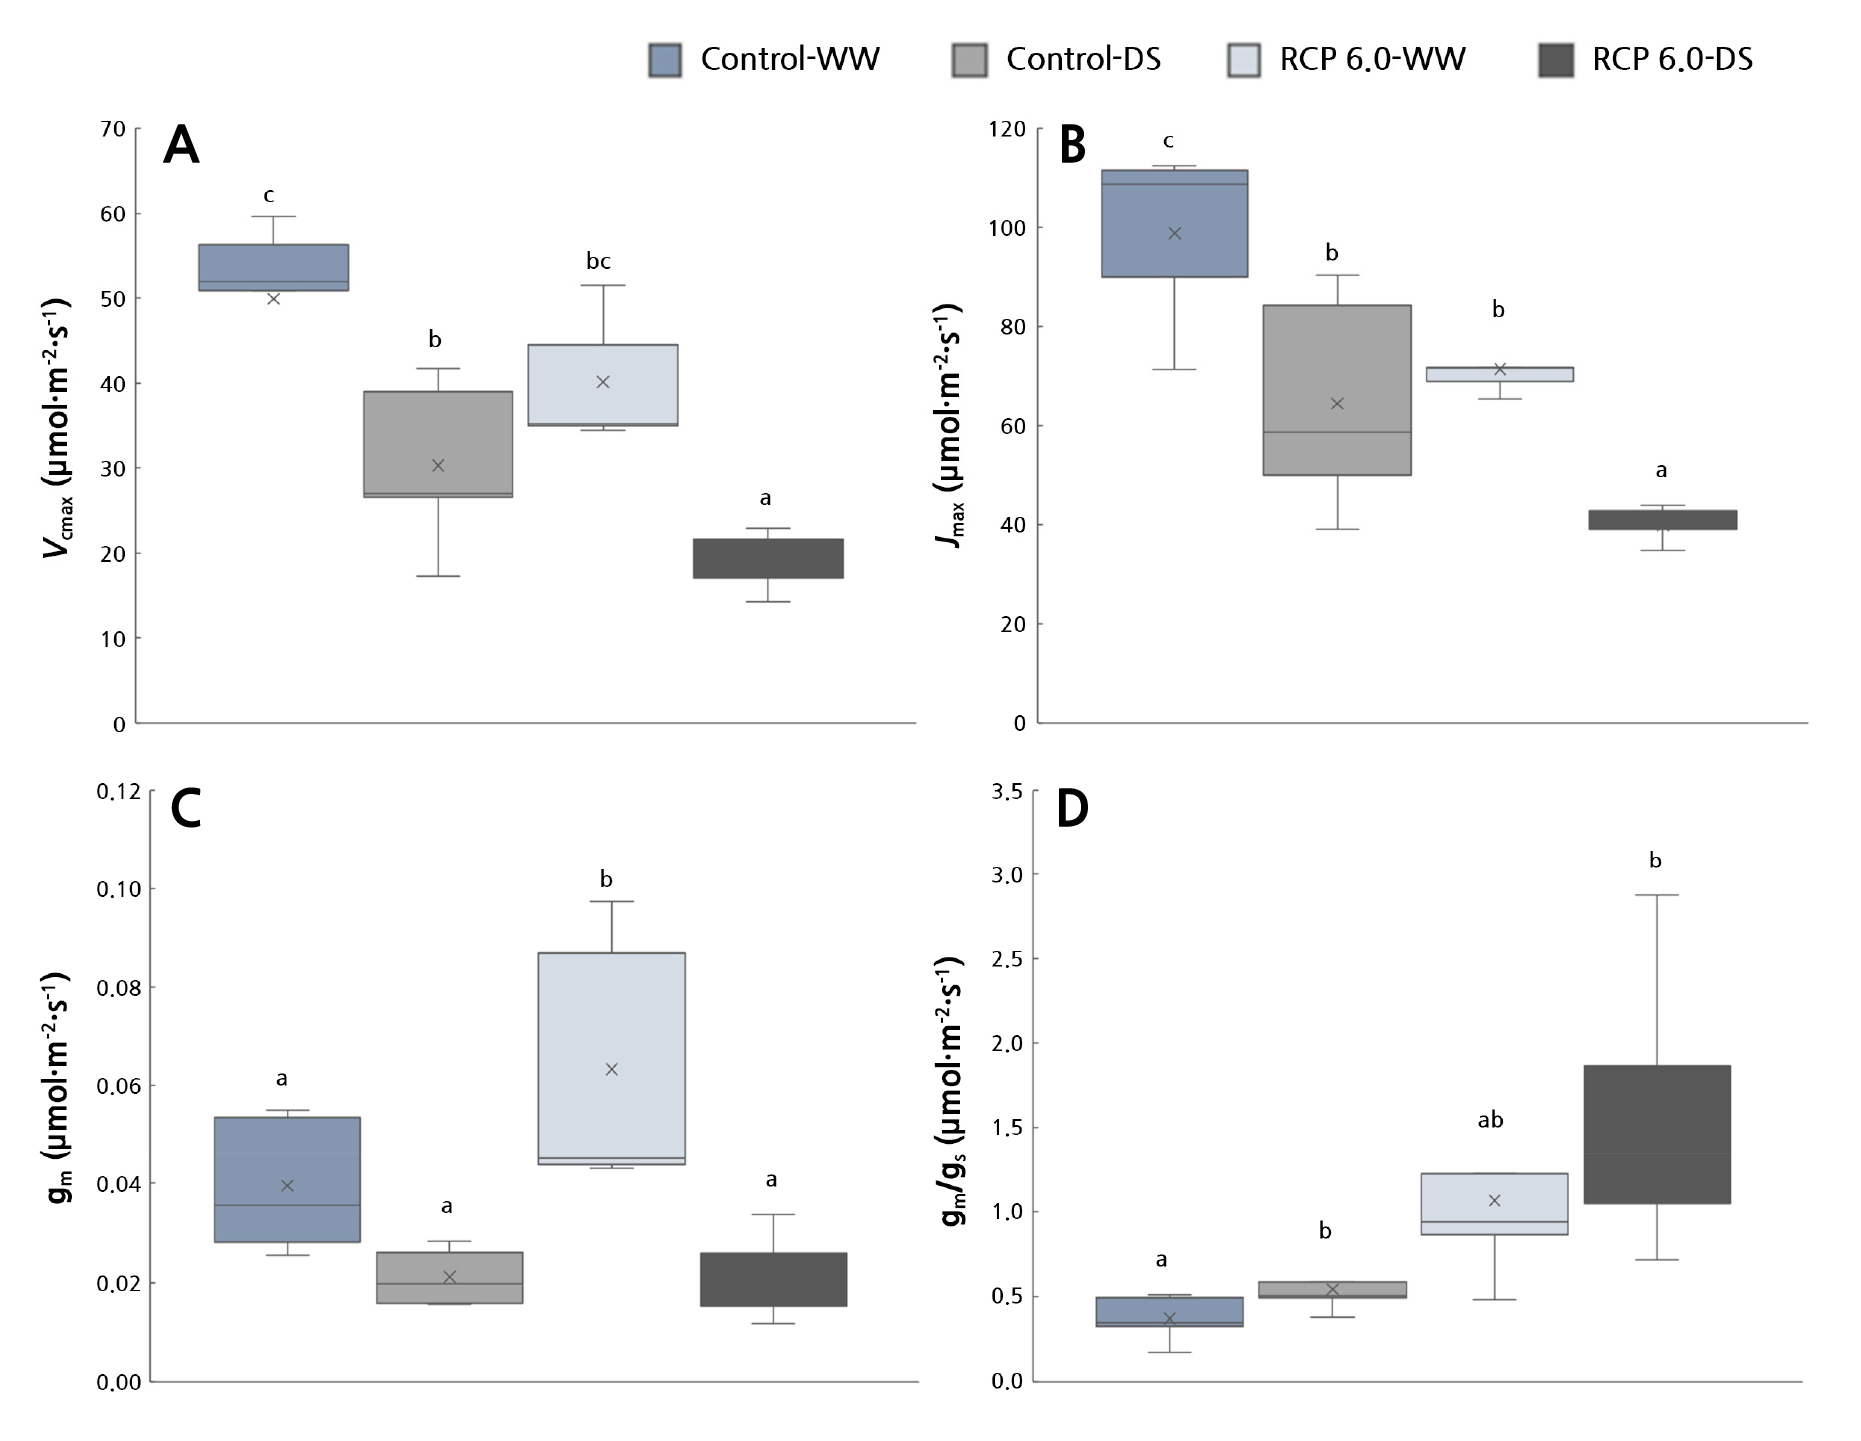
Fig. 3.
Changes in (A) the maximum carboxylation rate (Vcmax), (B) maximum electron transport rate (Jmax), (C) mesophyll conductance (gm), and (D) mesophyll conductance / stomatal conductance (gs) of Z. jujube under the control and RCP 6.0 conditions. Different letters indicate significant differences according to DMRT (A) and Games-Howell tests (B, C, D) (p < 0.05).
When growth in the presence of elevated CO2 concentrations is prolonged, this reduction in the photosynthetic capacity occurs as the promotion of photosynthesis caused by the increase in the partial pressure of CO2 decelerates (Lee et al., 2021a). Kitao et al. (2015) claimed that intracellular starch granules accumulate and that the cell wall thickens under high CO2 concentration conditions, thereby inhibiting the diffusion of CO2 in the chloroplast and resulting in a decrease in the photosynthetic rate and capacity.
Nevertheless, the respiration rate and the consumption of photosynthate increase when the growth temperature is increased along with the CO2 concentration. Consequently, it has been reported that when starch accumulation is reduced while rapid electron transfers between the affected organs, inhibition of photosynthesis is alleviated (Ro et al., 2001). In this study, as both the atmospheric CO2 concentration and the growth temperature were increased by an average of 3°C, photosynthesis inhibition may have occurred due to the temperature. It was observed that the jujube in RCP 6.0-WW had a significantly high gm value (Fig. 3), referring to the conductivity of the pathway through which CO2 diffuses from the intercellular space to the carboxylation area (Flexas et al., 2013). The movement of CO2 in the chloroplast matrix is smooth during intracellular CO2 diffusion despite the relatively closed stomata compared to the Control-WW condition (Table 1). This increase in diffusion can help increase A along with a high concentration of CO2 in Ci.
In addition, RCP 6.0-DS showed low gm value, similar to those of Control-WW and Control-DS; however, gm/gs was maintained at a higher level than gm, signifying that the mesophyll conductance ratio was relatively high compared to the decrease in stomatal conductance. Drought-tolerant Populus trees also maintain a high gm/gs ratio as the decrease in gm is delayed for several days compared to gs under water stress (Lee et al., 2014). Therefore, under RCP 6.0-DS, jujube exhibits a response that signals the maintenance of a relatively high gm value by using intercellular CO2, even when the stomata are closed to respond to drought stress.
Consequently, jujube maintains a relatively high A due to the high intercellular CO2 concentration and gm improvement despite the increased stomatal closure and decreased photosynthetic capacity under climate change conditions. In contrast, the vulnerability to drought stress noticeably increases.
Chlorophyll and Carotenoid Contents
Chlorophyll contents differ between species when atmospheric CO2 concentrations and temperatures increase. The increasing CO2 concentration reduces the chlorophyll a, b, total chlorophyll, and carotenoid contents in Maackia amurensis Rupr. (Han et al., 2011). Similarly, when Prunus persica was exposed to a CO2 concentration of 940 ppm, chlorosis and early defoliation post-harvest increased (Lee et al., 2021b). The jujube in RCP 6.0-WW had a lower chlorophyll b level than that in Control-WW; however, there was no significant difference between the jujube in the Control-WW and RCP 6.0-WW conditions in general (Table 2). These results are similar to those of L. tulipifera (Lee et al., 2013) and Viburnum opulus L. var. calvescens (Han et al., 2011).
Nonetheless, the chlorophyll a, b, total chlorophyll contents as well as the chlorophyll a/b ratio and SPAD level were reduced in both drought stress groups (Control-DS and RCP 6.0-DS), and because there was no significant difference in the carotenoid contents, the decrease in chlorophyll was the leading cause of the decline in the T Chl/Car value. This tendency was more noticeable in RCP 6.0-DS (Table 2), implying that climate change combined with drought increases the loss of chlorophyll.
Table 2.
Effects of drought stress on SPAD, chlorophyll (Chl), and carotenoid (Car) contents of Z. jujube under control and RCP 6.0 conditions
| Treatment | Chl (mg·g-1) | Car (mg·g-1) | Chl a/b | T Chl/Car | SPAD | ||
| a | b | a + b | |||||
| Control-WW | 14.8 bz | 3.5 b | 18.3 b | 4.0 ns | 4.3 ab | 4.5 bc | 33.9 b |
| Control-DS | 12.3 ab | 3.1 ab | 15.4 ab | 3.7 | 3.9 ab | 4.2 b | 31.0 ab |
| RCP 6.0-WW | 14.8 b | 3.2 ab | 18.0 b | 3.6 | 4.6 b | 5.0 c | 31.0 ab |
| RCP 6.0-DS | 10.1 a | 2.6 a | 12.7 a | 3.9 | 3.9 a | 3.3 a | 27.6 a |
The decrease in the chlorophyll contents under climate change conditions is caused by the increase in the overall growth of the plants, which led to the depletion of nitrogen in the soil. Thus, only a limited amount of nitrogen was delivered to the leaves (Long et al., 2004). Separately, under drought conditions, a decrease in the chlorophyll content may occur due to a moisture deficit in the leaves, causing damage to the chloroplast membranes (Saraswathi and Paliwal, 2011). This means that a combination of climate change and drought conditions would accelerate the decrease in the chlorophyll content.
Chlorophyll a Fluorescence
The complicated relationship between the fluorescence kinetics and photosynthesis underlies photosynthetic biophysical processes (Kalaji et al., 2016). Primarily, an OKJIP fluorescence analysis can be used as a predictor of stress tolerance and physiological disorders before visible signs of stress appear, quantitatively showing physiological responses to various environmental stresses (Strasser et al., 2000; Kalaji et al., 2016; Lee et al., 2021a; Lee et al., 2022). A comparison showed that there was no significant difference between Control-WW and Control-DS on the OKJIP curve of jujube. As the temperature and atmospheric CO2 were increased, RCP 6.0-DS tended to increase at the O-J step and decrease at the I-P step (Fig. 4). The O-J step is related to the closure of the photosystem II (PS II) reaction center, which is determined by the ratio of reoxidation to the trapping rate of QA-. The reduction of secondary electron acceptors QB, plastoquinone, cytochrome b6f complex (Cyt b6f), and plastocyanin is represented by the J-I step of the curve (Kalaji et al., 2016). Additionally, the appearance of the I-P phase of the OKJIP curve is also associated with a decrease in electron transporters on the PS I receptor side. These results show that plants under the RCP 6.0-DS condition have a more deactivated PS II reaction center compared to those in the other treatments tested here. The electron acceptor of PS I, which transfers electrons emitted from PS II to ferredoxin reductase, is also in a reduced state, indicating that the flow of electrons does not proceed smoothly.

The detailed chlorophyll fluorescence indicators calculated by means of the OKJIP curve analysis are shown in Fig. 5. Under RCP 6.0-DS, there were noticeable increases in VK/VJ, Mo, DIo/RC, and φDo and decreases in RC/ABS, δRo, PIabs, DFabs, and SFIabs. An increase in VK/VJ indicates the inactivation of the oxygen-evolving complex (OEC) (Lee et al., 2021a). Stressors such as drought inhibit the OEC and block the electron transport between OEC and tyrosine (Guha et al., 2013). In addition, if the supply of electrons to the PS II reaction center is limited by incomplete water splitting, it can lead to excessive excitation energy and the production of reactive oxygen species (ROS). These excitation energy outcomes and ROS consequently lead to oxidative damage to the thylakoid membrane inside the chloroplast (Giorio and Sellami, 2021). Similarly, the size of the active PS II reaction center per antenna chlorophyll (RC/ABS) decreased in the order Control-WW > RCP 6.0-WW > Control-DS > RCP 6.0-DS (Fig. 5). Mo, which represents the reaction center in the closed state, increased significantly under RCP 6.0-DS, suggesting that the reaction center in the inactive state was visibly increasing. Consequently, in RCP 6.0-DS, the restriction on the electron donor side of PS II increased (VK/VJ) as the reaction center was deactivated (RC/ABS), causing a dramatic increase in the dissipation of energy that can cause oxidative stress as heat (DIo/RC and φDo), and it has been shown that the efficient movement of electrons (δRo) to the terminal electron acceptor is blocked even in PS I (Strasser et al., 2000; Jiang et al., 2008; Lotfi et al., 2018).
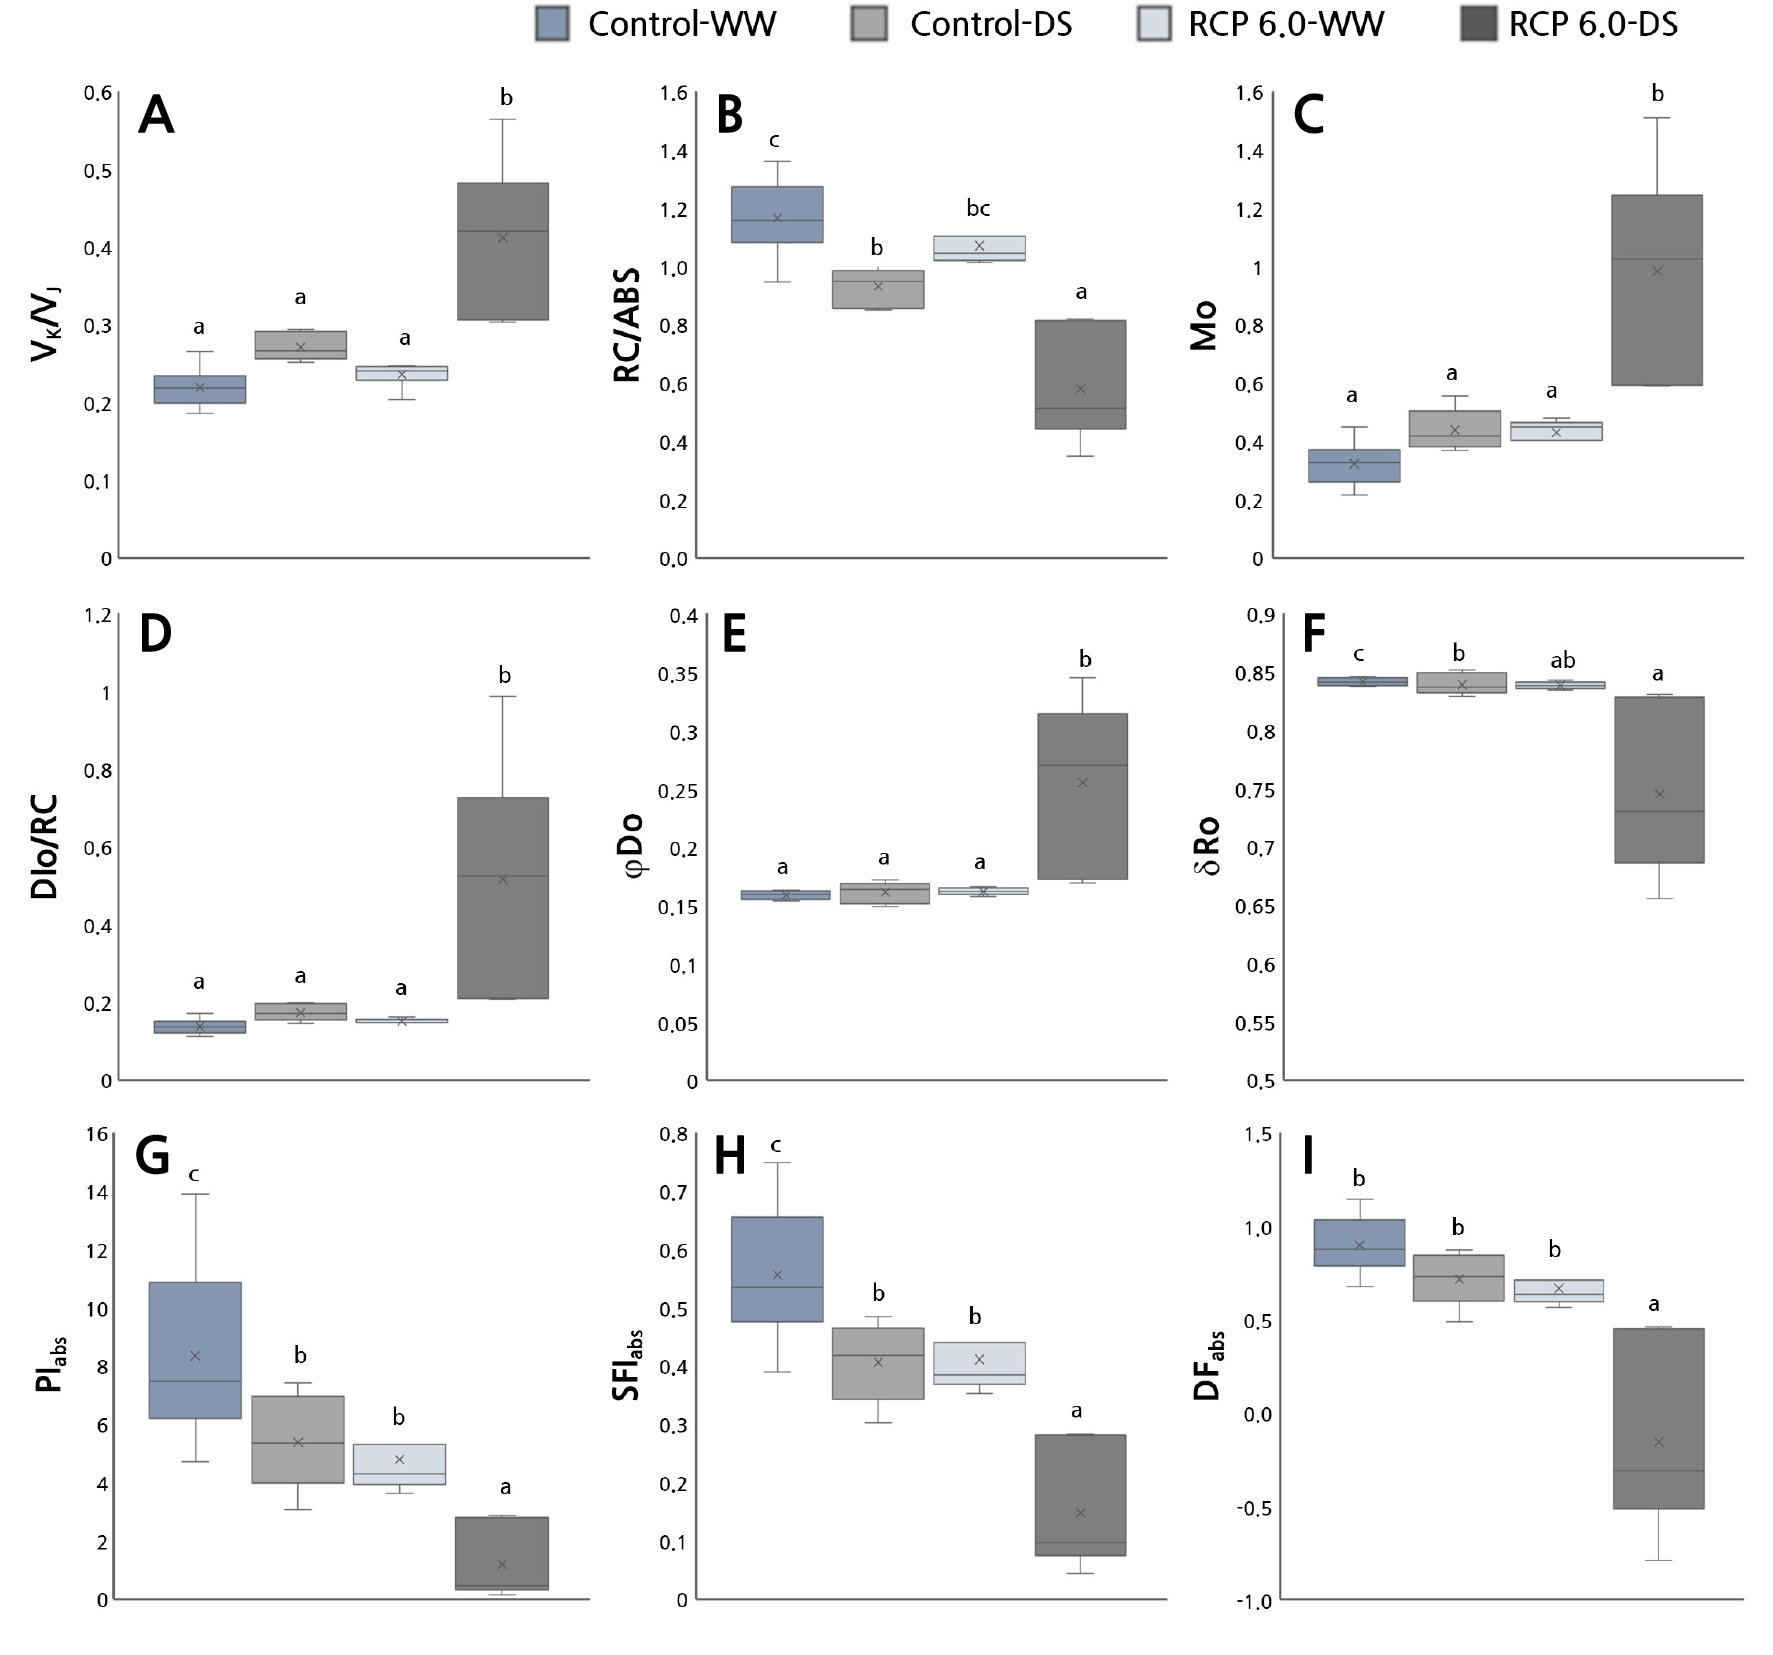
Fig. 5.
Changes in several chlorophyll fluorescence parameters: ((A) VK/VJ, (B) RC/ABS, (C) Mo, (D) DIo/RC, (E) φDo, (F) δRo, (G) PIabs, (H) DFabs, and (I) SFIabs) of Z. jujube under control and RCP 6.0 conditions. Different letters indicate significant differences according to Games-Howell tests (p < 0.05).
PIabs, DFabs, and SFIabs are used as vitality indexes of the photosynthetic apparatus for various environmental sources of stress and are well known as sensitive indicators of environmental stress (Strasser et al., 2000; Boureima et al., 2012; Wang et al., 2012; Lee et al., 2022). PIabs implies energy conservation efficiency in the process of absorbing light energy, i.e., energy absorption, excitation energy capture, and electron transfer between electron transport chains. DFabs signifies the driving force of photosynthesis and SFIabs denotes the molecular structure and function of the photosynthetic apparatus (Dudeja and Chaudhary, 2005; Demetriou et al., 2007).
For jujube, substantial reductions were observed in all groups except Control-WW. Hence, stressors due to climate change conditions and drought reduced the energy conservation efficiency and the functions of the photosynthetic apparatus. Notably, RCP 6.0-DS had the lowest PIabs, DFabs, and SFIabs values, indicating that the vitality of the photosynthetic apparatus is weakened when drought stress is accompanied by climate change.
Growth Characteristics and Water Saturation Deficits (WSD)
The RCP 6.0 groups had significantly higher height and root collar values (p < 0.05) than the Control-groups; these results are thought to be related to the carbon fertilization effect (Fig. 6). The water saturation deficit showed no significant variation under the RCP 6.0 treatments but showed a considerable increase when drought treatments were included. Above all, RCP 6.0-DS demonstrated an outcome of 41.91 ± 8.9%, which was approximately 11 times greater than that of Control-WW (Fig. 6).
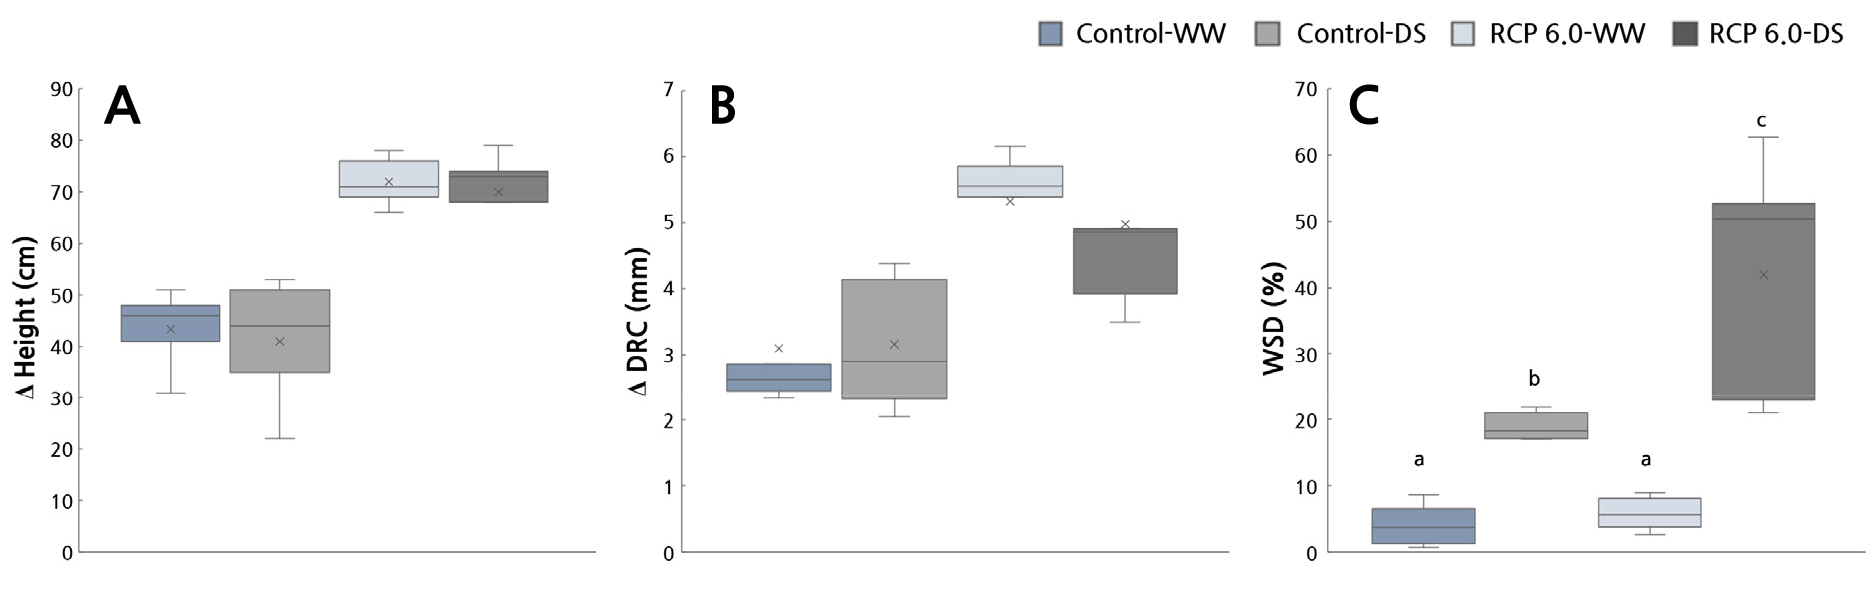
In general, plant growth increases as the temperature and CO2 concentration increase (Callaway et al., 1994; Han et al., 2011; Lee et al., 2013). Furthermore, in the case of jujube, over 35% of the total DW increased in RCP-WW compared to Control-WW, and a sharp increase was observed in the DW of the above-ground part of the plant (Table 3).
Table 3.
Effects of drought stress on the growth characteristics of Z. jujube under control and RCP 6.0 conditions
| Treatment | Dry mass production (g) |
T/R rate (g·g-1) |
LWRz (g·g-1) |
RWRy (g·g-1) | |||
| Leaves | Stem | Root | Total | ||||
| Control-WW | 29.2 abx | 46.9 a | 67.0 ns | 143.1 ab | 1.3 ns | 0.21 ns | 0.45 ns |
| Control-DS | 24.5 a | 38.5 a | 54.3 | 117.3 a | 1.3 | 0.21 | 0.46 |
| RCP 6.0-WW | 39.6 b | 92.5 b | 61.2 | 193.3 b | 2.3 | 0.20 | 0.31 |
| RCP 6.0-DS | 27.6 ab | 78.7 b | 57.0 | 163.3 ab | 1.9 | 0.17 | 0.35 |
With regard to L. tulipifera, higher CO2 concentrations and temperatures were shown to increase rootlet development (Lee et al., 2013), and only the outcomes of rootlets were included when analyzing the water absorption function of the roots. With jujube, the root DW varied considerably and thus had no significance. Furthermore, the T/R, leaf weight, and root weight ratios showed no significant differences (p > 0.05). Moreover, after 12 days of drought stress, there was a mild decrease of 16.1% between the Control groups. Conversely, approximately 30.3% of the leaves were decreased in RCP 6.0-DS than in RCP 6.0-WW, indicating that the assimilatory organ suffered significant damage.
On the whole, climate change conditions promoted the overall growth of jujube, particularly in the above-ground parts of the plants (Fig. 7F and 7G). However, an increase in the above-ground growth also demonstrates an increase in water consumption when drought stress is accompanied by climate change. Thus, physiological harm may occur simultaneously.

Conclusion
In jujube, a high Ci level increased A under climate change conditions (atmospheric CO2 650 ppm, temperature Control + 3°C), and overall growth indices such as the total DW and DW of leaves and stems increased. Lowering stomatal conductivity improved water use efficiency, implying that the water-conserving response of these plants is related to stomatal restriction. Additionally, when accompanied by drought stress, plants under the Control-DS condition appear to adapt to the drought through stomatal limitations, regulating their photosynthesis rate and water use efficiency. RCP 6.0-DS also demonstrated an adaptive response by conserving water in the system and buffering the photosynthetic apparatus to mitigate the harm caused by the excitation energy generated by the stomatal closure and increased heat dissipation. However, the electron donor was also restricted as the electron acceptor reduction state of PS I increased in RCP 6.0-DS. These states result from decreases in chlorophyll a, b, the total chlorophyll content, gm, active PS II reaction centers, and the deactivation of the OEC. The energy conservation efficiency, photosynthetic driving force, and photosynthetic ability (Vcmax and Jmax) of PS II decreased due to non-stomatal limitations. Owing to the relatively rapid increase in the amount of biomass, the depletion of soil water contents accelerated, implying that the growth and physiological damage may have been severe. In particular, in the case where the RCP 6.0 scenario implies that the greenhouse reduction policy has been actualized to some extent, along with national efforts to reduce greenhouse gas emissions, the sensitivity (or vulnerability) of plant growth to climate change circumstances should also be determined. Therefore, active efforts with regard to plant management, such as appropriate watering methods and soil supplementation, should be provided and verified concurrently. Based on the physiological data gained from this experiment, it is believed that in the future, a comparative analysis of changes in important production characteristics, such as fruit quality levels and quantities, as well as pharmacological effects such as those of anticancer agents and antioxidants, can be conducted.
