

Introduction
Materials and Methods
Plant Materials
DNA Extraction and Primer Screening
Genetic Diversity Analysis and DNA Fingerprint Construction
Results
Core Primer Screening
Clustering Analysis
Construction of DNA Fingerprinting
Fingerprinting QR Code
Discussion
Conclusion
Introduction
Peony (Paeonia Sect. Moutan) is a globally known flowering plant native to China with high ornamental, medicinal, and oil value, in addition to its cultural symbolism (Zhai et al., 2018). There are seven geographical groups of tree peony distributed around the world, and the ornamental tree peony grown in Hunan province of China belongs to the Paeonia suffruticosa Jiangnan group (Wang, 2009a). There were two cultivation centers of tree peony during the Ming and Qing dynasties, when ornamental tree peony (P. suffruticosa) was grown in northern Xiangxi, and medicinal tree peony (P. ostii) was grown in southern Xiangxi (Hou et al., 2009). Since 2014, our research group has collected Hunan tree peony resources showing excellent characteristics of moisture and heat resistance from Shaoyang and Xiangxi for genetic diversity research and hybrid breeding (Wu et al., 2017; Xu et al., 2020). However, there are many unresolved issues, such as potentially synonymous names and unknown sources of these resources because of their long cultivation history and complex genetic background and the discovery of new mutant strains. Researchers usually distinguish and name different varieties according to their phenotypic characteristics and site of introduction. However, morphological data are greatly influenced by environmental factors and do not reflect all of the genetic diversity inherent in a species (Vassou et al., 2015). To protect and utilize tree peony resources in Hunan Province, China, and reveal genetic differences at the molecular level, it is necessary to conduct genetic diversity analyses and DNA fingerprint construction.
Because simple sequence repeat (SSR) markers have extensive distribution, high polymorphism and mutation rates, good reproducibility, codominance, and the absence of environmental restrictions (Powell et al., 1996; Keyser et al., 2010), they have been widely used for cultivar identification, genetic map construction, and molecular marker-assisted selection in many horticultural plants, such as peach (Rojas et al., 2008) and mango (Wahdan et al., 2011). Following the development of fluorescence-based sequencing technology, Schuelke (2000) reported a high-throughput, low-cost SSR product detection system referred to as simple sequence repeat with tailed primer M13 (TP-M13-SSR) technology. This technique solves many problems, such as low analytical flux, cumbersome amplification product detection processes, excessive data recording, and low resolution (Hao et al., 2020), and has been widely used in wheat (Liu et al., 2020), apple (Gao et al., 2016), and other plants.
The local tree peony variety resources in Hunan are indispensable materials for breeding and for studying the mechanisms underlying moisture and heat resistance (Zhang et al., 2019). In this study, TP-M13-SSR technology was used to select primers with high polymorphism from a set of developed SSR primers for DNA fingerprint construction and genetic diversity analysis in Hunan tree peony resources. The differences and genetic diversity among local tree peony variety resources in Hunan were revealed at the molecular level. This work provides a reference for the collection and classification of tree peony resources in the future.
Materials and Methods
Plant Materials
Since 2014, our group has collected tree peony resources from Shaoyang City and Xiangxi Autonomous Prefecture in Hunan Province and introduced them to the flower collection of Hunan Agricultural University. Although medicinal tree peony does not belong to the P. suffruticosa Jiangnan group, it has been cultivated for a long time in Shaoyang, Hunan Province, so it was also included in the study. Through grafting, sowing, and other breeding methods, more than five strains of each germplasm have been generated. Plants with robust growth and stable characteristics were selected, and their harvested petioles were stored frozen at-80°C after quick freezing in liquid nitrogen. Information on the germplasm resource is provided in Fig. 1.
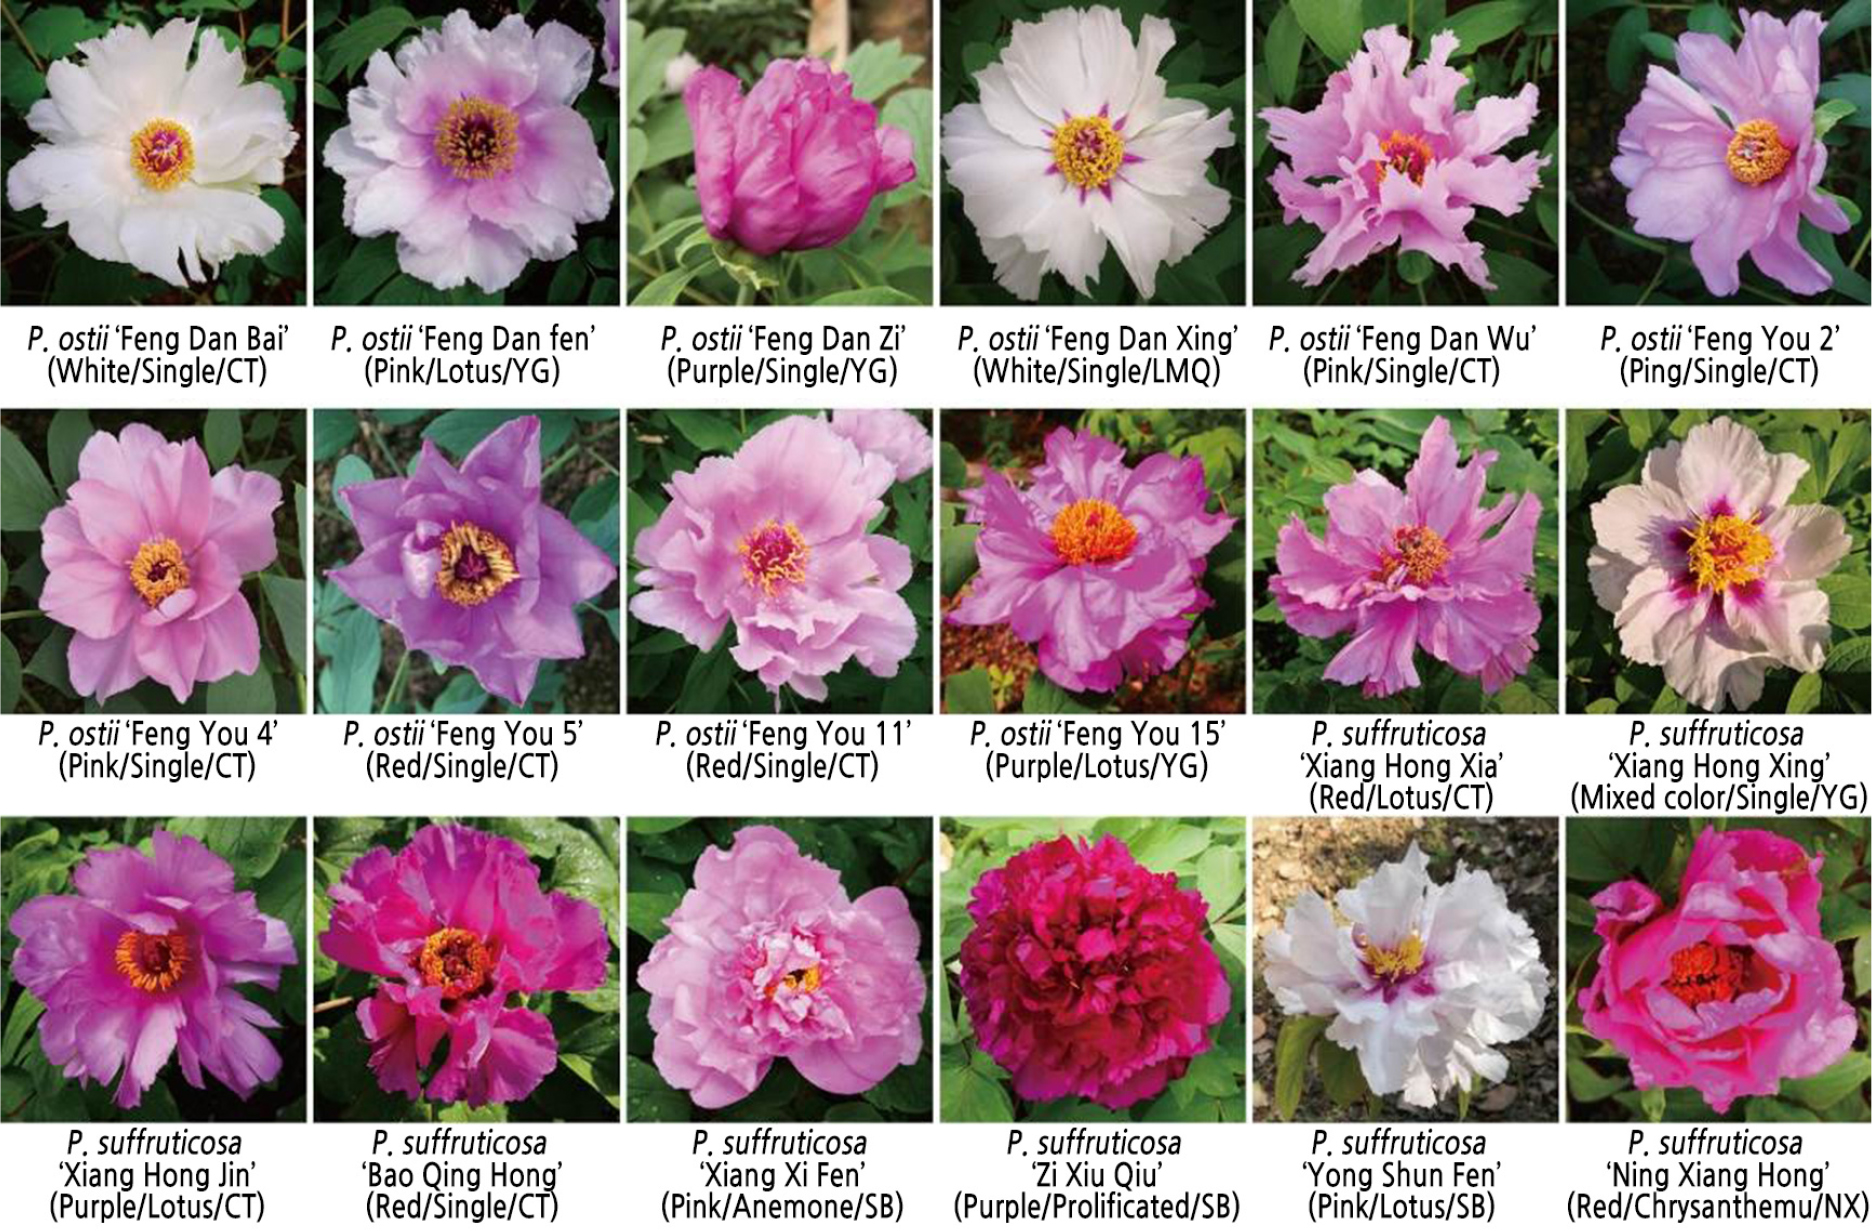
Fig. 1.
Eighteen samples of peony resources. The flower type, and provenance of the sample are shown in parentheses. CT representatives were introduced from Caitian Village, Li Jiaping Town, Shaoyang County, Hunan Province, China. YG representatives were introduced from Yanggu Village, Wufengpu Town, Shaoyang County, Hunan Province, China. LMQ representatives were introduced from Li Muqiao Village, Li Jiaping Town, Shaoyang County, Hunan Province, China. SB representatives were introduced from Songbai Town, Yongshun County, Hunan Province, China. NX representatives were introduced from Ningxiang County, Changsha City, Hunan Province, China.
DNA Extraction and Primer Screening
Genomic DNA was extracted from petioles (0.1 g from each accession) using the modified CTAB method (Allen et al., 2006). The concentration and purity of the DNA were evaluated on agarose gels (1.0%) and with a DeNovix DS-11 spectrophotometer (DeNovix, USA).
We selected 131 pairs of tree peony SSR primers that were developed previously as candidate primers (Wang et al., 2009b; Homolka et al., 2010; Hou et al., 2011; Zhang et al., 2011; Yu et al., 2013; Wu et al., 2014; Li, 2019). These primers (PAGE purification) were synthesized by Sangon Biotech (Shanghai) Co., Ltd. Fluorescent primers containing M13 connectors were synthesized by Ruibiotech (Beijing) Co., Ltd.
First, 131 pairs of alternative SSR primers were preliminarily screened using genomic DNA from 9 Hunan tree peony varieties as the template. PCR was conducted in 10 µL of a solution containing 5 µL of 2× Taq PCR MasterMix (KT201; TIANGEN, Beijing, China), 1 µL of DNA template (20 ng·µL-1), 0.5 µL of each forward and reverse SSR primer, and 3 µL of ddH2O in a thermocycling system. The PCR conditions were as follows: predenaturing at 94°C for 3 min; 30 cycles of denaturing at 94°C for 30 s, annealing for 30 s, and extension at 72°C for 1 min; extension at 72°C for 5 min; and 4°C ∞. Finally, the products were examined on a 2% agarose gel. The DL500 DNA marker (Cat. No. B600305 Sangon Biotech Co., Shanghai, China.) was used to determine the sizes of the PCR products.
The primer information obtained from primary screening was then used to design fluorescently labeled M13 primers, which were synthesized by Ruibiotech (Beijing) Co., Ltd. TP-M13-SSR PCR was subsequently performed using the genomic DNA samples from the 18 tree peony resources as templates. The first round of PCR amplification was performed in a 10-µL reaction volume containing 1 µL of template DNA concentrate, 5 µL of 2× Taq plus PCR MasterMix (Ruibio RB-PCRA01), 0.1 µL (10 µM) of each primer, and 3.8 µL of ddH2O. The thermocycling conditions were as follows: initial denaturation at 95°C for 5 min; 20 cycles of 30 s at 95°C, annealing for 30 s, and 30 s at 72°C; a final extension at 72°C for 10 min; and holding at 4°C. The second round of PCR amplification was performed in a 20-µL reaction volume containing 2 µL of the product of the first reaction, 10 µL of 2× Taq plus PCR MasterMix (Ruibio RB-PCRA01), 0.15 µL (10 µM) of each primer, and 7.7 µL of ddH2O. The thermocycling conditions were as follows: initial denaturation at 95°C for 5 min; 35 cycles of 30 s at 95°C, annealing for 30 s and 30 s at 72°C; a final extension at 72°C for 10 min; and holding at 4°C. Then, 0.3 µL of the PCR product was mixed with 0.5 µL of the GS-500LIZ (ABI 4322682) (Applied Biosystems, USA) internal molecular weight standard and 9.5 µL of deionized formamide (ABI 4311320), followed by denaturation at 95°C for 5 min and chilling on ice immediately thereafter. The alleles of each locus were visualized on an ABI 3730XL capillary DNA sequencer (Applied Biosystems, USA).
Genetic Diversity Analysis and DNA Fingerprint Construction
Primers were preliminarily screened by PCR. The products were separated by 2% agarose gel electrophoresis, and a gel imager (Gel DocTMXR+) was used to record images. Then, the running lanes and bands were analyzed manually with Image Lab software. The primers were preliminarily screened according to whether clear bands were amplified near the expected target fragment size.
The fluorescent PCR amplification products were detected by capillary electrophoresis on an ABI-3730XL gene analyzer (Applied Biosystems, USA). The original files were imported into GeneMarker 2.2.0 software for analysis, and the peak map and Excel site information table were created. The results were converted into the format required by Popgene1.32 software to analyze genetic parameters such as the observed number of alleles (Na), the effective number of alleles (Ne), and Shannon's information index (I) (Francis et al., 1999). The polymorphism information contents (PICs) of the accessions were quantified using PIC_CALC v.0.6 software (Nagy et al., 2012). NTSYS-pc2.10e software was used to calculate the similarity coefficient, and the unweighted pair-group method with arithmetic mean (UPGMA) was used for cluster analysis to construct a phylogenetic tree (Nei, 1973).
DNA fingerprinting code construction was conducted according to Ma's (2012) method with slight modification as follows: according to primer polymorphism in a high to low fixed arrangement, prefixed by the selected SSR primer GenBank accession number, suffixed by the molecular weight of the amplified band from a sample to obtain the band size of each germplasm resource for a certain marker, and SSR fingerprint of the germplasm resource obtained by serially numbering each type. Then, quick response (QR) code-generating software (https://cli.im/img) was used to encode the name, color, pattern, and fingerprinting code of each resource to generate the fingerprinting QR code.
Results
Core Primer Screening
Eighteen Hunan tree peony germplasm samples were subjected to PCR amplification, and the products were detected by 2% agarose gel electrophoresis. According to whether a single clear band was amplified near the expected target fragment size, 67 pairs of primers with good amplification effects were selected from 131 pairs of alternative SSR primers. Some primer agarose gel electrophoresis results are provided in Suppl. Fig. 1s. The 67 pairs of primers were labeled with fluorescent dyes containing M13 connectors, and TP-M13-SSR PCR was performed. The amplification products were detected by capillary electrophoresis on an ABI-3730XL gene analyzer. A total of 24 pairs (Table 1) of polymorphic primers with good amplification results were selected on the basis of the amplification results for the 18 tree peony resources accounting for 18.32% of the candidate primers. Part of the primer capillary electrophoresis results are provided in supplement Fig. 2.
Table 1.
The 24 pairs of core primers in this study
| Primer | Sequencez | Ta (°C)y | Size (bp) | Repeat | GenBank |
| PSD4 | F:GGGTAGTGTAGAAGTTGAAGC | 54.8 | 110 | (AAG)4 | HM852903 |
| R:CGTGCTCGTCTCGTAAAT | |||||
| 3AGAG9896 | F:GGAATGGCGGCAACT | 66 | 200 | (AAAGAG)3 | FE529896 |
| R:TGGCAATACTACTGGACAGG | |||||
| PAG22 | F:TGGGAGTAAGTCCCCCTCTCTC | 55 | 243 | (TC)3(TC)6(TC)4 | EU678300 |
| R:GTCTTTTTTTCTCCCCTAAGC | |||||
| PS095 | F:TCCCAAGACCTCAAACAAC | 55 | 394 | (CCA)5 | GBGY01000096 |
| R:CCATCAATACGAGCCAAC | |||||
| PS047 | F:AGACGACGAGCAAAGATAT | 54 | 126 | (TC)8 | GBGY01000047 |
| R:AAAGGGCAAGATTGGAAAT | |||||
| PS308 | F:ACTACTCTATTGCGAAACC | 53 | 189 | (TC)7 | GBGY01000308 |
| R:GTCTTATGGCGGCTATGT | |||||
| AT8051 | F:GGTATCAATCCGTGTGC | 50 | 190 | (AT)5 | FE528051 |
| R:GCGAAAATTTAGATGAGTGT | |||||
| PS309 | F:AAGCAAAGCCGTGGAGAT | 55 | 257 | (CT)6 | GBGY01000309 |
| R:GTGCGTGAAAAGGAGACAGAAC | |||||
| SSR17 | F:GCAAAGACAACAGCCTCG | 57.2 | 289 | (CAG)6 | GBGY01000120 |
| R:CTCACCATCCAATCCCAC | |||||
| PS273 | F:CCCTCAGATGGGATGGAA | 58.5 | 314 | (GCCGCT)4 | GBGY01000274 |
| R:CGGTGGTGGTACAACGAAC | |||||
| PS112 | F:TCCAAATACACGCTCGTT | 54 | 320 | (ACC)5 | GBGY01000113 |
| R:CCTCGCTTCCTCTTTACAT | |||||
| PS166 | F:TTCAGTGGGCAAGACCTAC | 55 | 337 | (AT)7 | GBGY01000168 |
| R:TAGCCAATACAGAACAAACC | |||||
| PSC8 | F:TCCCATCTTCCGAAATCC | 52 | 358 | (TCA)3 | JQ771471 |
| R:ACGGCGACATCATCAACT | |||||
| PS068 | F:CTTTGGCATTCTCATTCA | 52.5 | 174 | (TC)7 | GBGY01000068 |
| R:GGTGGTATTGGGCTTCTT | |||||
| P09 | F:GCCACAAGAAAACAAAAACC | 54 | 267 | (CT)17 | FJ024291 |
| R:CCTTCACCACTACTTCCCCAT | |||||
| Pdel29 | F:CTGCCATTTCTTGCCTTCTTTGT | 55 | 253–308 | (TGG)6 | - |
| R:TCTACCCTGCCAACAGCACATAC | |||||
| P12 | F:TTGGTTGGTGAAGGTGTT | 50 | 324 | (TC)9TTTCTCTCTA(TC)5 | FJ024294 |
| R:CTTCGATAACCGCAGGAGGAT | |||||
| PS271 | F:AGAATCCACCTCCTGTCAC | 56.5 | 406 | (GGAGAA)3 | GBGY01000272 |
| R:AACCCTGCCCTAAACTAAAC | |||||
| Seq6 | F:GACCGATTTGACCCTCTA | 52.5 | 219 | (GA)11 | JX855800 |
| R:CTCCCATGTGATGTTGTG | |||||
| PS144 | F:CAACCTACAATCCGACAATG | 54.5 | 317 | (TGC)5 | GBGY01000147 |
| R:CGACTTCCCTTCAATACA | |||||
| P05 | F:TCGCCCAACCTGTCGTGGAGAT | 50 | 286 | (AG)9 | FJ024287 |
| R:TTGAATAGAGCGGAATGGAAAA | |||||
| PCA1 | F:TAGTCAGTCGTAGCTAGCATAGGCA | 60 | 142 | (GT)20 | EU678305 |
| R:GATGGCCACCTATAGAAAAGAATCA | |||||
| P9 | F:GGGGACTCAAATCCTTGCGAAAACCA | 59.3 | 189 | (CAC)4 | - |
| R:AGGCCTAGTTTTGGTCTGGGCG | |||||
| AG8073 | F:TCAGCTAATATGGGTGTTTC | 50 | 226 | (AG)10 | FE528073 |
| R:ATCAAAGTGGAAGTTCTACAGT |
The 24 pairs of primers revealed 101 alleles (Na) in the 18 tree peony resources. The variation in each pair of primers ranged from 2 to 9, with an average of 4.0800. The effective number of alleles (Ne) ranged from 1.3114 to 6.4800, with an average of 2.4320. The I values ranged from 0.4029 to 2.0064, with a mean of 0.9576. The PICs ranged from 0.2106 (PSD4, AT8051) to 0.8278 (PCA1), with an average of 0.4788. The distinction rate ranged from 11.11% to 66.67%, with an average of 31.71%. Among these measures, the I values, PICs, and differentiation rates of eight pairs of primers were higher than the average values as follows: PS166, AG8073, PS271, P05, Seq6, PS144, P9, and PCA1 (Table 2). These results indicated that these 24 pairs of primers could be used as a polymorphic SSR primer library for genetic diversity analysis of tree peony resources, DNA fingerprinting, and other related studies.
Table 2.
Polymorphism and genetic diversity of the 24 pairs of SSR primers in 18 tree peony resources
| Primer name | Sample Size | Naz | Ney | Ix | PICw | Distinction rate |
| PSD4 | 36 | 2.0000 | 1.3144 | 0.4029 | 0.2106 | 11.11% |
| AT8051 | 36 | 2.0000 | 1.3144 | 0.4029 | 0.2106 | 11.11% |
| PSC8 | 36 | 4.0000 | 1.3333 | 0.5349 | 0.2374 | 22.22% |
| PS308 | 36 | 3.0000 | 1.4087 | 0.5566 | 0.2687 | 16.67% |
| SSR17 | 36 | 3.0000 | 1.5882 | 0.6837 | 0.3402 | 16.67% |
| PS095 | 36 | 2.0000 | 1.9459 | 0.6792 | 0.3680 | 16.67% |
| PS068 | 36 | 3.0000 | 1.7419 | 0.7298 | 0.3709 | 16.67% |
| PS047 | 36 | 3.0000 | 1.7657 | 0.7605 | 0.3864 | 22.22% |
| PS112 | 36 | 3.0000 | 1.7802 | 0.7778 | 0.3957 | 27.78% |
| 3AGAG9896 | 36 | 3.0000 | 2.0703 | 0.7909 | 0.4090 | 27.78% |
| Pdel29 | 36 | 4.0000 | 1.8947 | 0.8783 | 0.4278 | 27.78% |
| PAG22 | 36 | 3.0000 | 2.1600 | 0.8544 | 0.4409 | 27.78% |
| PS273 | 36 | 5.0000 | 1.9577 | 1.0016 | 0.4612 | 33.33% |
| P12 | 36 | 4.0000 | 2.3394 | 0.9715 | 0.4824 | 16.67% |
| P09 | 36 | 3.0000 | 2.4545 | 0.9650 | 0.5049 | 22.22% |
| PS166 | 36 | 4.0000 | 2.7574 | 1.1269 | 0.5747 | 38.89% |
| AG8073 | 36 | 8.0000 | 2.5116 | 1.3959 | 0.5831 | 50.00% |
| PS309 | 30 | 3.0000 | 2.9801 | 1.0953 | 0.5904 | 22.22% |
| PS271 | 36 | 6.0000 | 3.3750 | 1.4118 | 0.6597 | 55.56% |
| P05 | 36 | 8.0000 | 3.8118 | 1.6503 | 0.7096 | 66.67% |
| Seq6 | 34 | 5.0000 | 3.6815 | 1.4196 | 0.6821 | 44.44% |
| PS144 | 36 | 5.0000 | 3.7029 | 1.4185 | 0.6833 | 50.00% |
| P9 | 34 | 6.0000 | 3.9862 | 1.5363 | 0.7118 | 55.56% |
| PCA1 | 36 | 9.0000 | 6.4800 | 2.0064 | 0.8278 | 61.11% |
| Mean | 36 | 4.0800 | 2.4320 | 0.9576 | 0.4788 | 31.71% |
| St. Dev | 2.0191 | 1.1864 | 0.4490 |
Clustering Analysis
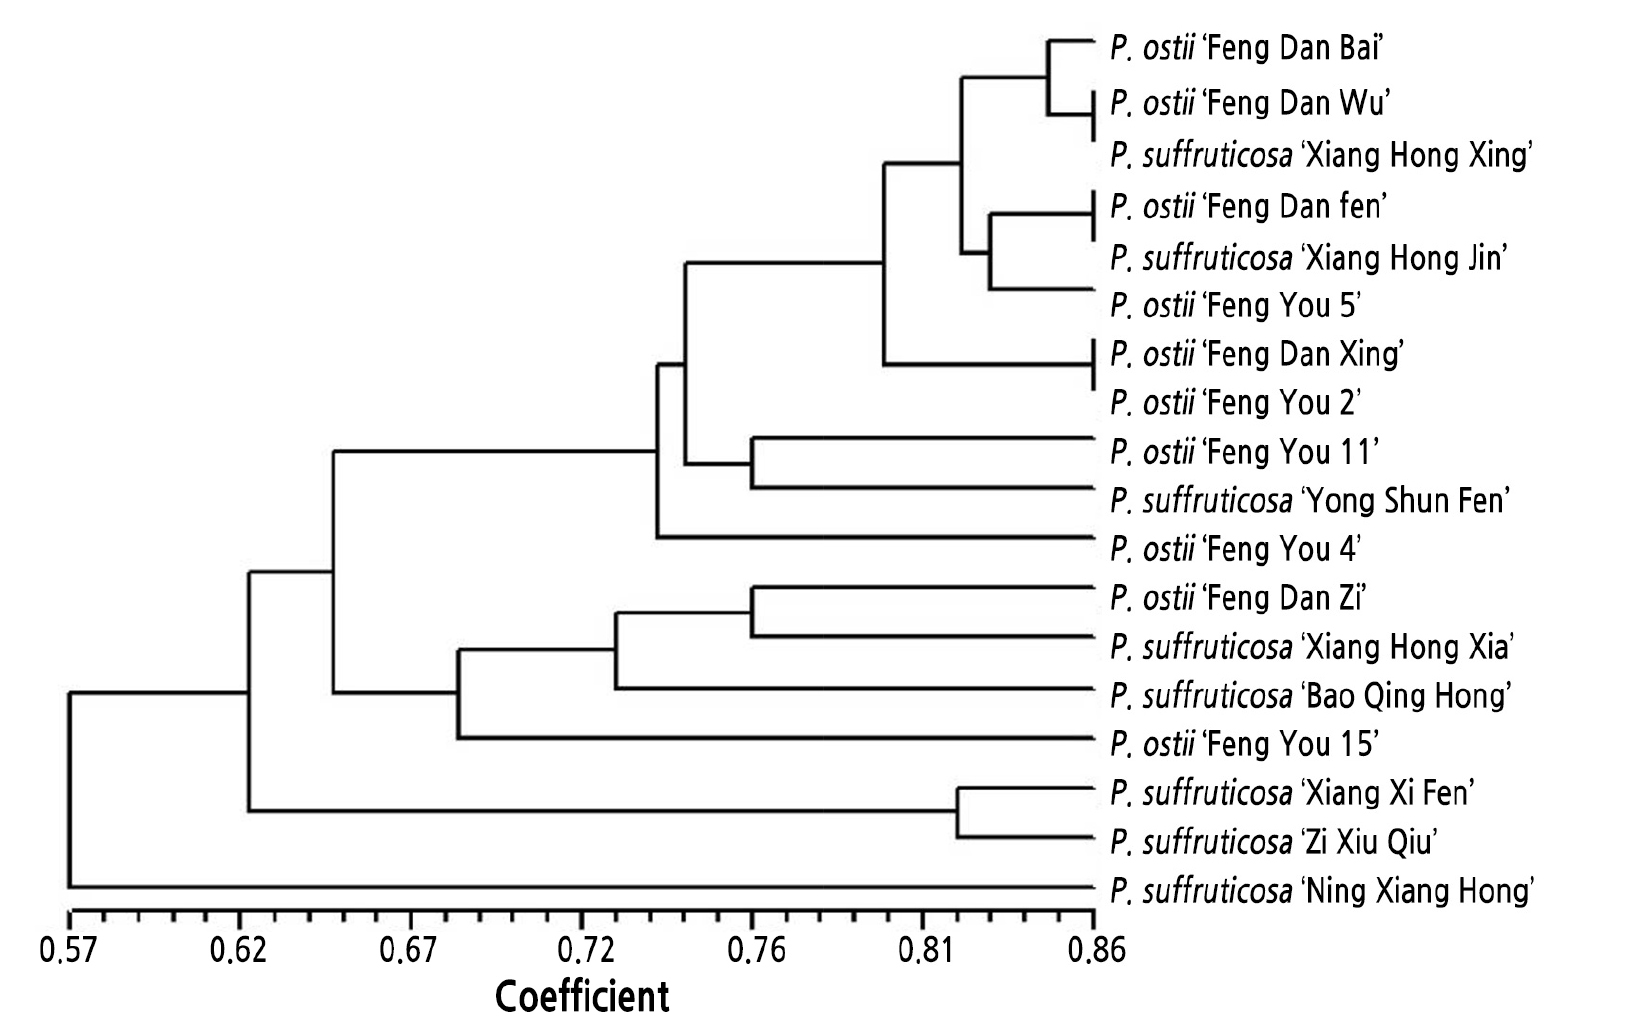
Data for 51 alleles obtained from the 18 accessions of Hunan tree peony resources by amplification with the 8 pairs of primers showing above average I, PIC, and discrimination rate values were used to establish the original matrix. (The eight pairs of primers are PS166, AG8073, PS271, P05, Seq6, PS144, P9, and PCA1.) The genetic similarity coefficient was calculated with NTSYSpc 2.20V software. The genetic similarity coefficients among the 18 tree peony resources ranged from 0.57 to 0.86. P. ostii ‘Feng Dan Wu’ and P. suffruticosa ‘Xiang Hong Xing’, P. ostii ‘Feng Dan Fen’ and P. suffruticosa ‘Xiang Hong Jin’, and P. ostii ‘Feng Dan Xing’ and P. ostii ‘Feng You 2’ showed the highest genetic similarity coefficients, indicating that they were closely related. The P. ostii ‘Feng Dan Xing’ and P. ostii ‘Feng You 2’ UPGMA clustering results showed that 18 tree peony resources could be divided into two groups according to a genetic similarity coefficient of 0.57. The first group included only P. suffruticosa ‘Ning Xiang Hong’, indicating that this species was distantly related to the other 17 tree peony resources tested. The second group could be divided into two subclasses at 0.62. The first subclass included only P. suffruticosa ‘Xiang Xi Fen’ and P. suffruticosa ‘Zi Xiu Qiu’, indicating that these species were distantly related to the 15 tree peony resources (Fig. 2).
Construction of DNA Fingerprinting
Among the 24 pairs of core primers, 8 pairs of primers with above average I, PIC, and differentiation rate values were selected. According to the PICs from high to low, they were PCA1, P9, PS144, Seq6, P05, PS271, AG8073, and PS166. Among these primers, PCA1 showed polymorphism and achieved a differentiation rate of 61.11%. The highest differentiation rate was observed for primer P05 (66.67%) and the lowest for PS166 (38.89%). Primers PCA1 and P05 amplified 9 and 8 valid allelic loci from the 18 tree peony resources, with PIC values of 0.8278 and 0.7096, respectively, showing high polymorphism and discrimination rates and the ability to distinguish the 18 tree peony resources (Table 2). The DNA fingerprinting codes of the 18 tree peony resources obtained via the previously explained methods are shown in Table 3. The original capillary electrophoresis photos of primers PCA1 and P05 corresponding to 18 tested materials are provided in Suppl. Fig. 2s.
Table 3.
DNA fingerprinting codes of local tree peony varieties in Hunan Province
| Code | Name/Color/Flower type | Fingerprinting codez |
| 1 | P. ostii ‘Feng Dan Bai’/White/Single | EU678305(136/138) FJ024287(302/320) |
| 2 | P. ostii ‘Feng Dan Fen’/Pink/Lotus | EU678305(156/156) FJ024287(302/310) |
| 3 | P. ostii ‘Feng Dan Zi’/Purple/Single | EU678305(162/162) FJ024287(304/314) |
| 4 | P. ostii ‘Feng Dan Xing’/White/Single | EU678305(156/156) FJ024287(302/302) |
| 5 | P. ostii ‘Feng Dan Wu’/Pink/Single | EU678305(158/158) FJ024287(302/302) |
| 6 | P. ostii ‘Feng You 2’/Pink/Single | EU678305(152/160) FJ024287(302/302) |
| 7 | P. ostii ‘Feng You 4’/Pink/Single | EU678305(152/160) FJ024287(302/304) |
| 8 | P. ostii ‘Feng You 5’/Red/Single | EU678305(158/166) FJ024287(302/302) |
| 9 | P. ostii ‘Feng You 11’/Red/Single | EU678305(136/166) FJ024287(302/312) |
| 10 | P. ostii ‘Feng You 15’/Purple/Lotus | EU678305(162/176) FJ024287(302/308) |
| 11 | P. suffruticosa ‘Xiang Hong Xia’/Red/Lotus | EU678305(158/158) FJ024287(310/314) |
| 12 | P. suffruticosa ‘Xiang Hong Xing’/Mixed color/Single | EU678305(162/162) FJ024287(302/310) |
| 13 | P. suffruticosa ‘Xiang Hong Jin’/Purple/Lotus | EU678305(162/162) FJ024287(302/304) |
| 14 | P. suffruticosa ‘Bao Qing Hong’/Red/Single | EU678305(138/176) FJ024287(308/314) |
| 15 | P. suffruticosa ‘Xiang Xi Fen’/Pink/Anemone | EU678305(136/136) FJ024287(304/314) |
| 16 | P. suffruticosa ‘Zi Xiu Qiu’/Purple/Prolificated | EU678305(136/162) FJ024287(314/314) |
| 17 | P. suffruticosa ‘Yong Shun Fen’/Pink/Lotus | EU678305(136/162) FJ024287(302/314) |
| 18 | P. suffruticosa ‘Ning Xiang Hong’/Red/Chrysanthemum | EU678305(156/156) FJ024287(320/322) |
Fingerprinting QR Code
The QR transcoding tool was used to convert the DNA fingerprinting codes of the 18 local tree peony varieties. The QR code contained information such as the name, color, pattern, and fingerprinting code of the germplasm resource (Fig. 3).

Discussion
From 131 pairs of SSR primers, 24 pairs of primers with good polymorphism were selected, among which 8 pairs of primers exhibited above average I, PIC, and discrimination rate values. These 8 pairs of primers were used to analyze the genetic diversity of 51 loci amplified from the 18 tree peony resources. UPGMA clustering results showed that P. suffruticosa ‘Ning Xiang Hong’, introduced in Ningxiang County, Hunan Province, was clustered into a separate group from the other tree peony varieties with a genetic similarity coefficient of 0.57, while the remaining 17 tree peony varieties, introduced in Shaoyang and Xiangxi, were clustered in a large group together. This indicates that the tree peony resources in Hunan show differences due to their different geographical distributions, which is consistent with the results of Zhang et al. (2016b). The second group, consisting of P. suffruticosa ‘Xiang Xi Fen’ and P. suffruticosa ‘Zi Xiu Qiu’, was divided into a subclass with a genetic similarity coefficient of 0.62; this group was not completely clustered with P. suffruticosa ‘Yong Shun Fen’ introduced in Xiangxi. This indicates that the tree peony resources in Hunan show relatively complex genetic relationships (Hong and Pan, 1999). Some P. ostii and P. suffruticosa varieties, such as P. ostii ‘Feng Dan Wu’ and P. suffruticosa ‘Xiang Hong Xing’, clustered into another group, this indicates that the existing ornamental peonies in Hunan are likely hybrid offspring of P. ostii, which is consistent with the results of Zhang et al. (2019). The mixed cluster of P. ostii and P. suffruticosa is due to their close genetic distance because they have many identical alleles. In the long-term introduction and cultivation, P. suffruticosa naturally hybridized with the original P. ostii resources in Hunan Province, resulting in excellent hybrid progenies such as P. suffruticosa ‘Xiang Hong Xing’, P. suffruticosa ‘Xiang Hong Jin’, and P. suffruticosa ‘Yong Shun Fen’.
In general, the construction of a DNA fingerprint is based on the principle that fewer primer combinations can achieve maximal identification ability (Zhang et al., 2016b). The PIC and discrimination rate of primers are important bases for the selection of primer combinations (Hao et al., 2020). Therefore, DNA fingerprints of the 18 tree peony resources from Hunan Province were constructed using the combination of primer PCA1, with the highest PIC value, and primer P05, with the highest discrimination rate. Resolved morphological data are greatly influenced by environmental factors and do not reflect the total genetic diversity inherent in a species (Vassou et al., 2015). Since the results obtained by using molecular markers are more realistic and stable, the application of modern molecular biology techniques based on such markers has been increasing (Fan et al., 2020).
In this study, the Na, Ne, I, and PIC values of PCA1, which was the best primer in terms of polymorphism, were all higher than those of P05, but the discrimination rate of PCA1 was inferior to that of P05, which was the third best primer in terms of polymorphism (Table 2). This situation occurred because P. ostii ‘Feng You 11’ showed unique allele 312 and P. suffruticosa ‘Ning Xiang Hong’ showed unique allele 322 amplified by P05, but no unique alleles were amplified by PCA1 in the 18 resources. The existence of specific alleles is of great significance for improving the efficiency of germplasm resource discrimination, and 15 (14.85%) unique alleles were found among the 101 alleles amplified by the 24 pairs of primers (Table 2). Six of the 83 (22.9%) alleles identified by Rakshit using 38 SSR markers were specific alleles (Rakshit et al., 2010). Li (2019) found that 53 tree peony materials exhibited specific alleles in a previous DNA fingerprinting study. Gao et al. (2009) found that five varieties presented specific alleles in a study of soybean molecular identity cards. Chen et al. (2011) identified 15 materials containing specific alleles in a peach DNA fingerprinting study.
The results of the primer polymorphism information analysis showed that the polymorphism of a given primer in different tree peony populations was slightly different. For example, the Na, Ne, I, and PIC values of primer Seq6 in the present and previous study populations were 5, 3.6815, 1.4196, and 0.6821 and 9, 4.7, 1.771, and 0.794, respectively. This primer was the most polymorphic among the 12 developed by Yu et al. (2013). These results indicated that the tree peony group shows abundant genetic diversity and that the developed primers show good polymorphism and some degree of variability in Paeonia Sect. Moutan (Zhang et al., 2016a).
According to the purpose of map construction and the size of the population, the coding method for DNA fingerprinting differs slightly, but there are three main methods applied at present (Ohtsubo and Nakamura, 2007; Chen et al., 2011; Kumar et al., 2020). Fingerprinting can be divided into three levels according to its practical value (Wang et al., 2017). In this study, the serial band encoding method was used to construct the atlas, which was an easy approach for retrieving the original fingerprinting data and reading the allelic information. This method directly issues test results and produces fingerprinting QR codes, and it may be applied to other information from germplasm resources, thus increasing the utility of fingerprinting and contributing to the effectiveness of germplasm resources (Hao et al., 2020).
Conclusion
Based on TP-M13-SSR technology, we selected eight pairs of primers with good polymorphism to analyze the genetic diversity of local tree peony varieties in Hunan Province and constructed DNA fingerprints for these resources, providing a research basis for the classification, identification, protection, and utilization of tree peony resources. Compared with other tree peony varieties, local tree peony varieties in Hunan Province are more resistant to dampness and heat. Whether these eight primer-amplified specific sites share this quality needs to be further studied by adding other representative research samples.
Supplementary Material
Supplementary materials are available at Horticultural Science and Technology website (https://www.hst-j.org).
- HORT_20210061_Figure_1s.pdf
Agarose gel electrophoresis results. M means maker. Numbers 1–9 correspond to the samples numbered 1–9 in Tab. 3. (A) Primers in which the bands were amplified near the expected target fragment. (B) Primers in which the bands were amplified near the expected target fragment and with hetero bands. (C) Primers in which no bands were amplified near the expected target fragment.
- HORT_20210061_Figure_2s.pdf
The capillary electrophoresis photos and fingerprint codes of primers PCA1 and P05 corresponding to 18 tested materials. (A) P. ostii ‘Feng Dan Bai’. (B) P. ostii ‘Feng Dan Fen’. (C) P. ostii ‘Feng Dan Zi’. (D) P. ostii ‘Feng Dan Xing’. (E) P. ostii ‘Feng Dan Wu’. (F) P. ostii ‘Feng You 2’. (G) P. ostii ‘Feng You 4’. (H) P. ostii ‘Feng You 5’. (I) P. ostii ‘Feng You 11’. (J) P. ostii ‘Feng You 15’. (K) P. suffruticosa ‘Xiang Hong Xia’. (L) P. suffruticosa ‘Xiang Hong Xing’. (M) P. suffruticosa ‘Xiang Hong Jin’. (N) P. suffruticosa ‘Bao Qing Hong’. (O) P. suffruticosa ‘Xiang Xi Fen’. (P) P. suffruticosa ‘Zi Xiu Qiu’. (Q) P. suffruticosa ‘Yong Shun Fen’. (R) P. suffruticosa ‘Ning Xiang Hong’.
