

Introduction
Materials and Methods
Cultivation of plant materials
Phenotypic identification and statistical analysis
RNA isolation and transcriptomic data analysis
Metabolite determination
Metabolite machine learning
Gene annotation
Results
Fruit morphology showed great differences in melon germplasm
RNA profile during fruit growth
IAA biosynthesis is associated with fruit elongation
Different metabolites of fruit with different morphologies during the growth period
The expression of CmTOR was correlated with melon fruit length
Cell division and elongation may directly cause changes in fruit length
Discussion
Conclusions
Introduction
Cucumis melo L (2x = 2n = 24), a prominent cultivated melon species within the Cucurbitaceae family (Garcia-Mas et al. 2012), is extensively grown globally and highly favored by consumers for its sweet taste and rich aroma. Beyond its palatability, melon is rich in vitamins and minerals, contributing significantly to human health. The diversity of melon varieties is extensive, with notable variations in fruit morphology, rind color, flesh color, sweetness, and aroma. Melon production holds substantial commercial value; notably, Spain’s average annual melon exports exceeded 400,000 tons between 2012 and 2022 (FAOSTAT). China, as the world’s leading producer of melons, has nonetheless seen its annual imports surpass 14 thousand tons in recent years (FAOSTAT). Therefore, global attention has also been drawn to the improvement of melon varieties. Over the past few decades, breeding research on melons has predominantly focused on the quantitative trait locus (QTL) mapping of desirable traits, yielding a series of significant research outcomes, particularly in the areas of fruit weight, fruit size, and disease resistance (Kesh and Kaushik 2021). In recent years, the publication of reference genome sequences has led to an abundance of genomic and metabolomic data, thereby opening up unprecedented opportunities for the improvement of melon varieties (Allwood et al. 2014; Li et al. 2023; Lyu et al. 2023; Liu et al. 2025).
The fruit, which develops from the carpel, represents the terminal phase of a plant’s life cycle. The morphology of the fruit is a critical factor influencing consumer choice and plays a significant role in the mechanized processing of fruits, thereby impacting the design and manufacture of machinery used at various stages of processing (Giwa and Akanbi 2020). The ultimate size of the fruit is determined by both the initial division of the carpel and subsequent cell expansion following fertilization (Gillaspy et al. 1993; Azzi et al. 2015). Mathematical modeling has been employed to analyze the growth patterns of Arabidopsis and rapeseed fruits across different developmental stages, revealing that ovary growth from proximal to distal regions undergoes deformation with spatial and temporal changes (Schindeler 2008), providing valuable insights into the determination of fruit shape. Over a century ago, researchers identified that in Lycopersicon species, the ovate locus and its alleles were associated with fruit shape (Price and Drinkard 1908; Ku et al. 1999), and the OVATE gene was eventually cloned in tomatoes in 2002 (Liu et al. 2002). Studies have demonstrated that fruit length is correlated with cell division. A histological analysis of the Slelf1 mutant, characterized by elongated tomato fruits, revealed an increased number of cell layers in the proximal region of immature fruits, indicating a significant correlation between ovary cell division and elongation and fruit length (Chusreeaeom et al. 2014). Another study showed that polyamines in obovoid tomatoes are negatively correlated with peel thickness and cell layer number compared to spherical fruits, offering additional evidence of the relationship between fruit length and cell division (Anwar et al. 2019). Fruit length is also influenced by hormone accumulation. In cucumbers, CsFUL1A reduces auxin accumulation in fruits by inhibiting the expression of intracellular auxin transporters PIN1 and PIN7, thereby negatively regulating fruit length (Zhao et al. 2019). Fruit length is affected not only by genetic factors but also by environmental and positional factors. In cucumbers, the shape of individual fruits is influenced by their position on the plant and the number of fruits per plant (Marcelis 1994). Investigating the variability in fruit shape within and between species can enhance the development of the fruit consumption and processing industries.
The shape of melon fruit is one of the most critical quality attributes, with parameters such as fruit length, diameter, contour, and weight used to assess this attribute. Research has demonstrated that melon fruit shape is a quantitative trait governed by multiple genes (Périn et al. 2002; Zhang et al. 2020a). To date, numerous loci influencing fruit morphology have been identified in melons. A high-density genetic map was constructed using a re-sequenced F2 population, leading to the identification of two loci associated with fruit size, one on chromosome 11 and the other on chromosome 5, through the integration of SNP markers. Based on sequence variation and gene function annotation analyses, an auxin response factor and a YABBY transcription factor were proposed as candidate genes for these loci (Lian et al. 2021). Amanullah et al. identified 26 QTLs related to fruit traits using SNP markers and a biparental F2 population, with OVL2.1, OVS1.1, FW2.1, FW9.1, FS4.1, and SW3.1 being recognized as major QTLs (Amanullah et al. 2021). Zhang et al. detected 40 QTLs for melon fruit quality using CAPS markers in an F2 population derived from a cross between melons M4-5 and M1-15. The majority of these QTLs were located on LG6 and LG9 (Zhang et al. 2020a). A genetic map of melon fruit traits was developed using PI 414723 (subspecies agrestis) and Dulce (subspecies melo), identifying a fruit length QTL on chromosomes 2 and 8 (Harel-Beja et al. 2010). Currently, a gene regulating fruit length has been cloned in melons, with CmOFP13 identified as a key regulator of fruit length via map-based cloning. Further research revealed that transposon insertion in the promoter region of CmOFP13 alters its expression level, ultimately resulting in variations in the fruit shape (Ma et al. 2022). However, global studies of melon fruit morphology predominantly focus on yield traits. Although several genes regulating fruit morphology have been cloned in melons, the underlying regulatory mechanisms remain elusive.
In this study, comprehensive transcriptomic and metabolomic analyses of the middle fruit pulp tissues from two distinct morphologies identified a substantial number of differentially expressed genes and metabolites. An enrichment analysis revealed that these differentially expressed genes (DEGS) are associated with hormone response and other biological processes, particularly in pathways such as plant hormone signal transduction, and the MAPK signaling pathway. Further investigation indicated significant upregulation of indole-3-acetic acid (IAA) biosynthesis genes in long-horn fruits T144, notably MELO3C035023, MELO3C013512, MELO3C002007, MELO3C013965, MELO3C010272, and MELO3C034758. These genes play a crucial role in fruit elongation and growth. Additionally, five metabolites—phosphatidylcholine, proline, 16-hydroxy-9-oxooctadeca-10,12,14-trienoic acid, corchorifatty acid, and myristic acid—were found to be associated with fruit elongation and growth. For the first time, we also discovered that the TOR signaling pathway in melons is involved in fruit development. Integrating transcriptomic and metabolomic data, our findings suggest that the elongation and growth of melon T144 fruit are achieved through both cell division and cell elongation in the flesh tissue. This study provides a robust theoretical and molecular foundation for the improvement of melon varieties.
Materials and Methods
Cultivation of plant materials
The melons T78 and T144 utilized in this study were sourced from the Anhui Provincial Watermelon and Melon Biological Breeding Engineering Research Center. These varieties were cultivated at the experimental base of the College of Life Sciences, Huaibei Normal University, located in Huaibei City, Anhui Province. Both T78 and T144 are stable homozygous lines characterized by consistent traits and comparable maturity periods. Each variety was planted in triplicate across distinct sections of the experimental field.
Phenotypic identification and statistical analysis
The length of the melon fruit was defined as the maximum distance between the two ends of the fruit, while the fruit diameter was measured at its widest point in the middle. For phenotypic identification across all periods, three biological replicates were established, with six fruits measured per replicate. The mean value of the six fruits was used as the replicate measurement, and the overall mean was calculated from the three replicates. Variance and significance analyses were conducted using these three biological replicates. In the ANOVA analysis, “41” indicated significance at p < 0.01, “*” indicated significance at p < 0.05, and “NS” denoted non-significance.
RNA isolation and transcriptomic data analysis
For the transcriptome analysis, pulp samples were collected at three weeks after pollination (3 WAP), a time point at which the rapid fruit elongation phase had already commenced. Three biological replicates were performed for each variety, with each replicate consisting of pulp tissue pooled from three individual fruits at 3WAP. First, 0.5 g of pulp tissue was weighed and immediately immersed in liquid nitrogen for flash freezing, with this state maintained for two minutes before the sample was crushed in a mortar. Total RNA extraction was performed using a Plant Total RNA Isolation Kit (Sangon Biotech, Shanghai, China). Subsequently, RNA sequencing was conducted on the NovaSeq 6000 platform at Shanghai Personal Biotechnology Co., Ltd. RNA sequencing generated an average of 48.6 million raw reads per sample, with Q30 scores exceeding 92.3% for all samples. The raw data underwent quality filtering to produce clean data. HISAT2 (http://ccb.jhu.edu/software/hisat2/index.shtml) was employed to align the filtered reads to the reference genome of Cucumis melo DHL92 V4 (http://cucurbitgenomics.org/v2/ftp/genome/melon/DHL92/v4.0/). The aligned reads were then assembled to reconstruct transcript sequences. Gene expression levels were quantified based on the alignment results. HTSeq was utilized to calculate the read count values as the initial expression levels of each gene. In this study, FPKM (fragments per kilobase of transcript per million mapped reads) was adopted for normalization. The FPKM-normalized expression levels are provided by default in the standard analysis pipeline. Genes with |log2 fold change| > 1 and adjusted Pvalue (FDR) < 0.05 were considered differentially expressed genes (DEGs). Genes with log2FC > 1 were classified as upregulated, while those with log2FC < ‒1 were classified as downregulated. A gene ontology (GO) enrichment analysis was conducted using the clusterProfiler package (version 4.0.0) in R. GO terms with adjusted P values < 0.05 were considered significantly enriched. A KEGG (Kyoto Encyclopedia of Genes and Genomes) pathway enrichment analysis was conducted using the same package, with reference to the melon genome annotation. The Benjamini–Hochberg method was applied for multiple testing correction, and pathways with adjusted p values < 0.05 were considered significantly enriched.
Metabolite determination
For the metabolomic analysis, three biological replicates were performed for each variety, with each replicate consisting of pulp tissue pooled from three individual fruits at 3 WAP. The pulp tissues of melon varieties T78 and T144 were ground into fine powder and analyzed using ultra-high performance liquid chromatography (UHPLC) coupled with tandem mass spectrometry (MS/MS). The response intensity and retention time of the chromatographic peaks of all detected ions were meticulously recorded. The raw data were converted into mzXML format using ProteoWizard software, with this followed by peak alignment, retention time correction, and peak area extraction using XCMS software. Subsequently, the metabolite structures were identified and data preprocessing was performed on the extracted data. A quality evaluation of the experimental data was conducted, followed by a comprehensive data analysis. Based on the positive and negative ion characteristics of the samples, an automatic matching process was employed to align with the established standard library. All metabolites identified in this study were classified and tallied according to their chemical taxonomy (Ribbenstedt et al. 2018).
Metabolite machine learning
For the metabolite machine learning analysis, the dataset consisted of the identified metabolites from all biological replicates of T78 and T144 (n = 6 samples, with three replicates per variety). The abundance values of 550 identified metabolites were used as features for model construction. The random forest algorithm was implemented using the ‘randomForest’ package in R (version 4.1.0) with 500 decision trees (ntree = 500) and the number of features sampled at each split set to the square root of the total number of features (mtry = ). The Bootstrap method was employed to randomly draw training samples from the original dataset, conducting K rounds of extraction to obtain K training sets. For feature selection, we utilized the Recursive Feature Elimination (RFE) algorithm with 10-fold cross-validation to identify the most informative metabolites. The importance of each metabolite was assessed by calculating the increase in the classification error rate when the feature was permuted (mean decrease in accuracy) (Hu and Szymczak 2023).
Gene annotation
In the present study, the melon gene annotation files were obtained from CuGenDBv2 (http://cucurbitgenomics.org/v2/ftp/genome/melon/DHL92/v4.0/). The IAA biosynthetic pathway and its associated synthases are based on previously published studies. Identification of the synthase genes involved in the melon IAA biosynthesis pathway was conducted according to two criteria: (1) the functional annotation must be consistent with the synthase genes reported previously in Arabidopsis thaliana and other plant species, and (2) these synthase genes must show homology with the corresponding genes in Arabidopsis thaliana through a BLASTP search (E value < 1e-10) and phylogenetic analysis. Specifically, using the protein sequences of known YUC, TAA/TAR, and AAO family members in Arabidopsis thaliana as query sequences, the search was conducted in the melon proteome. The candidate genes were further verified through a domain analysis using PFAM (https://pfam.xfam.org/) and SMART (http://smart.embl-heidelberg.de/) to confirm whether they contain conserved functional domains. Similarly, the selection of melon OFP gene family members adhered to two criteria: they must be homologous to ArabidopsisOFPs and their proteins must contain the OFP domain.
Results
Fruit morphology showed great differences in melon germplasm
Melon fruits exhibit considerable variation in the size, shape, color, and quality. In our study of melon germplasm, we identified two distinct fruit morphologies: T78, characterized by a flat-round shape, and T144, which exhibits a long-horn shape (Fig. 1A). The Fruit Morphological Index (FMI), defined as the ratio of fruit length to diameter, was used to quantify these differences. For T78, there was no significant change in FMI between three weeks after pollination (3WAP) and five weeks after pollination (5WAP). However, for T144, the FMI at 5WAP was significantly higher than that at 3WAP (Fig. 1B), indicating an increased elongation growth rate post-3WAP. Field measurements revealed that for T78, the average fruit diameter was 9.6 cm at 3WAP and 10.9 cm at 5WAP, while the average fruit length was 13.4 cm and 14.8 cm, respectively. Although there were significant differences in both the diameter and length between the two periods, the FMI remained unchanged (Fig. 1B and 1C). Conversely, for T144, the mean fruit diameter was 7.0 cm at 3WAP and 7.6 cm at 5WAP, with no significant difference in the FMI (Fig. 1B and 1D). However, the average fruit length increased from 20.5 cm at 3WAP to 37.0 cm at 5WAP, resulting in a significant difference in both the fruit length and FMI (Fig. 1B and 1D). These findings suggest that T144 primarily undergoes elongation growth after 3WAP, with a faster elongation growth rate compared to T78.
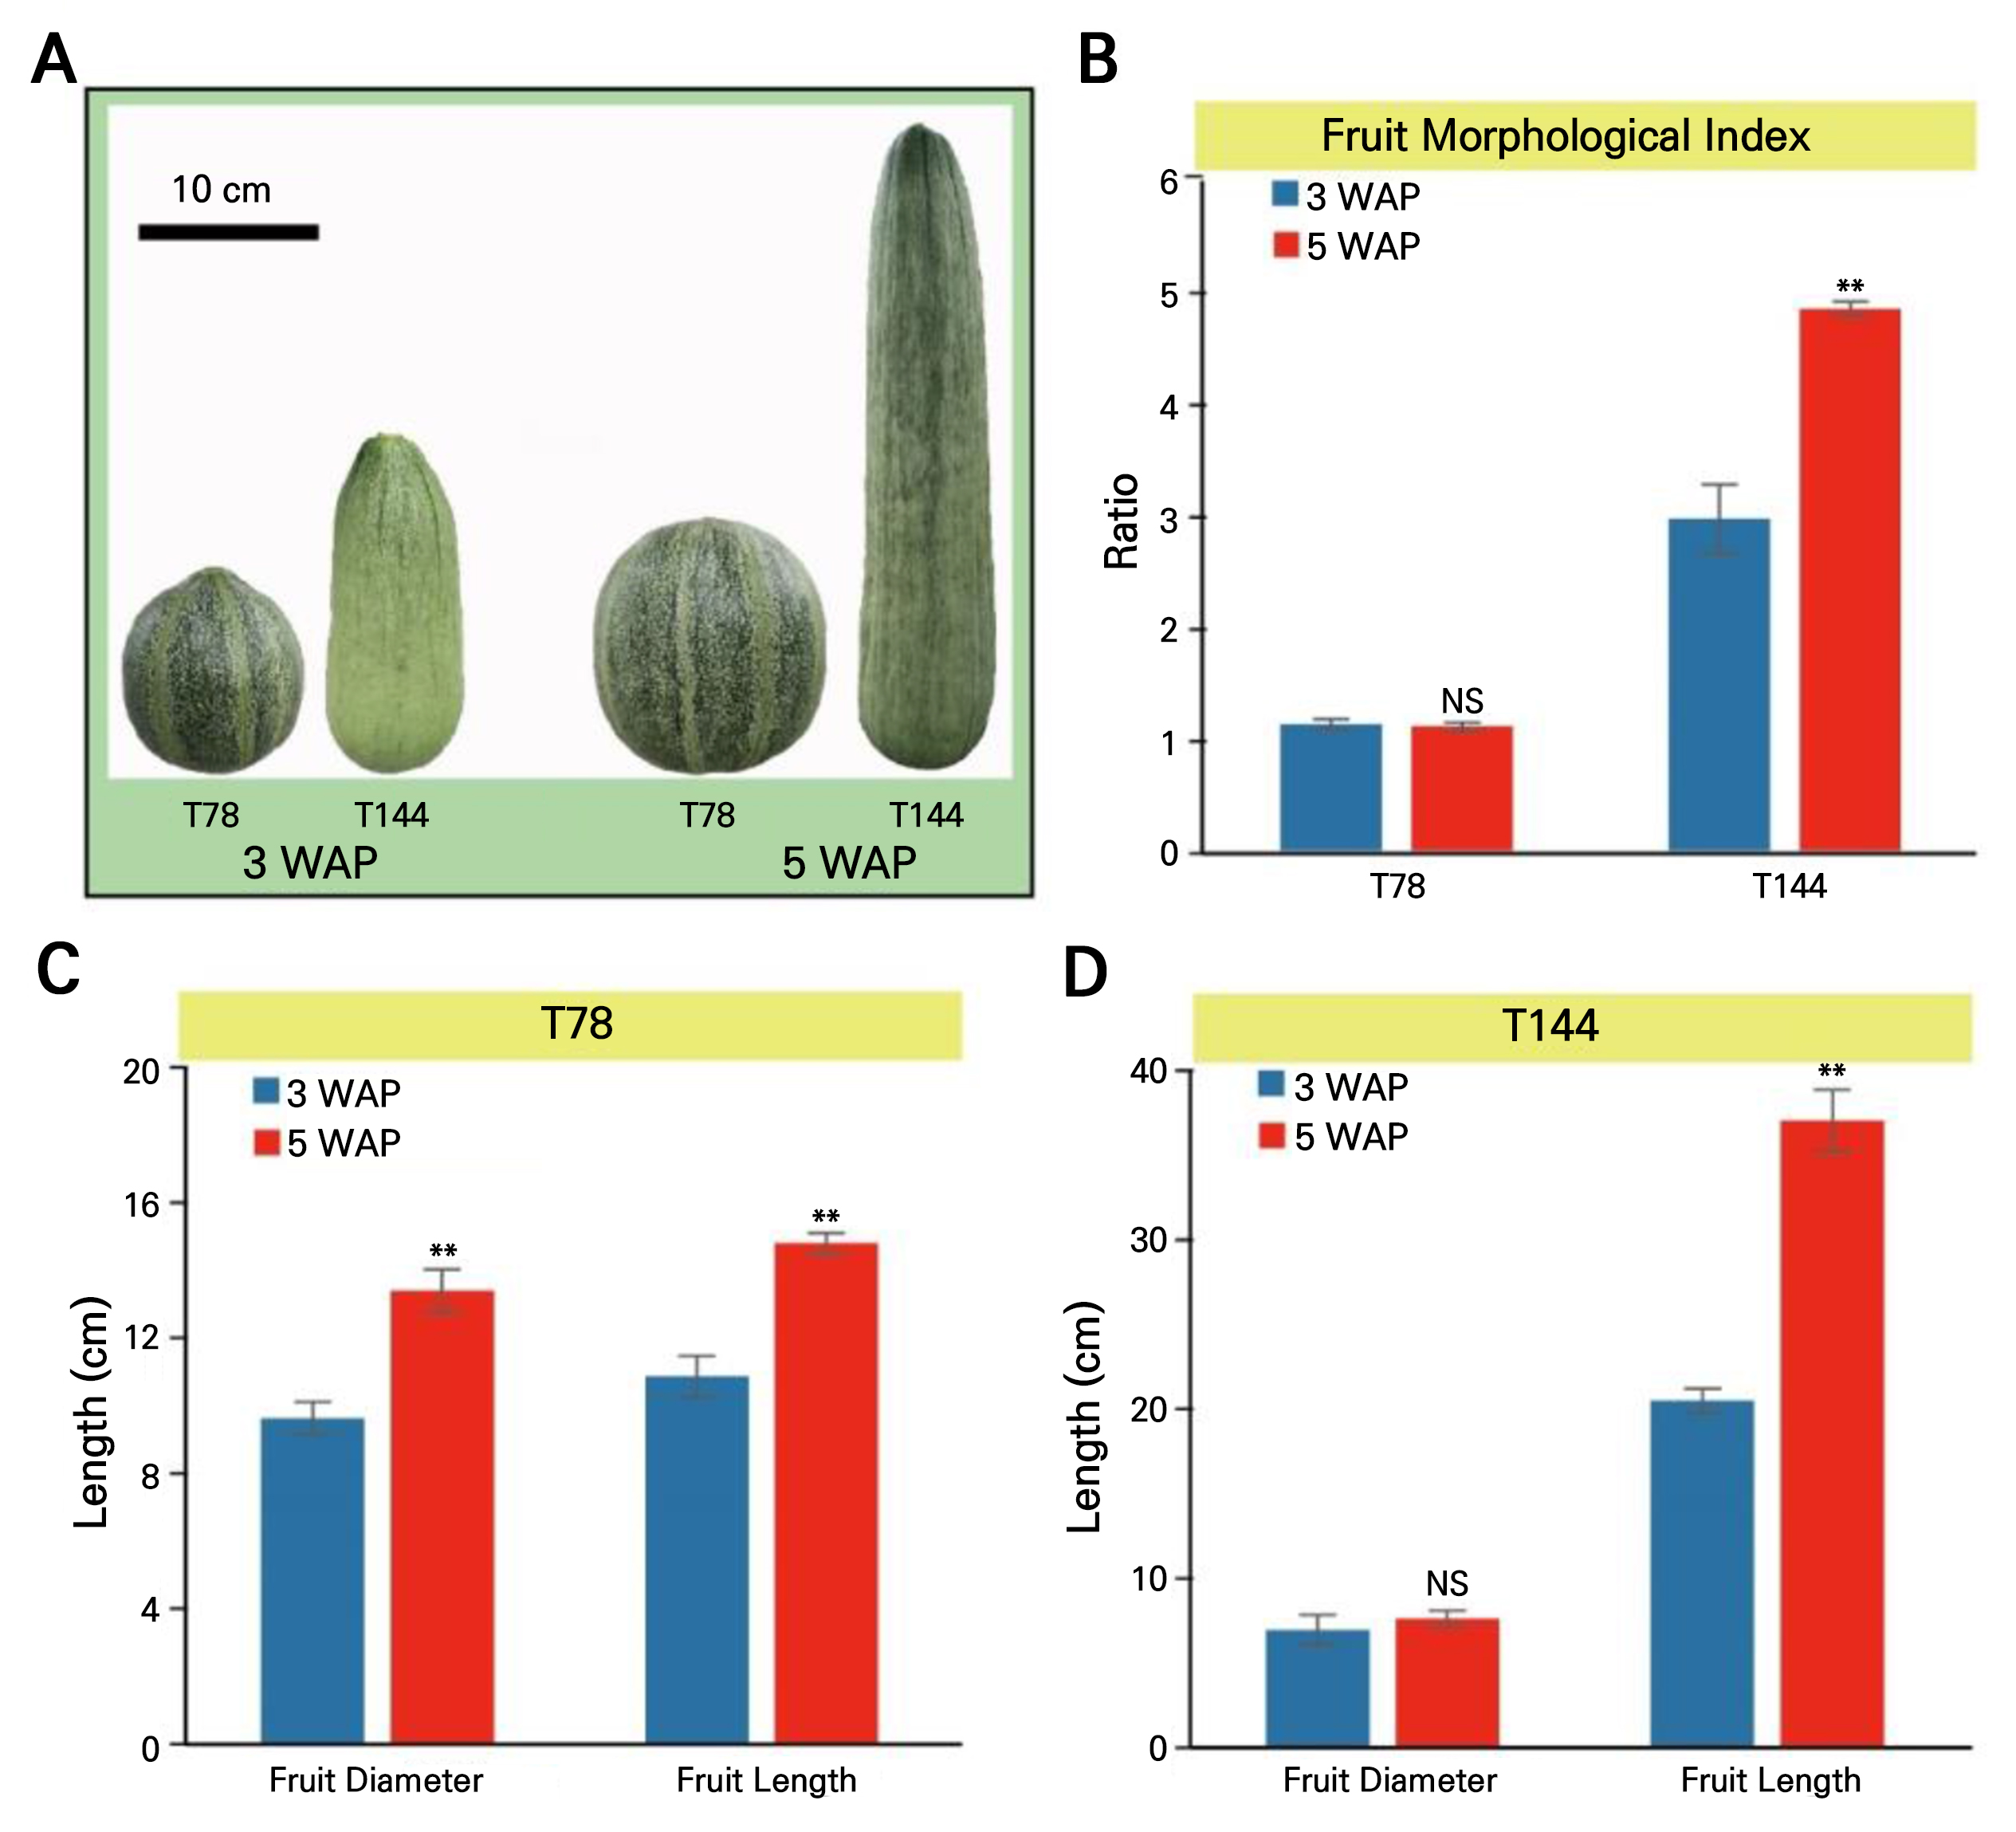
Fig. 1.
Phenotypic characterization of melon varieties T78 and T144: (A) fruit phenotypes of melon varieties T78 and T144 at three weeks and five weeks after pollination, (B) comparison analysis of the fruit morphological indices of melon T78 and T144 at three weeks and five weeks after pollination, (C) comparative analysis of the fruit diameter and fruit length of melon T78 at three weeks and five weeks after pollination, and (D) comparative analysis of the fruit diameter and fruit length of melon T144 at three weeks and five weeks after pollination.
RNA profile during fruit growth
To investigate the specific expression patterns and profiles of genes during the elongation and growth of melon fruits, a transcriptomic analysis was conducted on the central flesh of fruits from two varieties, T78 and T144, at three weeks after pollination (3WAP). In this study, T78 served as the control group, while T144 was designated as the experimental group. Transcriptome sequencing revealed significant differences in the overall gene expression profiles between the two groups, with a substantial number of DEGs detected across each chromosome of the melon genome assembly (Fig. 2A). These DEGs are closely associated with fruit elongation and growth. Genes with log2 fold change (log2FC) > 1 were classified as up-regulated, while those with log2FC < ‒1 were considered down-regulated. The expression analysis indicated that in T144, 1,975 genes were up-regulated, 1,660 genes were down-regulated, and 17,307 genes showed no significant expression difference (Fig. 2B and Supplementary Table S1). Following read alignment, transcript sequences were reconstructed using StringTie (version 2.1.4) with the default parameters. The assembled transcripts were compared against the reference annotation using the ‘gffcompare’ tool to identify known and novel transcripts. Transcripts with FPKM ≥ 0.5 in at least one sample were retained for a downstream analysis. The reconstruction results identified 1,245 novel transcripts across all samples (Supplementary Table S1).
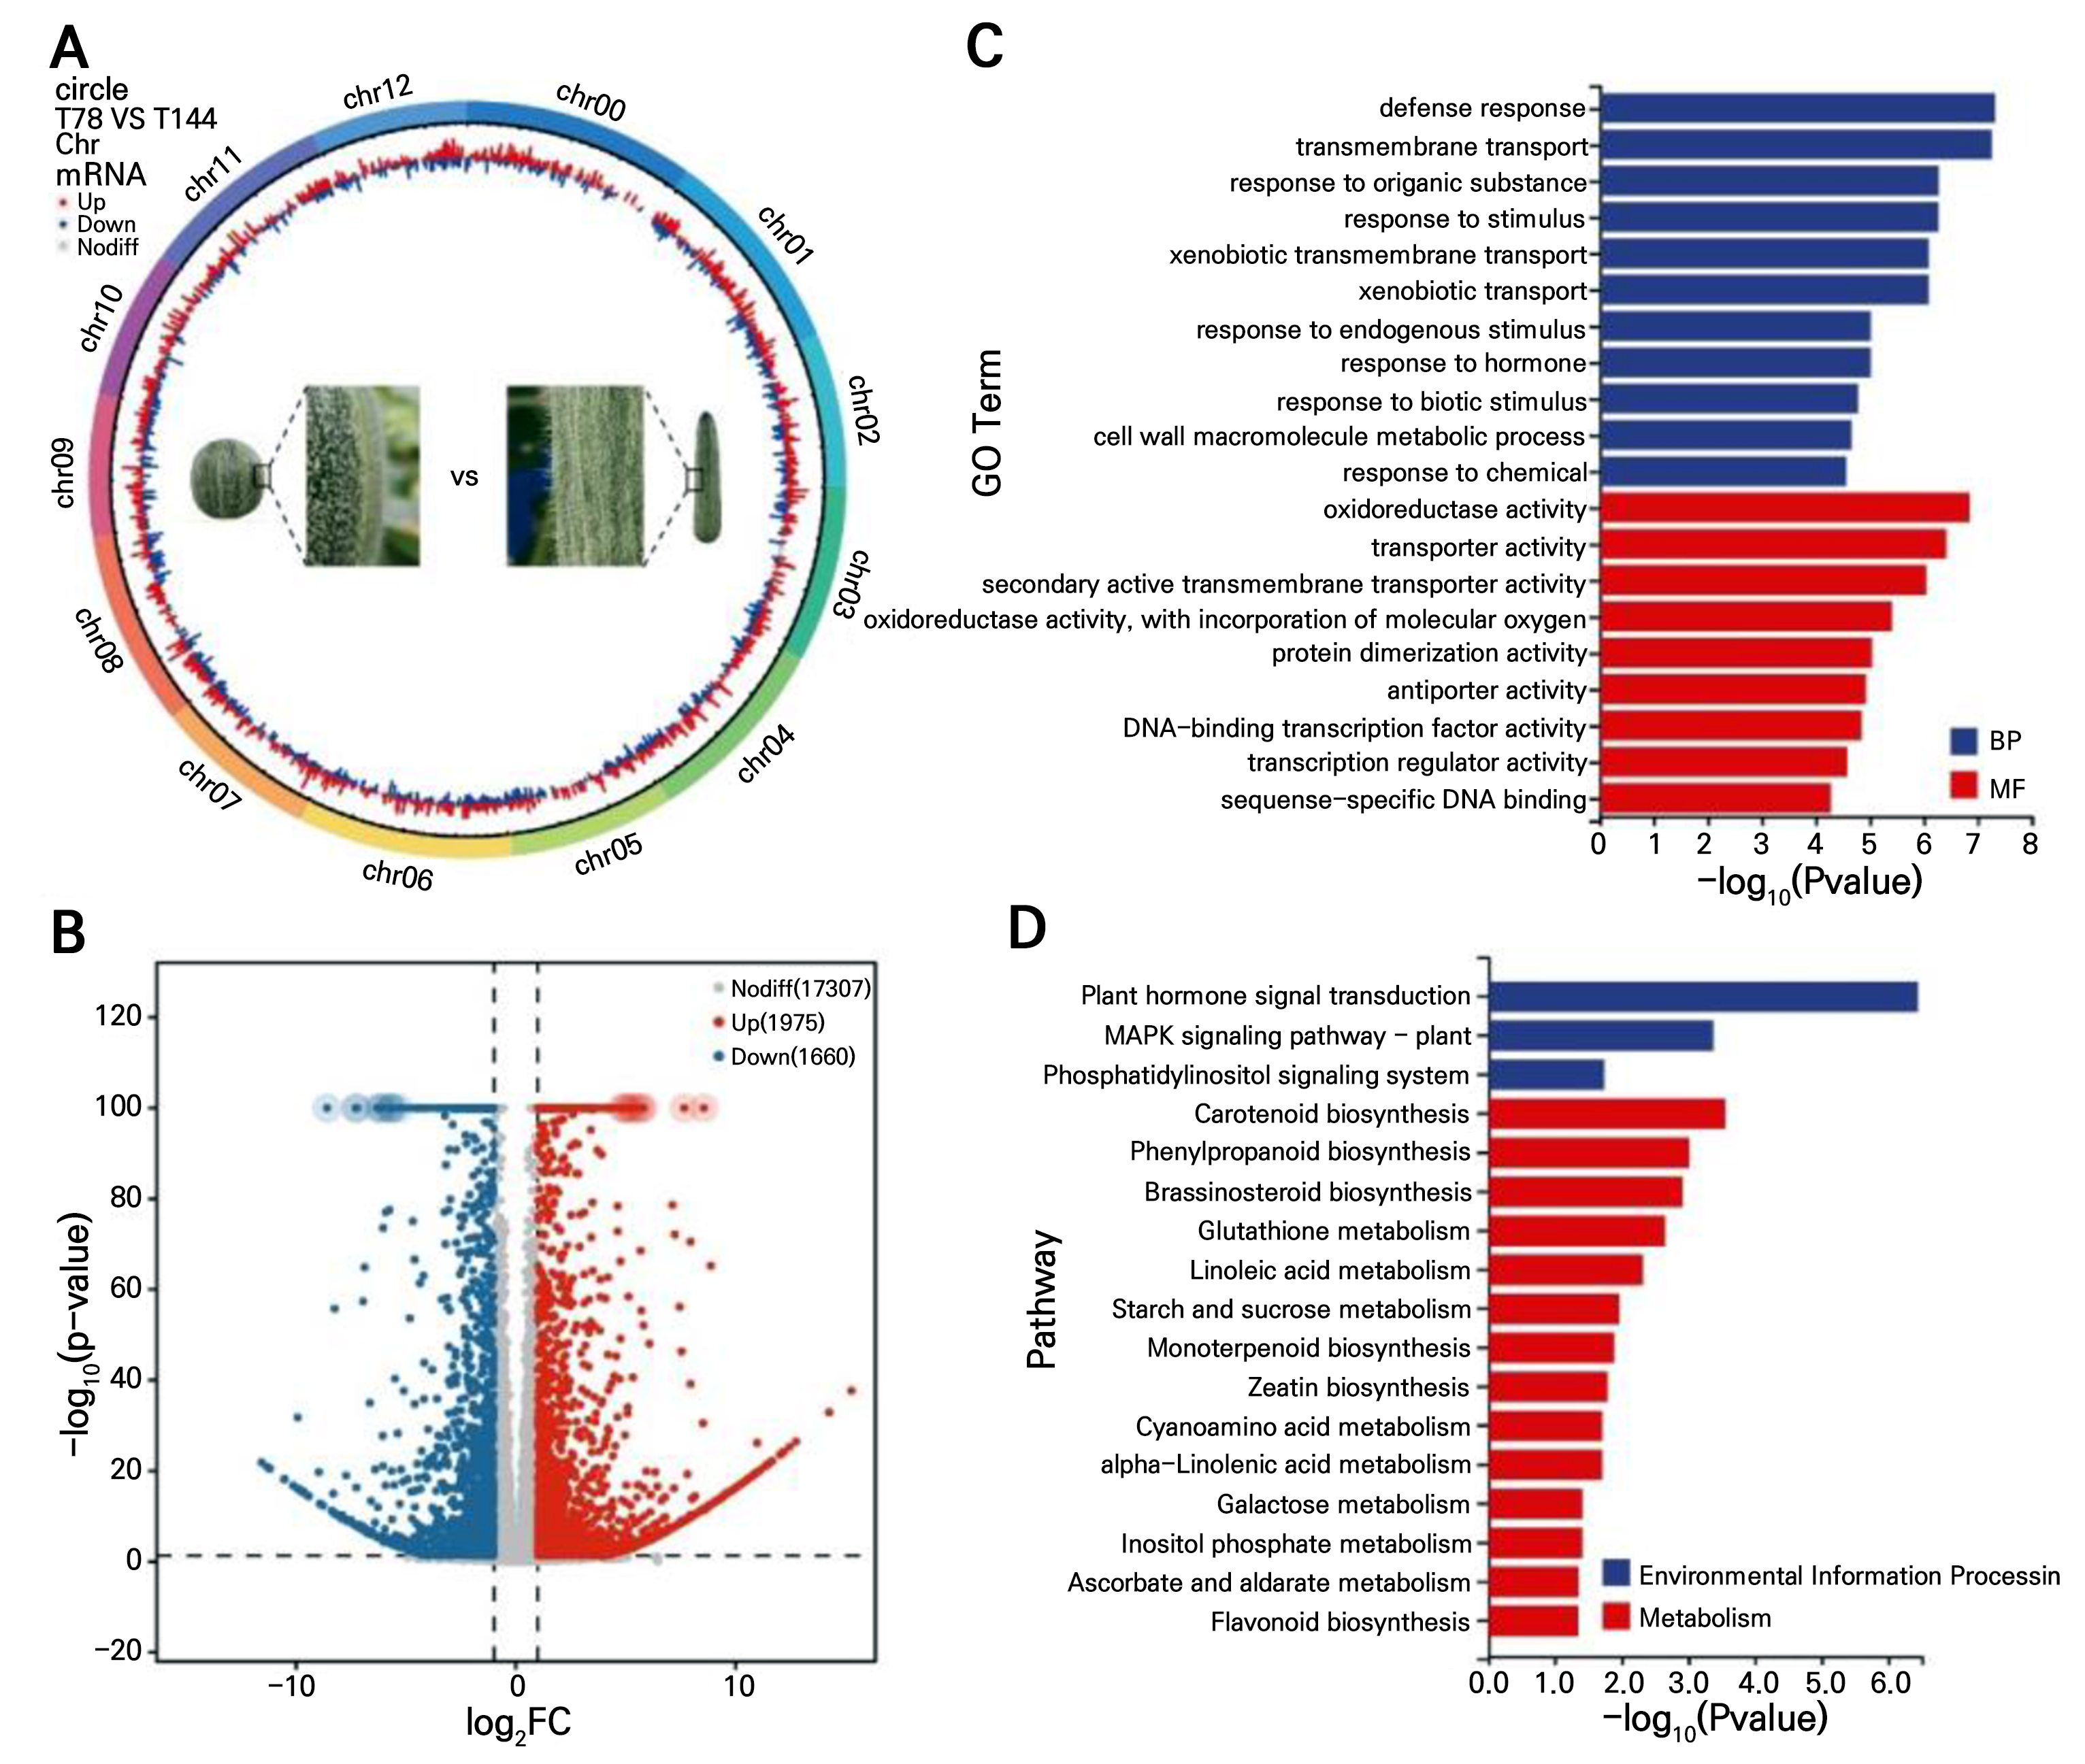
Fig. 2.
Transcript profile of T78 and T144: (A) genome-wide expression analysis including genomic-wide expression profiling and a comparative analysis of T144 and T78, (B) differential gene expression analysis with a volcano plot illustrating gene expression alterations in T144 compared to T78, (C) GO enrichment analysis of differentially expressed genes in T144 and T78, and (D) KEGG pathway analysis of differentially expressed genes in T144 and T78.
A GO enrichment analysis of DEGs revealed that the biological processes primarily involved defense responses, transmembrane transport, responses to organic substances, xenobiotic transmembrane transport, responses to endogenous stimuli, and hormone responses (Fig. 2C). The main molecular functions included oxidoreductase activity, DNA-binding transcription factor activity, and transcription regulator activity (Fig. 2C). A KEGG pathway analysis of DEGs yielded similar results, indicating that these genes are mainly involved in plant hormone signal transduction, the MAPK signaling pathway, the phosphatidylinositol signaling system, and other signaling pathways (Fig. 2D). Additionally, they are implicated in carotenoid biosynthesis, phenylpropanoid biosynthesis, linoleic acid metabolism, starch and sucrose metabolism, and other biosynthetic and metabolic pathways (Fig. 2D). The results of the GO and KEGG enrichment analyses suggest that hormone synthesis and metabolism play a crucial role in the elongation and growth of T144 melon fruits.
IAA biosynthesis is associated with fruit elongation
The plant hormone auxin, specifically IAA, plays a crucial role in various aspects of plant growth and development, including cell division and elongation (Woodward and Bartel 2005; Teale et al. 2006; Mano and Nemoto 2012). While the biosynthesis mechanism of IAA remains not fully elucidated, it is established that there are two primary synthetic pathways: tryptophan (Trp)-dependent and Trp-independent pathways (Di et al. 2016). In the indole-3-pyruvic acid (IPyA) pathway, one of the Trp-dependent routes, Trp can be converted into IAA via the intermediate indole-3-pyruvate (IPA). This conversion involves enzymes such as tryptophan aminotransferase (TAA/TAR) and flavin monooxygenase-like enzyme (YUCs). Alternatively, IAA can also be synthesized from IPA and indole-3-acetaldehyde (IAAId) through the action of TAA/TAR, indole-3-pyruvate decarboxylase (IPDC), and aldehyde oxidase (AAO) (Fig. 3A). In this study, we identified and examined genes encoding TAAs, TARs, YUCs, IPDC, and AAO in melon using published gene annotations. The results indicated that there were nine annotated YUC genes and seven AAO genes (Supplementary Table S2). An expression analysis revealed that among the nine YUC genes, MELO3C035023, MELO3C013512, MELO3C002007, MELO3C013965, MELO3C010272, and MELO3C034758 exhibited significantly higher expression levels in T144 compared to T78 (Fig. 3B). Similarly, among the seven AAO genes, MELO3C026248, MELO3C009219, MELO3C014716, MELO3C014719, and MELO3C031051 showed significantly higher expression levels in T144 than in T78 (Fig. 3C). These findings suggest that the genes involved in IAA biosynthesis were more highly expressed in T144 and that they contribute to its enhanced fruit elongation.
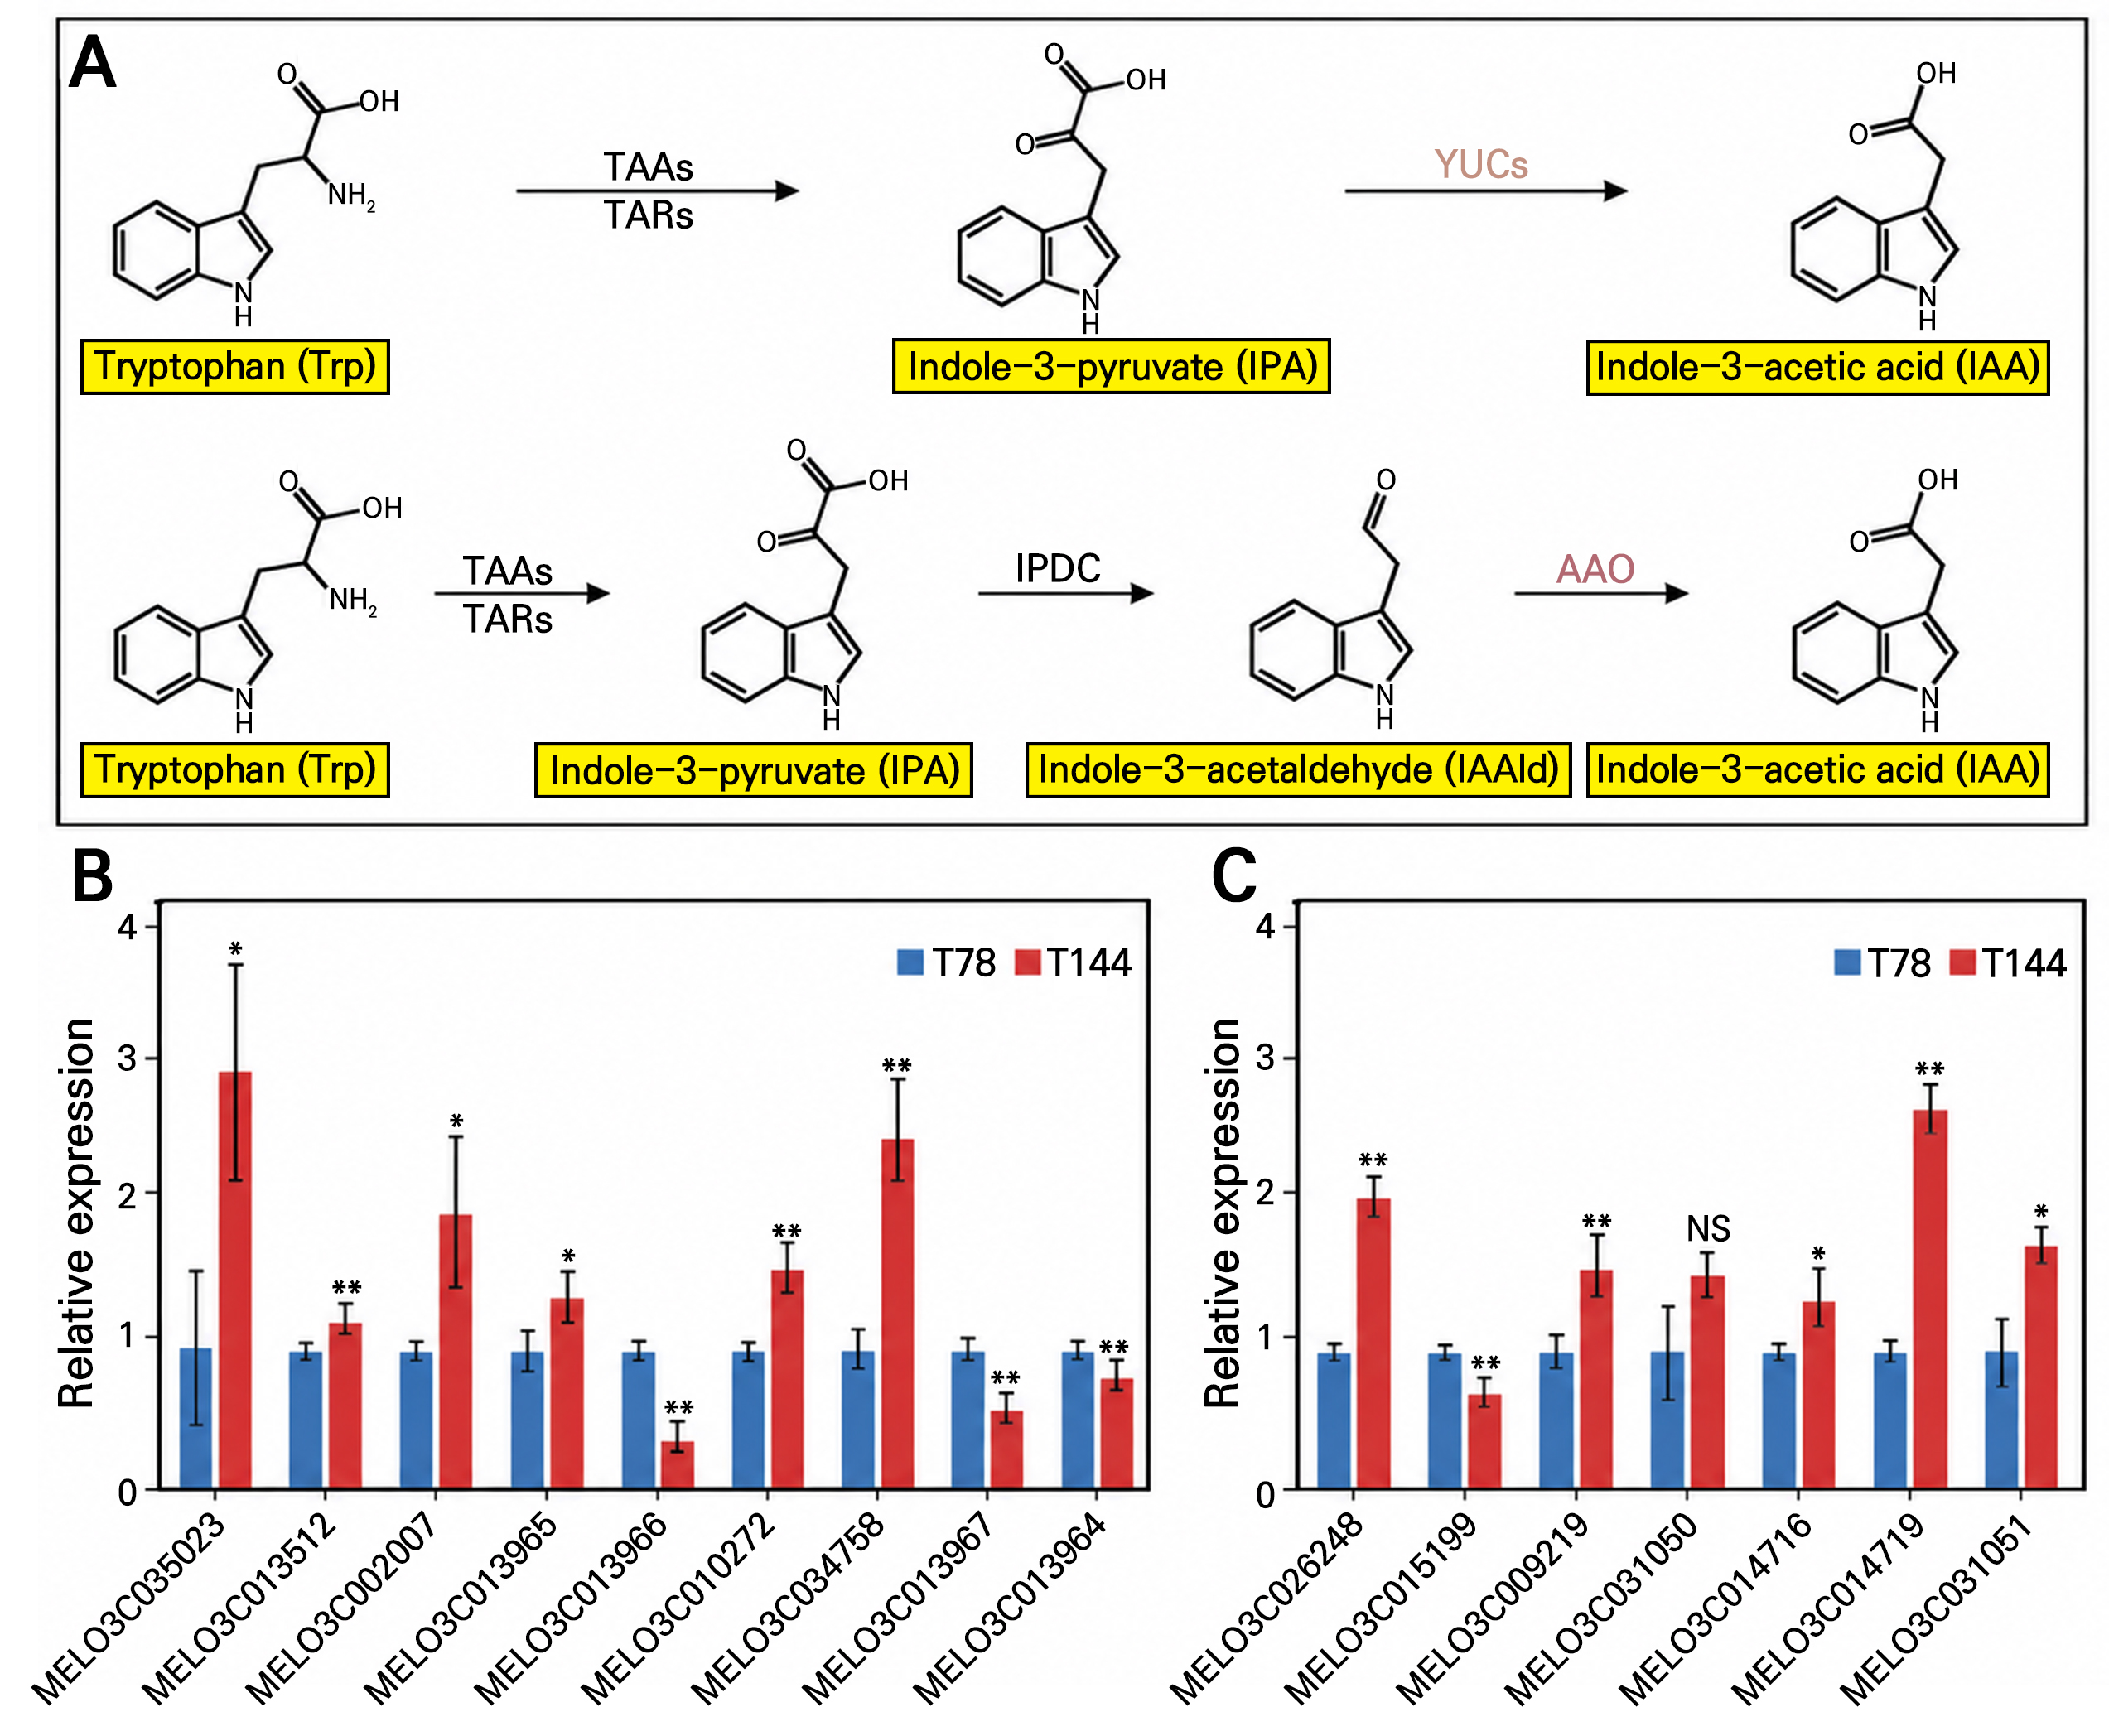
Fig. 3.
Analysis of the biosynthetic of indole-3-acetic acid in melon cultivars T78 and T144: (A) biosynthetic pathway of indole-3-acetic acid derived from tryptophan, (B) comprehensive analysis of the expression profiles of nine YUC genes in melon cultivars T78 and T144, and (C) comprehensive analysis of the expression profiles of seven AAO genes in melon cultivars T78 and T144. In the ANOVA analysis, “41” indicated significance at p < 0.01, “*” indicated significance at p < 0.05, and “NS” denoted non-significance.
Different metabolites of fruit with different morphologies during the growth period
A non-targeted metabolomic analysis of the fruit pulp from T78 and T144 was conducted using liquid chromatography coupled with tandem mass spectrometry. A total of 18,921 metabolic features were detected, among which 550 metabolites were identified (Supplementary Table S3). These metabolites were categorized in descending order as follows: lipids and lipid-like molecules, organoheterocyclic compounds, organic acids and derivatives, benzenoids, phenylpropanoids and polyketides, organic nitrogen compounds, organic oxygen compounds, alkaloids and derivatives, lignans, and nucleosides (Fig. 4A). Compared to T78, T144 exhibited 1,825 up-regulated and 6,092 down-regulated compounds (Fig. 4B). By constructing a comprehensive prediction model based on random forest regression to assess the importance of each metabolite, 20 metabolites associated with fruit morphology were identified (Fig. 4C). The top five metabolites by importance are NEG_7511 (phosphatidylcholine), NEG_181 (proline), NEG_2960 (16-hydroxy-9-oxooctadeca-10,12,14-trienoic acid), NEG_3520 (corchorifatty acid), and NEG_1335 (myristic acid) (Supplementary Table S4). A KEGG pathway analysis revealed that differentially expressed metabolites were primarily involved in pathways such as protein digestion and absorption, mineral absorption, D-amino acid metabolism, biosynthesis of amino acids, aminoacyl-tRNA biosynthesis, ABC transporters, the mTOR signaling pathway, and other metabolic pathways (Fig. 4D).
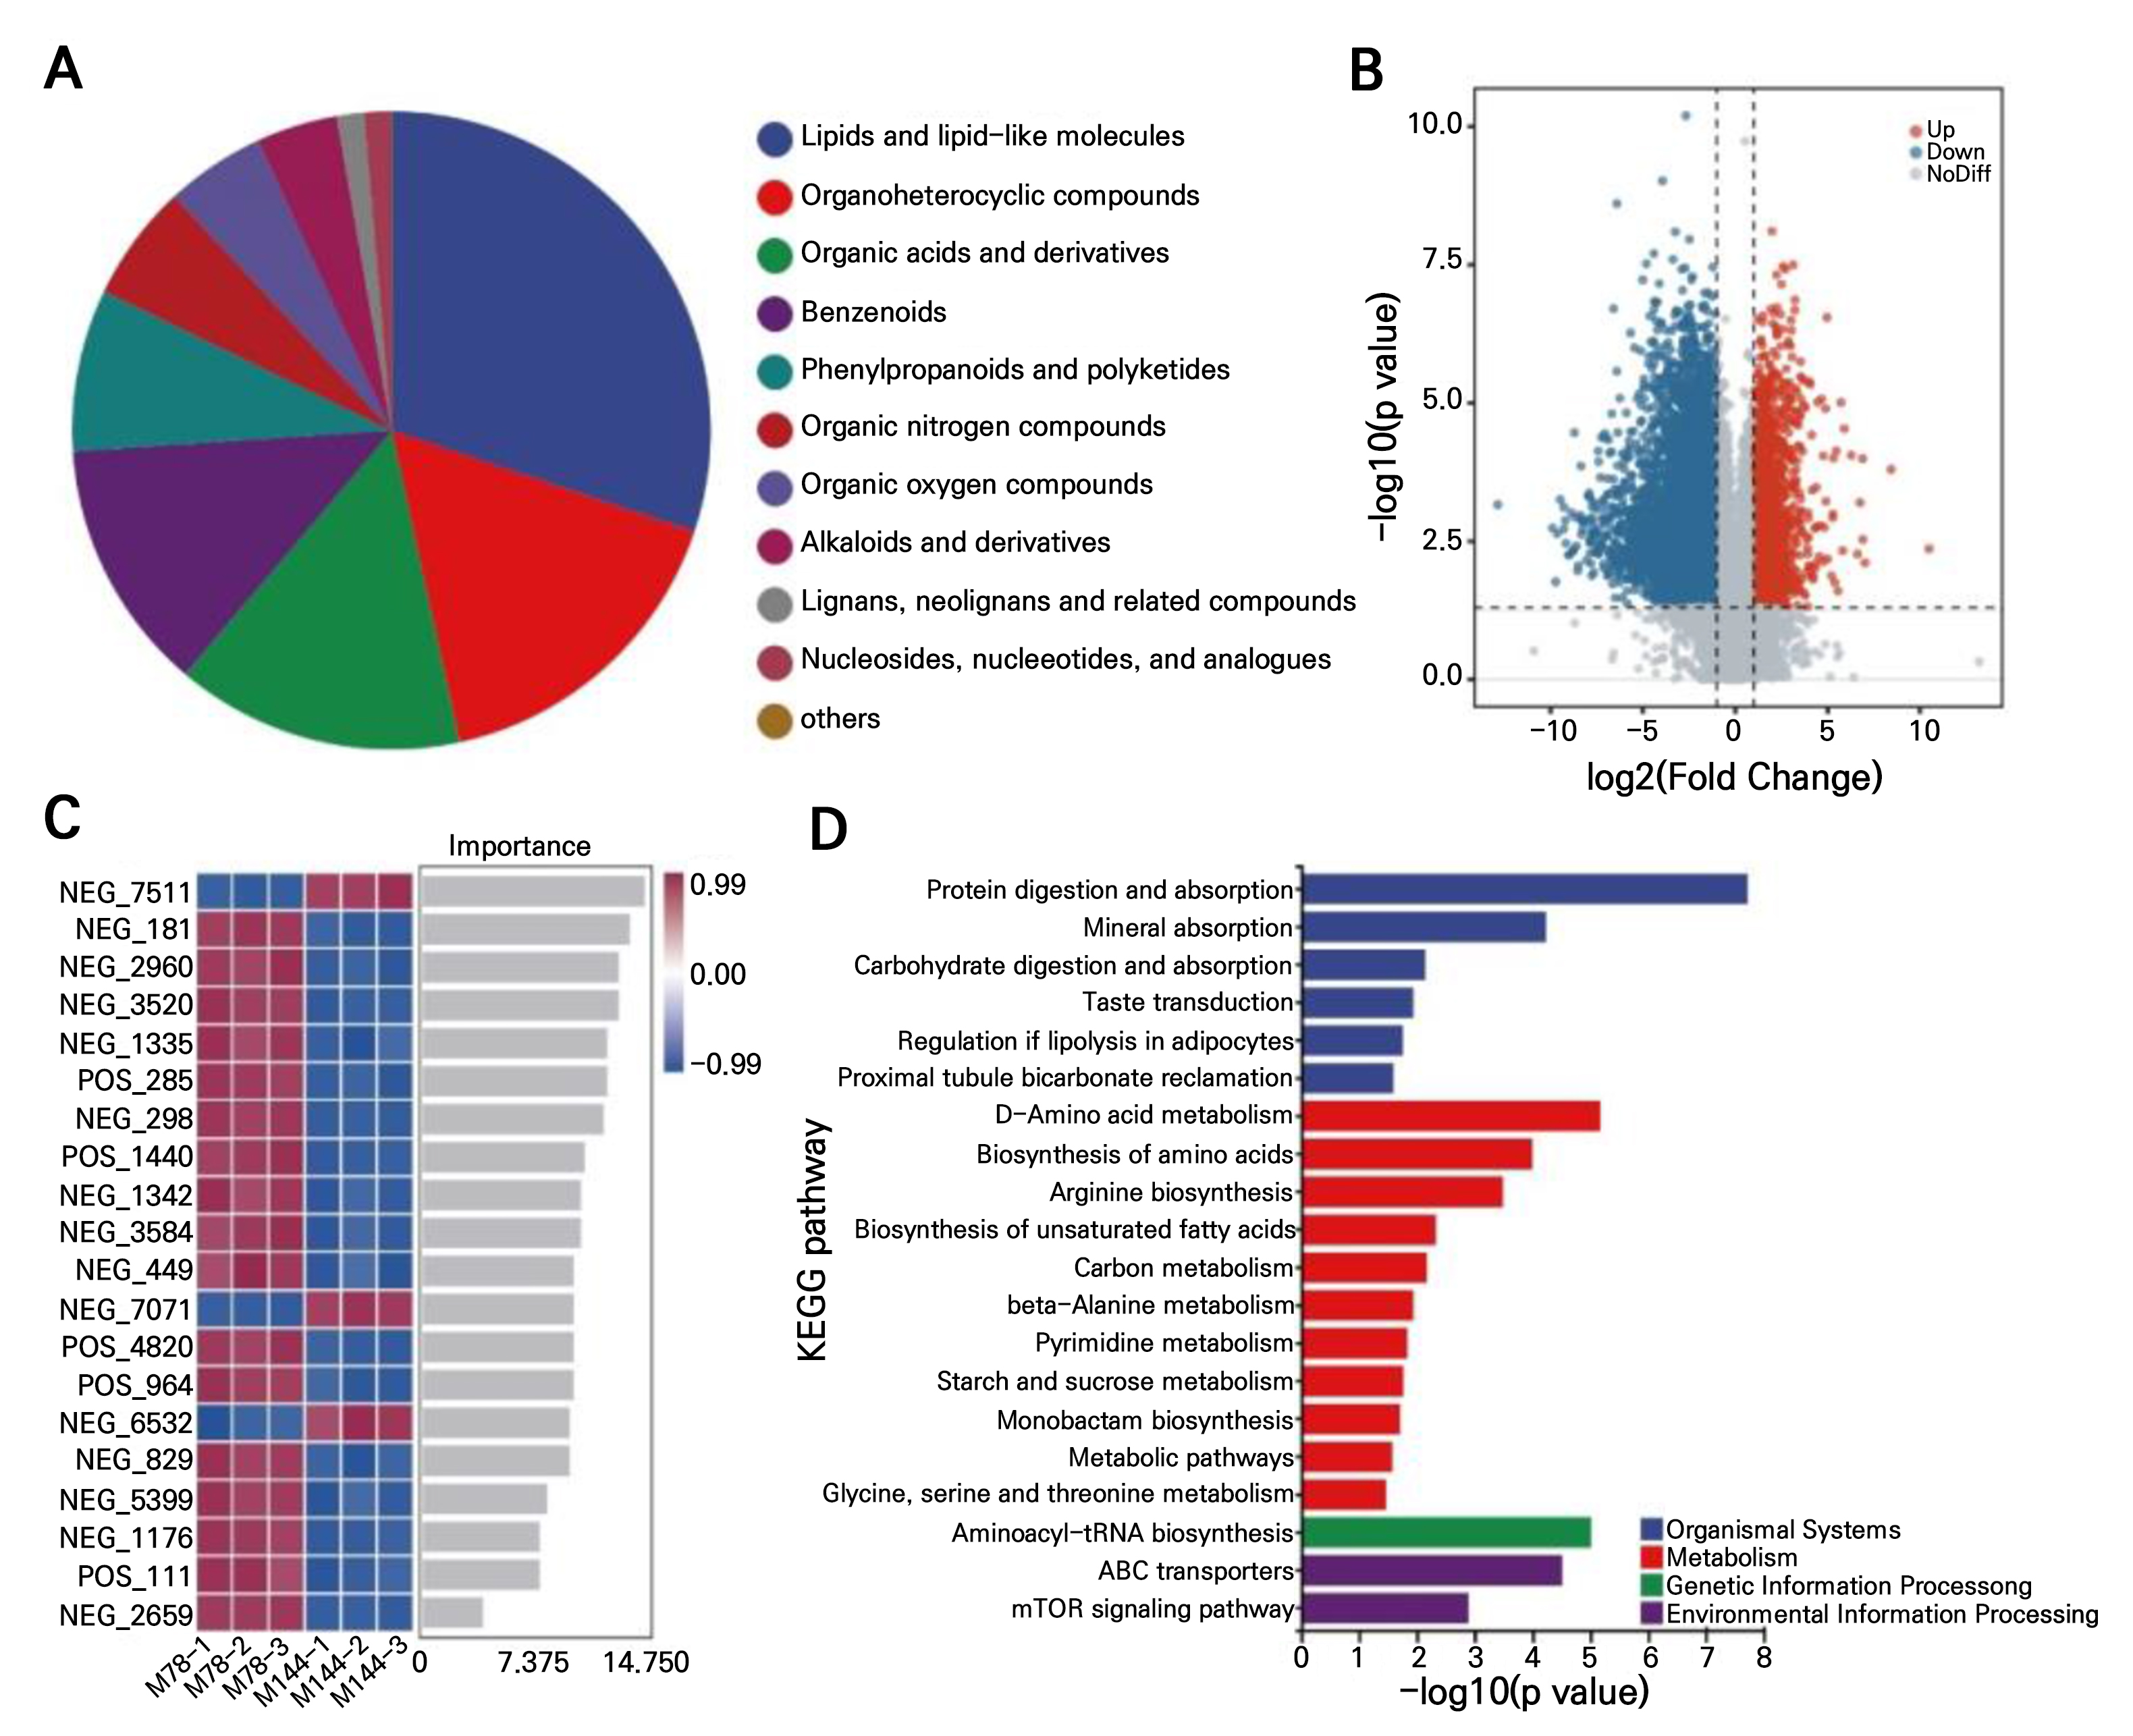
Fig. 4.
Metabolomic analysis in melon cultivars T78 and T144: (A) classification and quantitative analysis of metabolites in melon varieties T78 and T144, (B) differential metabolite analysis, with a volcano plot illustrating metabolite alterations in T144 compared to T78, and (C) machine learning for the identification of differential metabolites. Random forest analysis: In the histogram, the x-axis represents the importance of each metabolite to the classifier model, while the y-axis lists the names of the metabolites. The heatmap illustrates the abundance distribution of these metabolites across different samples or groups. Metabolite importance to the model decreases from top to bottom. These key metabolites can serve as potential markers for distinguishing between groups. (D) KEGG pathway analysis of differential metabolites in T144 and T78.
The expression of CmTOR was correlated with melon fruit length
It is evident from previous studies that differential metabolites in T78 and T144 are involved in the mTOR signaling pathway. The target of rapamycin (TOR) is an evolutionarily conserved serine/threonine protein kinase that integrates signals from nutrients, energy, hormones, growth factors, and environmental cues to regulate cell proliferation, growth, and metabolism across a wide range of multicellular organisms (Saxton and Sabatini 2017; Shi et al. 2018). TORC1, which is conserved in plants, comprises core components such as TOR, RAPTOR, and LST8 (Saxton and Sabatini 2017; Tatebe and Shiozaki 2017). Research has demonstrated that TORC1 promotes cell proliferation and growth by enhancing protein synthesis, lipid and nucleotide synthesis, and inhibiting autophagy in various animals and plants (Düvel et al. 2010; Xiong and Sheen 2012b; Xiong et al. 2013). In this study, we reviewed pertinent literature and identified that TORC1 facilitates cellular proliferation and growth by enhancing protein synthesis, lipid synthesis, nucleotide synthesis, and by inhibiting cellular autophagy. In melon, there are four CmTOR genes, one CmLST8 gene, and four CmTOR genes (Supplementary Table S5). We employed AlphaFold Multimer (v2.2) to predict the three dimensional structures and interaction interfaces among CmTOR (MELO3C031894), CmLST8 (MELO3C009659), and CmRAPTOR (MELO3C027185). The predicted models suggested potential interactions among these proteins, consistent with the conserved TORC1 complex architecture observed in other eukaryotes. Molecular docking and protein-protein interaction prediction analyses revealed that CmTOR, CmLST8, and CmRAPTOR may potentially interact to form complexes, although this prediction requires further experimental validation (Fig. 5A). We analyzed the expression levels of CmTOR, CmLST8, and CmRAPTOR in T78 and T144 and found that the four CmTOR genes exhibited significantly higher expression levels in T144 compared to T78 (Fig. 5B and Supplementary Table S5). No significant differences were observed in the expression levels of CmLST8 and CmRAPTOR between T78 and T144 (Fig. 5C and Supplementary Table S5). These findings suggest a correlation between CmTOR expression and melon fruit length.
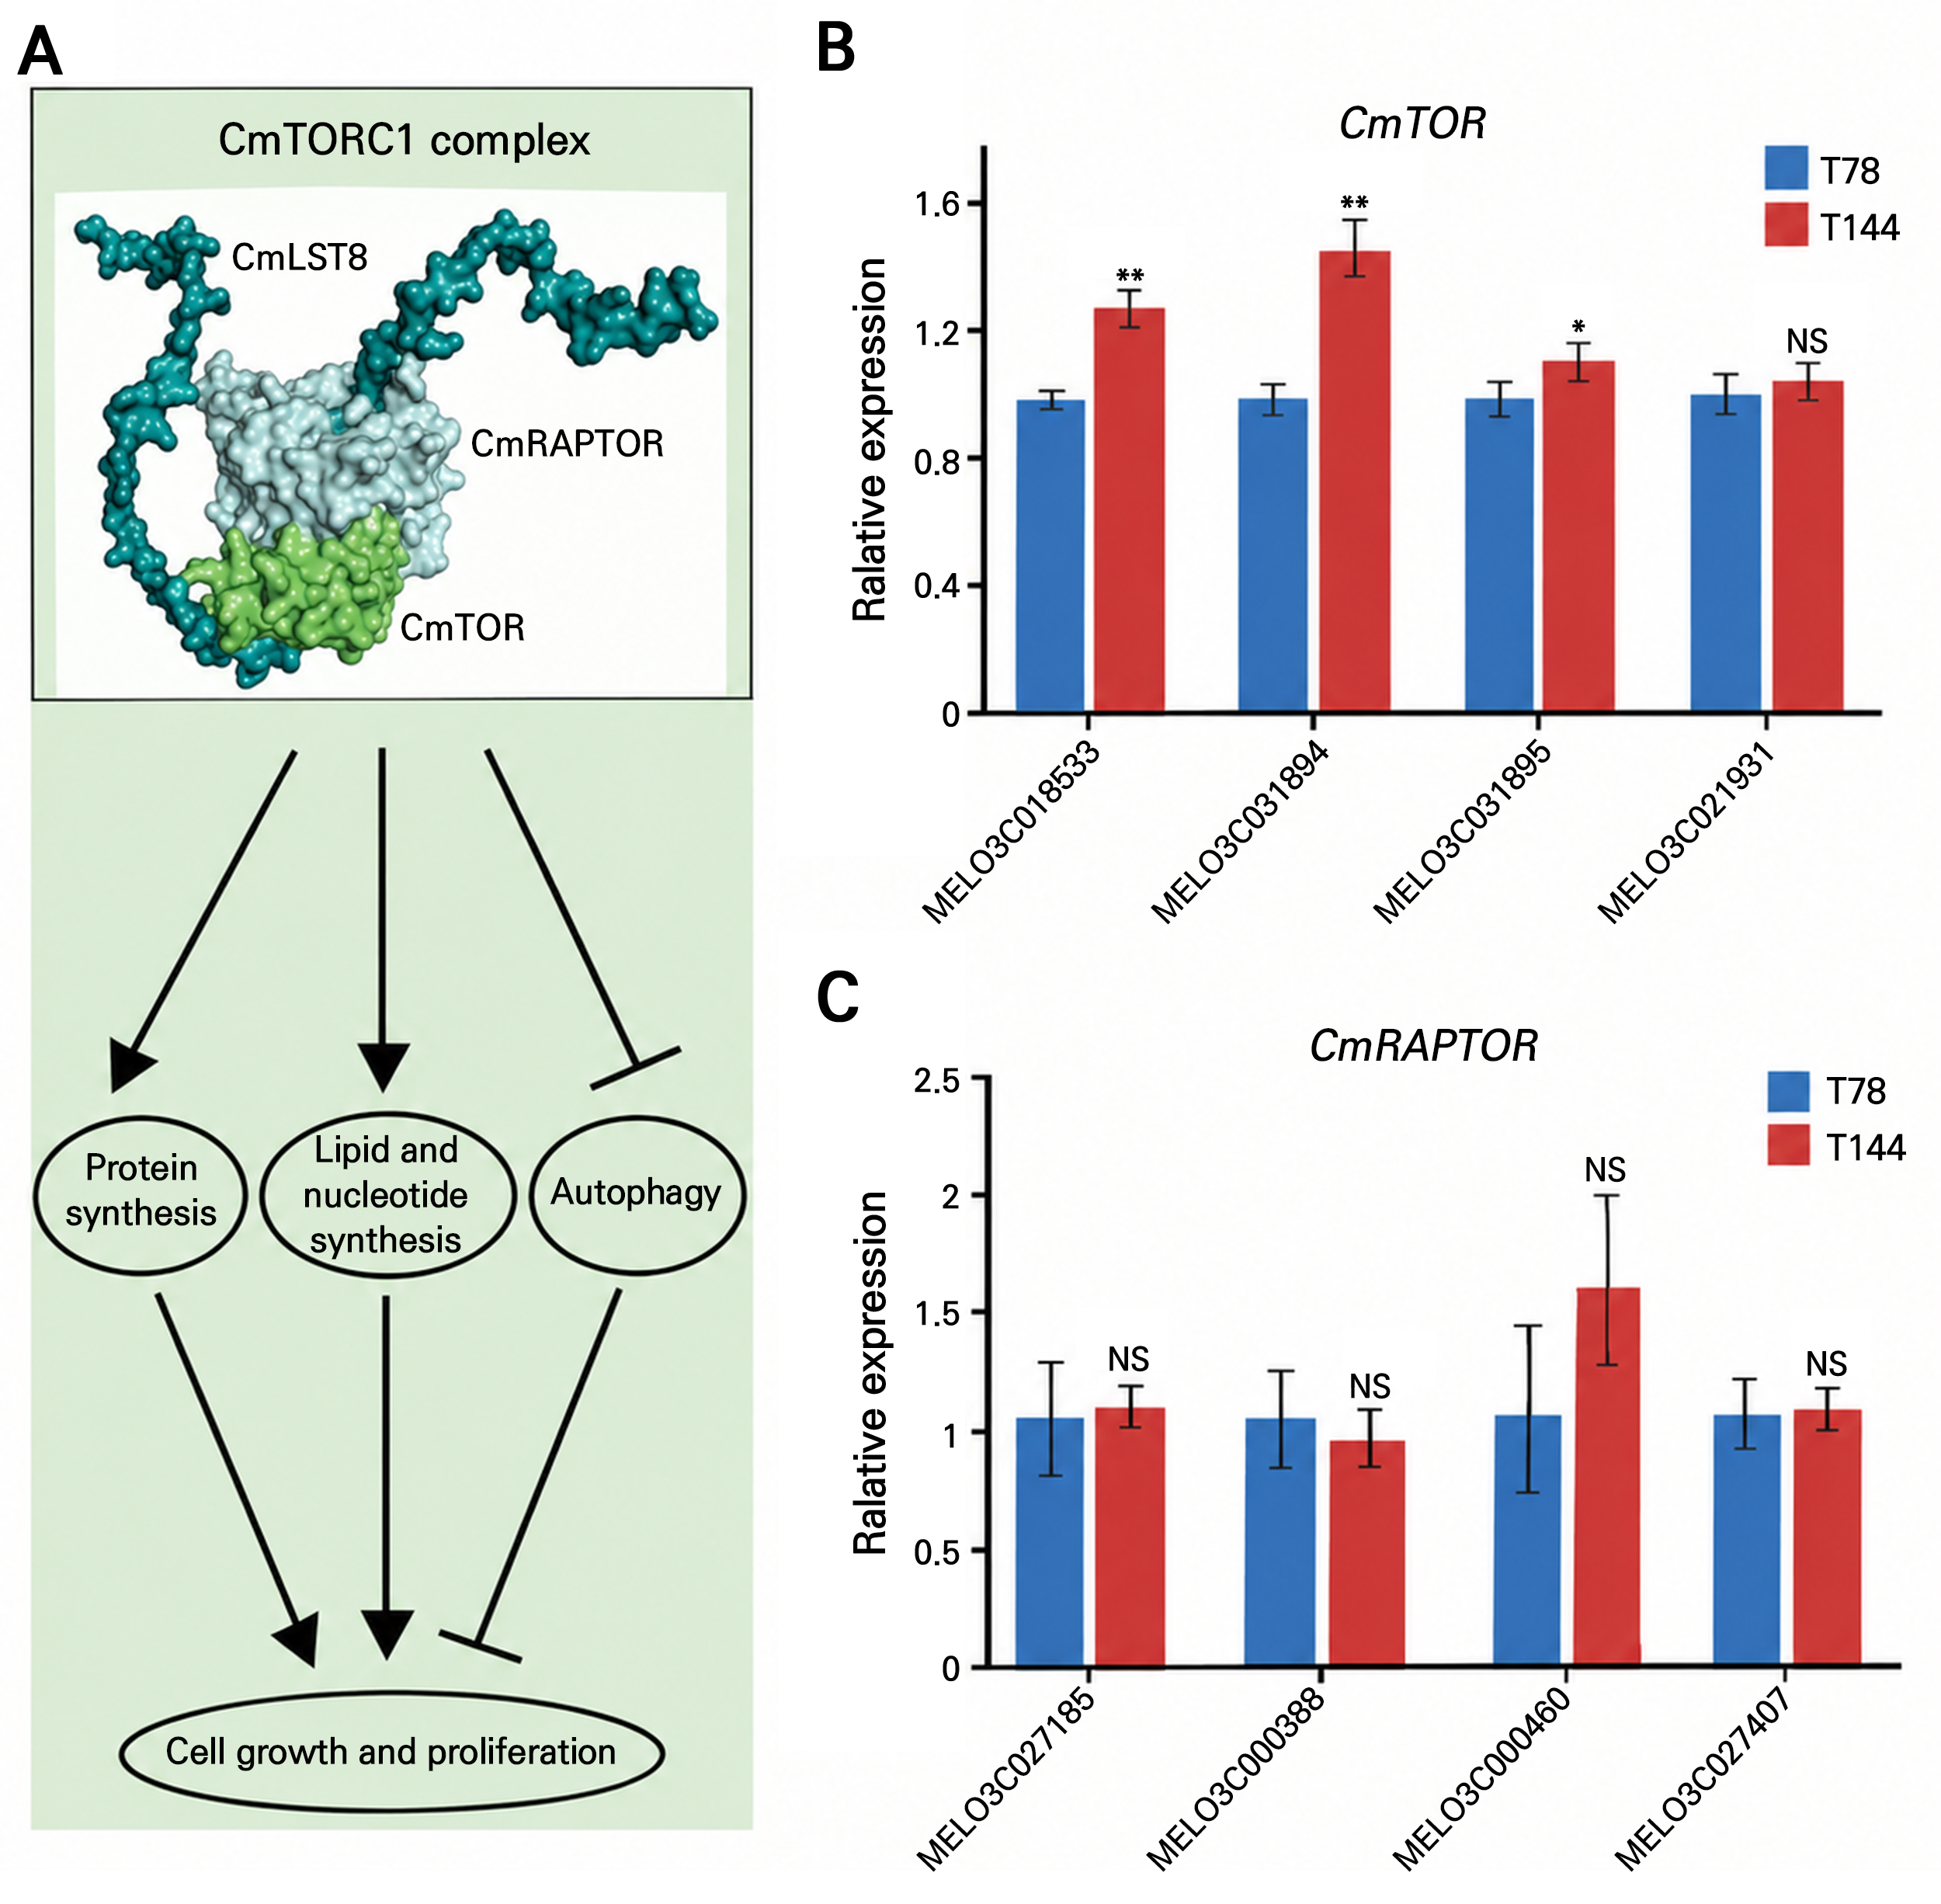
Fig. 5.
Correlation analysis between CmTORC1 and fruit length in melon: (A) architecture of the CmTORC1 complex in melon and corresponding mechanism for promoting cell growth and proliferation, (B) comprehensive analysis of the expression profiles of five CmTOR genes in melon cultivars T78 and T144, and (C) comprehensive analysis of the expression profiles of four CmRAPTOR genes in melon cultivars T78 and T144. In the ANOVA analysis, “41” indicated significance at p < 0.01, “*” indicated significance at p < 0.05, and “NS” denoted non-significance.
Cell division and elongation may directly cause changes in fruit length
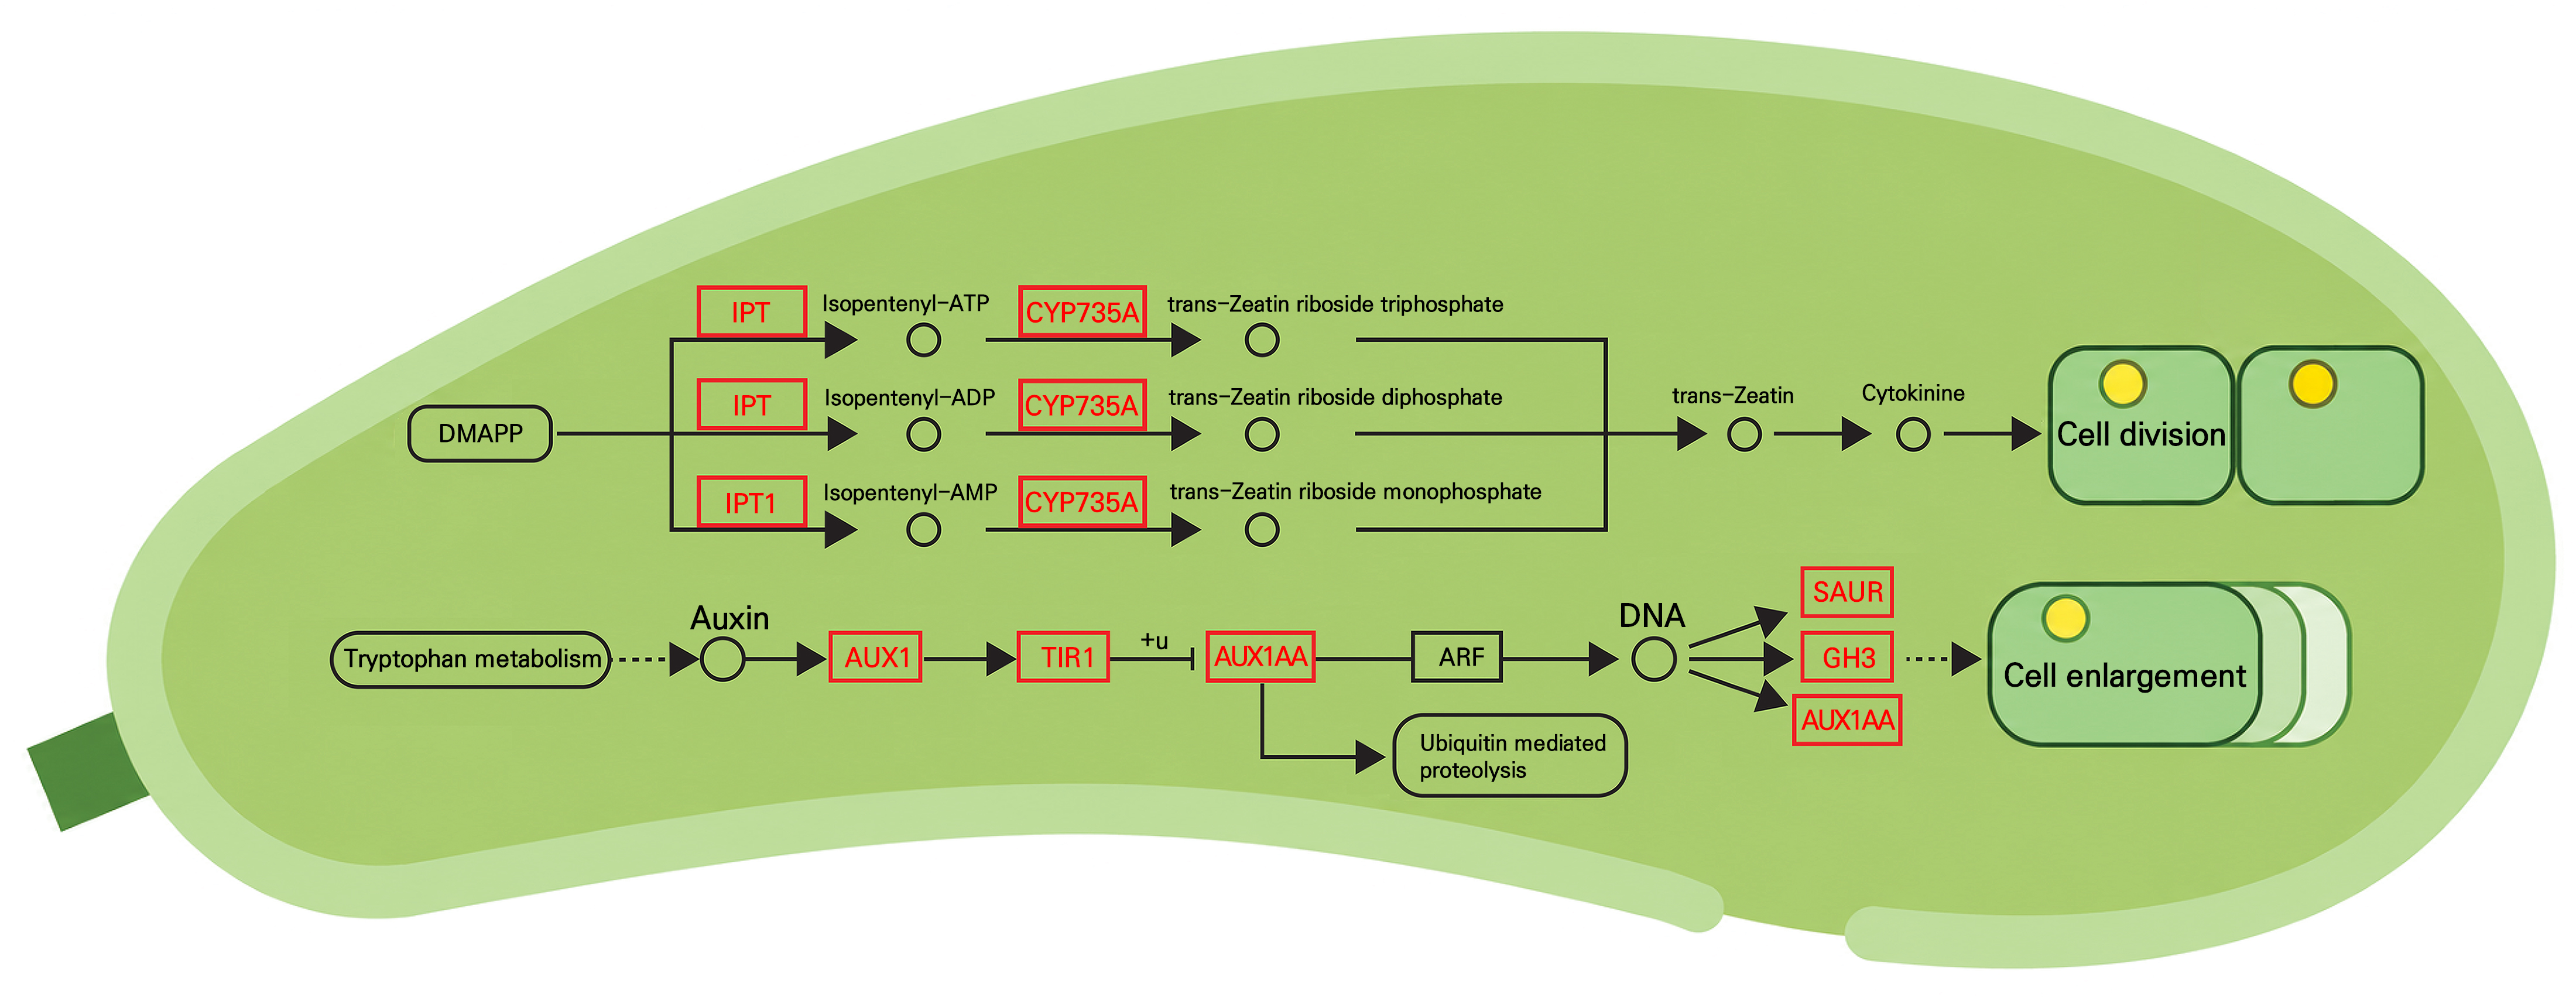
Numerous studies have demonstrated that fruit morphology is regulated by cell division and elongation (Wang et al. 2022; Xie et al. 2023). Cytokinins and auxins play crucial roles in these processes. Zeatin, a naturally occurring cytokinin in plants, is biosynthesized from DMAPP and ADP/ATP through the catalytic action of enzymes such as IPT and CYP735A, ultimately promoting cell division (Takei et al. 2004; Gajdošová et al. 2011; Schaller et al. 2014; Jameson 2023). Auxin regulates cell enlargement via AUX1, TIR1, AUX/IAA, SAUR, and GH3 (Perrot-Rechenmann 2010; Velasquez et al. 2016; Du et al. 2020). To investigate whether melon fruit length is associated with cell division and elongation, we examined the zeatin biosynthetic pathway in cytokinin and the expression levels of key genes in the IAA pathway in auxin in two melon varieties, T78 and T144. During cytokinin biosynthesis, the expression levels of IPT (MELO3C015852, MELO3C021401) and CYP735A (MELO3C022098) were significantly upregulated in T144 (Supplementary Fig. S1 and Supplementary Table S6). This suggests that cytokinin biosynthesis is more active in T144, leading to increased cell division activity. Additionally, during auxin signaling, AUX1, TIR1, AUX/IAA, SAUR, and GH3 were also upregulated to varying degrees in T144. Specifically, two copies of AUX1, one copy of TIR1, four out of five copies of AUX/IAA, three out of four copies of GH3, and ten out of fifteen copies of SAUR were upregulated (Supplementary Fig. S1, and Supplementary Table S6). These findings indicate that the signaling effects of cytokinin and auxin are more pronounced in T144, which may explain the predominant growth of T144 fruits after 3WAP. Therefore, it can be inferred that enhanced cell division and elongation likely contribute to fruit elongation, resulting in increased fruit length (Fig. 6).
Discussion
Fruit morphology is regulated by multiple genes, and the underlying mechanism is intricate. This study suggests that cell division and cell elongation may be associated with fruit elongation and growth. However, numerous studies have demonstrated that OVATE plays a crucial role in determining fruit length. OVATE contains a conserved 70-amino acid (aa) C-terminal domain found in tomato, rice, and Arabidopsis, indicating its importance as a regulatory protein in plant fruit development (Liu et al. 2002; Huang et al. 2013; Ahmad et al. 2023). As a member of the Ovate Family Proteins (OFP), OVATE is considered to function as a transcriptional repressor (Zhang et al. 2020b). In Arabidopsis, 20 OFP or OFP-like proteins have been identified (Jian-ping et al. 2012), which are involved in diverse developmental processes including ovule development, pod shape, leaf morphology, floral organ formation, pollen activity, and secondary cell wall biosynthesis (Hackbusch et al. 2005; Pagnussat et al. 2007; Li et al. 2011; Wang et al. 2011). Homologous genes of Arabidopsis OFP have also been extensively studied in other species, with various OFP family members reported to regulate plant morphology in multiple crops. For instance, CaOFP20 and PpOFP1 control fruit morphology in Capsicum annuum and Prunus persica, respectively (Cirilli and Rossini 2021; Luo et al. 2022), RsOFP2.3 influences tuberous root shape in Raphanus sativus (Wang et al. 2020), MaOFP1 regulates fruit ripening in Musa acuminata (Liu et al. 2015), BnOFP13_2 affects siliqua development in Brassica napus (Liu et al. 2022), and CsOFP12 controls silique length in Cucumis sativus (Han et al. 2022). In melon, 17 OFP genes were identified through sequence homology and a domain analysis. In this study, we examined the expression levels of these 17 OFP genes in two melon varieties, T78 and T144. The results showed that seven OFP genes, including CmOFP13, were not expressed in either variety (Supplementary Table S7). Among the remaining ten OFP genes, four exhibited no significant difference in expression between T78 and T144, while the remaining six showed differential expression levels. Notably, MELO3C024232 was significantly upregulated in T78 compared to T144 (Supplementary Table S7), consistent with the role of OFP as a transcriptional repressor. Although some melon genes have been cloned, their regulatory mechanisms remain poorly understood. In Arabidopsis thaliana, knockout of OFP1, OFP2, OFP3, and OFP5 resulted in longer hypocotyls and cotyledons due to enhanced cell elongation (Zhang et al. 2020b), suggesting that OFP can also influence cell elongation. In rice, OsOFP19, OSH1, and DLT form a functional complex that regulates BR signaling and cell division patterns (Yang et al. 2018). These findings imply that OFP genes and plant hormones may regulate fruit length via a common signaling pathway, warranting further investigation.
To date, there have been no reports of the involvement of the mTOR signaling pathway in trait regulation or stress responses in melon. This study found that different metabolites in T78 and T144 were associated with the mTOR signaling pathway. Notably, the expression level of CmTOR in T144 was significantly higher than that in T78 (Fig. 5), suggesting a potential role of the mTOR signaling pathway in the elongation and growth of melon fruit. This finding represents the first evidence of such involvement in melons. Rapamycin, discovered in 1964, is a compound known for its significant antifungal and antitumor properties (Martel et al. 1977; Eng et al. 1984). Further research revealed that rapamycin exerts its effects by forming a functional complex with FKBP12 to inhibit cell growth and proliferation through signal transduction pathways (Chung et al. 1992). In 1994, biochemical studies identified the mechanistic target of rapamycin (mTOR) as the direct target of the rapamycin-FKBP12 complex in mammals (Brown et al. 1994; Sabatini et al. 1994). The mTOR protein kinase network coordinates cellular growth with environmental conditions and plays a fundamental role in cellular and physiological processes (Saxton and Sabatini 2017). TOR genes were first identified in yeast in 1993 and later in plants in 2002, with TOR sequences being highly conserved across mammals, plants, and yeast (Kunz et al. 1993; Menand et al. 2002). As research on TOR has deepened, significant advancements have been made in elucidating the molecular and cellular functions as well as the mechanisms of TOR signaling in plants (Menand et al. 2002; Gangloff et al. 2004; Xiong and Sheen 2012a). In mammalian cells, TOR exists in two distinct protein complexes, mTORC1 and mTORC2, while only TORC1 is conserved in plants and animals (Tatebe and Shiozaki 2017). Arabidopsis thaliana was the first plant used to study the function of the TOR network system. In Arabidopsis, TOR is highly expressed in rapidly growing tissues, indicating its involvement in cell proliferation (Menand et al. 2002). These findings suggest that the sequence and molecular function of TOR are conserved between Arabidopsis and mammals. The conservation of the TOR function in both plants and mammals implies that the correlation between CmTOR and melon fruit length observed in this study is not coincidental. TOR can promote cell proliferation and may contribute to fruit elongation and growth. This function overlaps with that of cytokinins, potentially leading to synergistic effects. In this study, molecular docking and proteinprotein interaction prediction analyses revealed that CmTOR, CmLST8, and CmRAPTOR may potentially interact to form complexes, although this prediction requires further experimental validation.
In this study, we identified a substantial number of differentially expressed genes and metabolites through comprehensive transcriptomic and metabolomic analyses of melons at various developmental stages. Gene expression changes and an enrichment analysis revealed that auxin and cytokinin signaling pathways were significantly active in T144, promoting fruit elongation via enhanced cell division and elongation (Fig. 6). Fruit development is tightly regulated by the spatiotemporal expression of genes. Parameters such as the initiation of cell proliferation, the proliferation rate, duration, and growth direction are critical determinants of fruit shape, involving processes such as cell cycle regulation and hormonal dynamics (Schindeler 2008). Fruit formation encompasses several stages: pollination, fertilization, fruit set, growth, and maturation. Plant hormones play a pivotal role in these processes. Prior to pollination, new cell production predominates, with ovary and ovule growth slowing down and gibberellin levels remaining low. For instance, pre-pollination gibberellin levels in pea ovaries are undetectable, while tomato ovaries contain only 0.2 ng/g of fresh weight (García-Martinez et al. 1991; Serrani et al. 2008). Unfertilized tomato ovaries exhibit repressor transcripts of auxin signaling (Serrani et al. 2008). Post-pollination, there is a dramatic shift in hormone levels within the ovary, activating the ovule development program by alleviating ABA inhibition and increasing auxin content (Obroucheva 2014). This leads to enhanced expression levels of Aux/IAA and ARF genes, thereby activating the auxin signaling pathway (Seymour et al. 2013). Following fruit set, as exemplified by tomatoes, auxin synthesis increases along with induced gibberellin accumulation, driving continuous cell division and expansion and ultimately resulting in fruit enlargement (Lemaire-Chamley et al. 2005). Sensory quality attributes such as nutrition, firmness, flavor, and aroma manifest during fruit ripening. Ethylene, a key plant regulatory hormone, influences both climacteric and non-climacteric fruit ripening (Pech et al. 2012). The roles of hormones in fruit development are well established and certain genes mentioned earlier, such as IPT (MELO3C015852, MELO3C021401) and CYP735A (MELO3C022098), may provide valuable insights into fruit shape determination.
Conclusions
In this study, comprehensive transcriptome and metabolome analyses identified a substantial number of differentially expressed genes and metabolites associated with fruit shape. These genes were primarily linked to responses to hormones and other biological processes, particularly in the plant hormone signal transduction pathway, MAPK signaling pathway, and other signaling pathways. Notably, the expression levels of IAA biosynthesis genes, specifically MELO3C035023, MELO3C013512, MELO3C002007, MELO3C013965, MELO3C010272, and MELO3C034758, were significantly elevated in long-horn fruits, playing crucial roles in fruit elongation and growth. Additionally, a machine learning analysis of metabolites revealed that 20 metabolites, including phosphatidylcholine and myristic acid, exhibited significant correlations with fruit length. For the first time, we also discovered that the TOR signaling pathway in melons contributes to fruit growth. Specifically, the fruit pulp of melon T144 exhibited active cell division and elongation, which may contribute to its elongated fruit phenotype.
Supplementary Material
Supplementary materials are available at Horticultural Science and Technology website (https://www.hst-j.org).
- HORT_20260041_Table_S1.xlsx
Supplementary Table S1. Genome-wide gene expression in melon varieties T78 and T144
- HORT_20260041_Table_S2.xlsx
Supplementary Table S2. Expression of YUC and AAO in melon cultivars T78 and T144
- HORT_20260041_Table_S3.xlsx
Supplementary Table S3. List of 550 metabolites identified in the metabolome analysis
- HORT_20260041_Table_S4.xlsx
Supplementary Table S4. A comprehensive list of twenty metabolites linked to fruit morphology identified through the machine learning analysis
- HORT_20260041_Table_S5.xlsx
Supplementary Table S5. The corresponding gene number of CmTOR, CmLST8 and CmRAPTOR in melon, and their expression levels in T78 and T144
- HORT_20260041_Table_S6.xlsx
Supplementary Table S6. Auxin signaling pathway and cytokinin biosynthesis gene in melon and corresponding expression levels in T78 and T144
- HORT_20260041_Table_S7.xlsx
Supplementary Table S7. The corresponding gene numbers of 17 OFP genes in melon and their expression levels in T78 and T144
- HORT_20260041_Fig_S1.pdf
Supplementary Fig. S1. Expression heat maps of auxin signaling pathway genes and cytokinin biosynthesis-related genes in T78 and T144.
