

Introduction
Materials and Methods
Plant materials and tissue sampling
Measurement of quality parameters
Measurements of sucrose, glucose and fructose
Portable Vis/NIR spectroscopy system and spectral acquisition
Spectral preprocessing and development of PLSR models
Statistical analysis
Results
Cluster and berry physical characteristics and skin color
Firmness, TSS, TA and TSS/TA ratio and dry matter content
Soluble sugars
Correlation analysis
Spectral preprocessing to select optimal parameters for PLSR models
Discussion
Conclusion
Introduction
Grapes are among the most widely cultivated and economically important fruit crops worldwide. Among table grape cultivars, ‘Shine Muscat’ (Vitis labruscana Bailey × V. vinifera L.) has attracted considerable attention due to its superior fruit quality and strong consumer preference. This hybrid cultivar is characterized by its yellow-green skin, relatively thin peel, and firm, crisp flesh, along with a distinctive muscat aroma that contributes to its high market value (Chen 2020; Keller 2020). However, unlike red- or black-skinned grape cultivars, ‘Shine Muscat’ grapes exhibit only slight changes in berry skin color during ripening, making visual assessment of fruit maturity difficult (Motonaga et al. 2015).
In grape production, harvest timing is commonly estimated using days after full bloom (DAFB) as a practical indicator of fruit development (Kim et al. 2019). However, seasonal variation in climatic conditions can significantly affect fruit ripening dynamics, reducing the reliability of DAFB as a stand-alone index for determining harvest maturity. In addition to DAFB, destructive measurements of the total soluble solids (TSS) content, titratable acidity (TA), pH, and firmness are widely used to assess grape maturity and determine the optimal harvest stage (Cao et al. 2010; Daniels et al. 2019). However, these conventional methods are labor-intensive, time-consuming, and destructive, limiting their suitability for real-time monitoring and large-scale quality assessments (Nicolai et al. 2007). Therefore, reliable maturity indicators that can be easily evaluated in the field and that accurately represent fruit maturity are needed.
Previous studies have shown that grape peduncles gradually change from green to brown during fruit ripening and maturation and that this color transition is associated with physiological changes related to tissue senescence (Balic et al. 2012; Fang 2014). Because peduncle browning can be readily observed in the field, it may provide a practical indicator for assessing fruit maturity and harvest readiness. Although peduncle browning is closely associated with fruit ripening, its relationship with key quality attributes and its potential as a maturity indicator have not been fully elucidated. In addition, visual assessment alone cannot provide quantitative information pertaining to internal quality attributes such as TSS or the TSS/TA ratio, which are critical parameters for determining harvest readiness and consumer acceptability.
Visible and near-infrared (Vis/NIR) spectroscopy has attracted attention as a rapid and non-destructive technique for assessing internal fruit quality. This approach enables the rapid acquisition of spectral information related to chemical composition and physical properties, and it has been successfully applied to predict TSS and other quality attributes in grapes and other fruits (Carlini et al. 2000; Xiao et al. 2018). Similarly, in apples and peaches, this technique has been applied to predict sugar content, firmness, and internal quality attributes with high accuracy (Nicolai et al. 2007; Nascimento et al. 2016). Furthermore, recent studies have demonstrated that Vis/NIR spectroscopy can effectively model TSS, TA, and pH changes during grape storage, highlighting its potential for use in dynamic quality monitoring (He et al. 2025).
To the best of our knowledge, limited studies have investigated the integration of peduncle browning assessments and portable Vis/NIR spectroscopy for maturity evaluations in 'Shine Muscat' grapes. A better understanding of the physiological and quality changes associated with peduncle browning is required to establish its usefulness as a maturity indicator and to support the development of rapid, nondestructive techniques for maturity evaluation. Therefore, this study aimed to investigate the relationship between peduncle browning and maturity-related physical and chemical quality attributes, and to evaluate the potential of portable Vis/NIR spectroscopy as a complementary nondestructive tool for predicting maturity-related quality attributes associated with peduncle browning.
Materials and Methods
Plant materials and tissue sampling
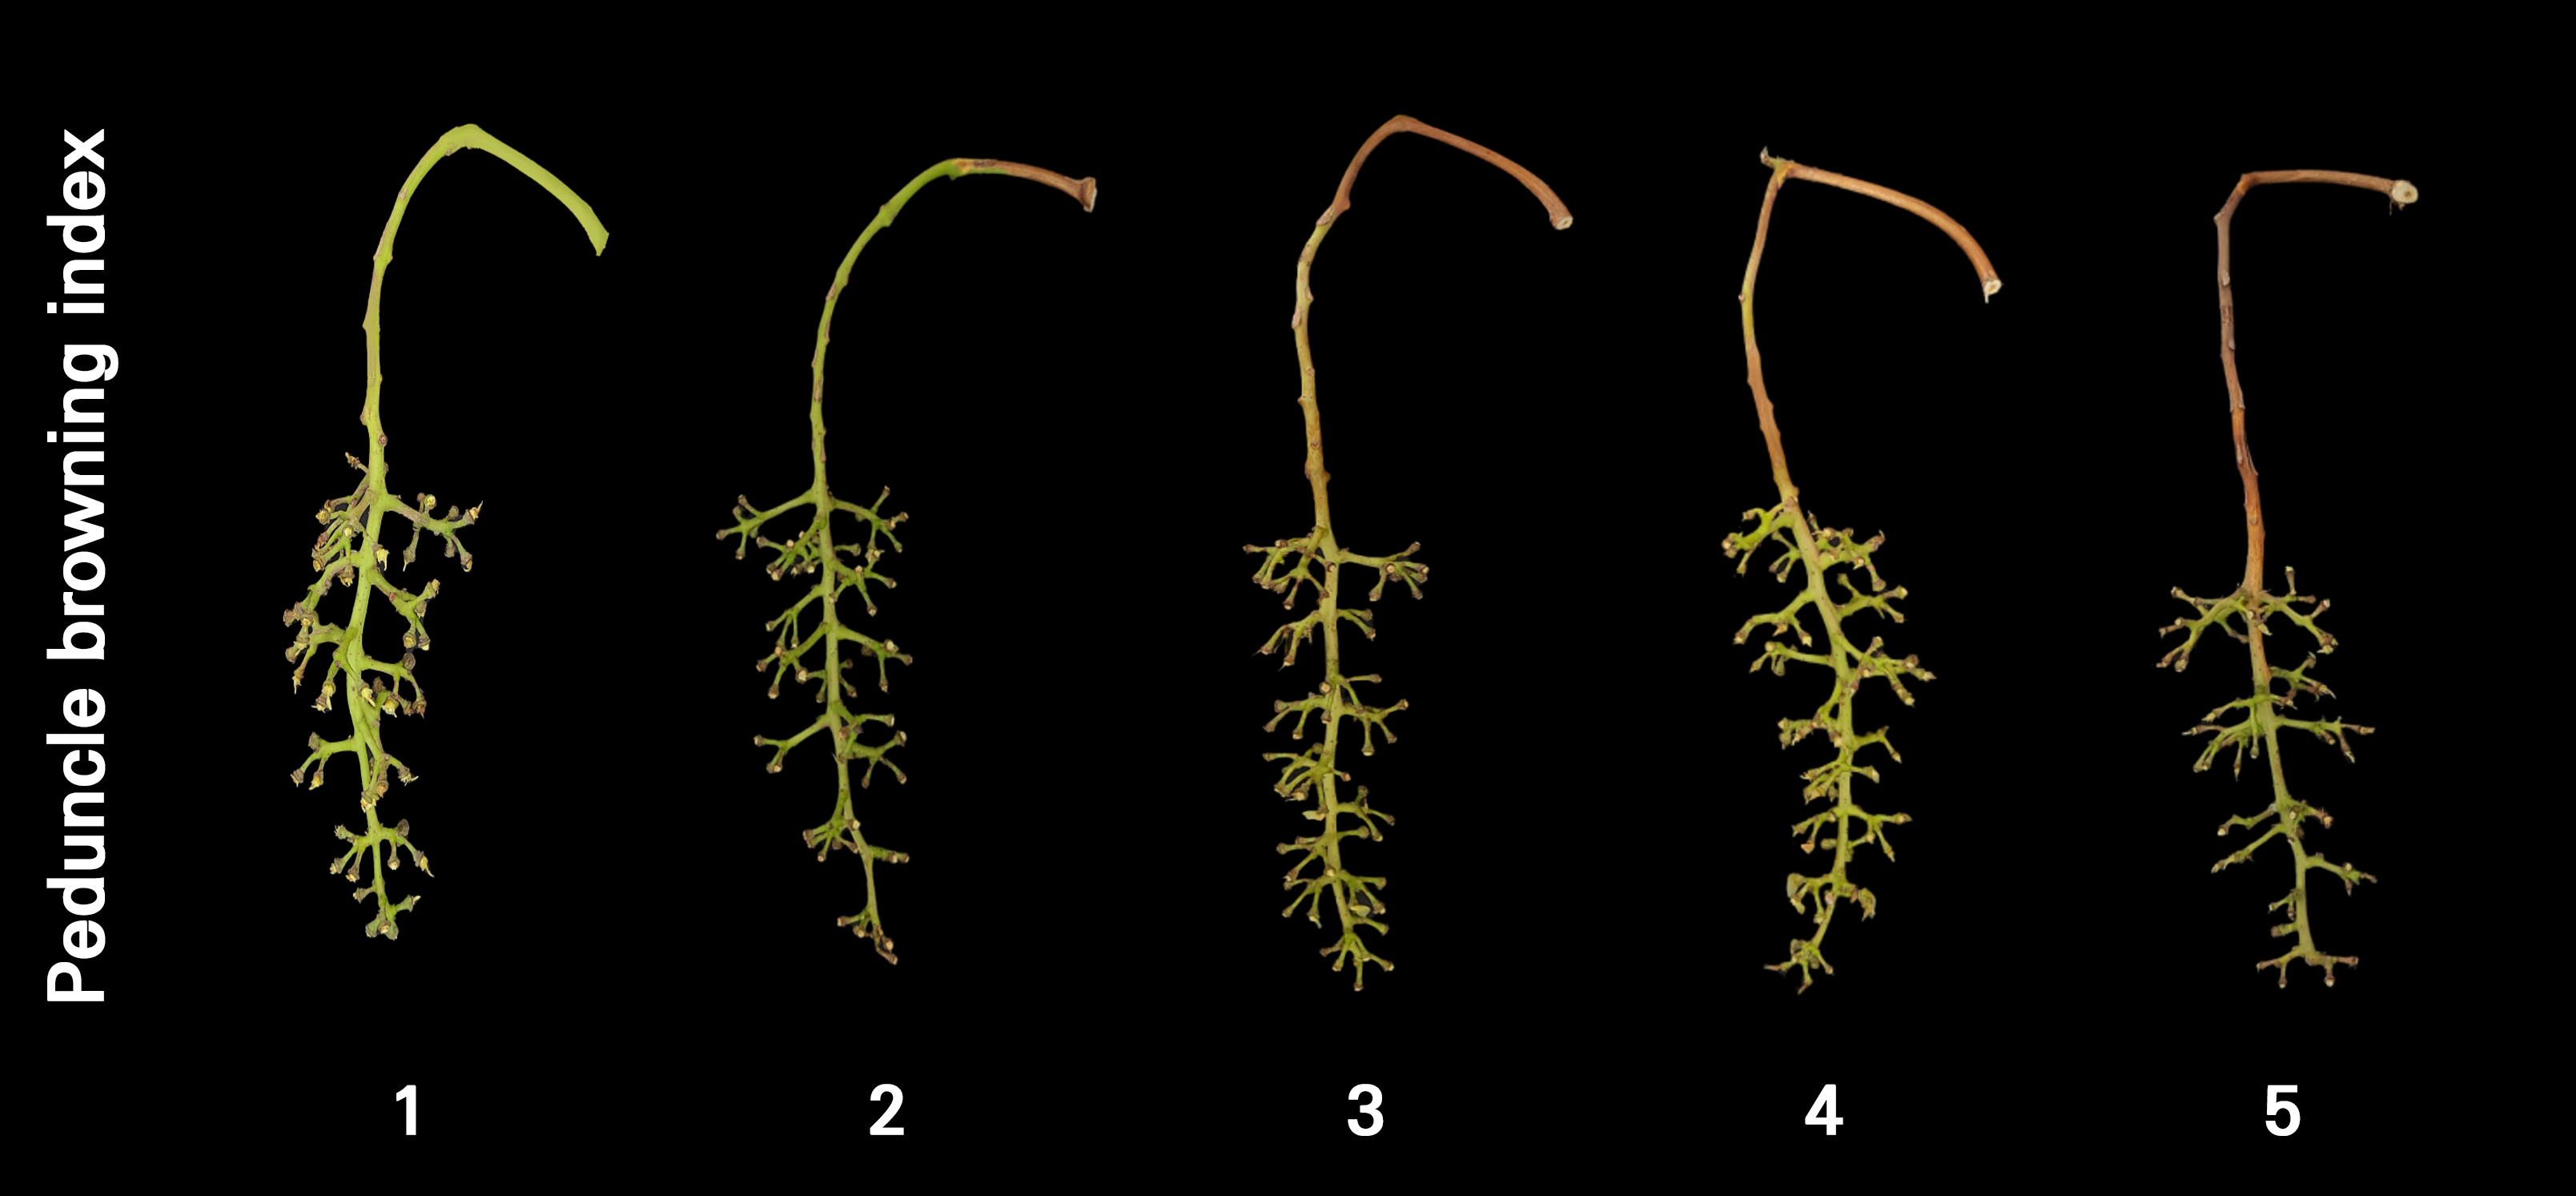
In this study, we used the grape cultivar ‘Shine Muscat’, harvested from Gimcheon-si, Gyeongsangbuk-do, South Korea. Full bloom occurred on May 16, 2024, and vines were subsequently managed following standard commercial cultivation practices. ‘Shine Muscat’ grapes were harvested at 7-day intervals from 89 to 117 days after full bloom (DAFB) and classified into five maturity stages based on the extent of peduncle browning (Fig. 1). Stage 1 exhibited no peduncle browning, and stages 2–5 corresponded to 10–25%, 25–50%, 50–75%, and >75% peduncle browning, respectively. Peduncle browning was visually assessed based on the proportion of the peduncle and rachis surface showing visible brown discoloration relative to the total visible area. All assessments were performed by the same evaluator to ensure consistency during stage classification. Meteorological conditions during the experimental period, in this case the accumulated temperature and rainfall, are presented in Supplementary Fig. S1.
For the quality evaluations in this study, three independent grape clusters were used as biological replicates at each peduncle browning stage, with each cluster considered an experimental unit. Five berries were randomly sampled from each of the upper, middle, and lower portions of each cluster (15 berries per cluster), excluding berries with visible physical damage or abnormal development, and were treated as subsamples. Measurements of berry weight, berry length, berry diameter, color, firmness, total soluble solids (TSS) content, titratable acidity (TA), the TSS/TA ratio, and dry matter content were averaged across the subsampled berries to obtain a single mean value for each cluster. Cluster weight was measured separately for each cluster. Samples were collected at each quality assessment point, and flesh tissue was frozen in liquid nitrogen and kept at ‒80°C until it was used for the free sugars analysis.
Measurement of quality parameters
Cluster weight and berry weight were measured using an electronic balance (HS3000A, HANSUNG, Gwangmyeong, Republic of Korea). Berry length and diameter were determined using a digital caliper (CD-15APX, Mitutoyo Corp., Kawasaki, Japan). Fruit skin color was measured using a CR-400 Chroma Meter (Konica Minolta, Tokyo, Japan), and expressed as Hunter L*, a*, and b* values.
Flesh firmness was determined for each fruit at the middle location on the peeled side using a Fruit Texture Analyzer (Sun Scientific Co. Ltd., Tokyo, Japan) fitted with a 3.0 mm diameter probe. Data are expressed as N. TSS was measured on the expressed juice using a refractometer (3810-E18, Atago Co. Ltd., Tokyo, Japan). The titratable acidity (TA) was measured using a titrator (Mettler DL 12 Titrator, Hightstown, NJ, USA), titrating to pH 8.1 with 0.1 M NaOH from 1 mL of expressed juice. The TSS/TA ratio was calculated as the ratio of the total soluble solids (TSS) content to the titratable acidity (TA). Fresh berry weight was measured before drying, and dry weight was obtained after oven-drying the samples at 100°C in a forced-air oven (WFO-700, EYELA, Tokyo, Japan). Dry matter content is expressed as the percentage of dry weight relative to fresh weight.
Dry matter content (%) = (Dry weight / Fresh weight) × 100
Measurements of sucrose, glucose and fructose
Sucrose, glucose, and fructose contents were determined according to the method of Park et al. (2022). Freeze-dried tissue powder (5 g) was homogenized in 50 mL of distilled water using a homogenizer. The homogenate was centrifuged at 2,000 rpm for 10 min, and the supernatant was filtered through a 0.45 µm membrane filter. The filtrate was analyzed using a HPLC device equipped with a refractive index (RI) detector (Waters 410 Differential Refractometer, Waters, MA, USA) and a Sugar-Pak™ column (6.5 × 300 mm, Waters, USA). The injection volume was 10 µL. Sugars were identified and quantified by external standard calibration using authentic standards of glucose, fructose, and sucrose (Sigma-Aldrich, USA).
Portable Vis/NIR spectroscopy system and spectral acquisition
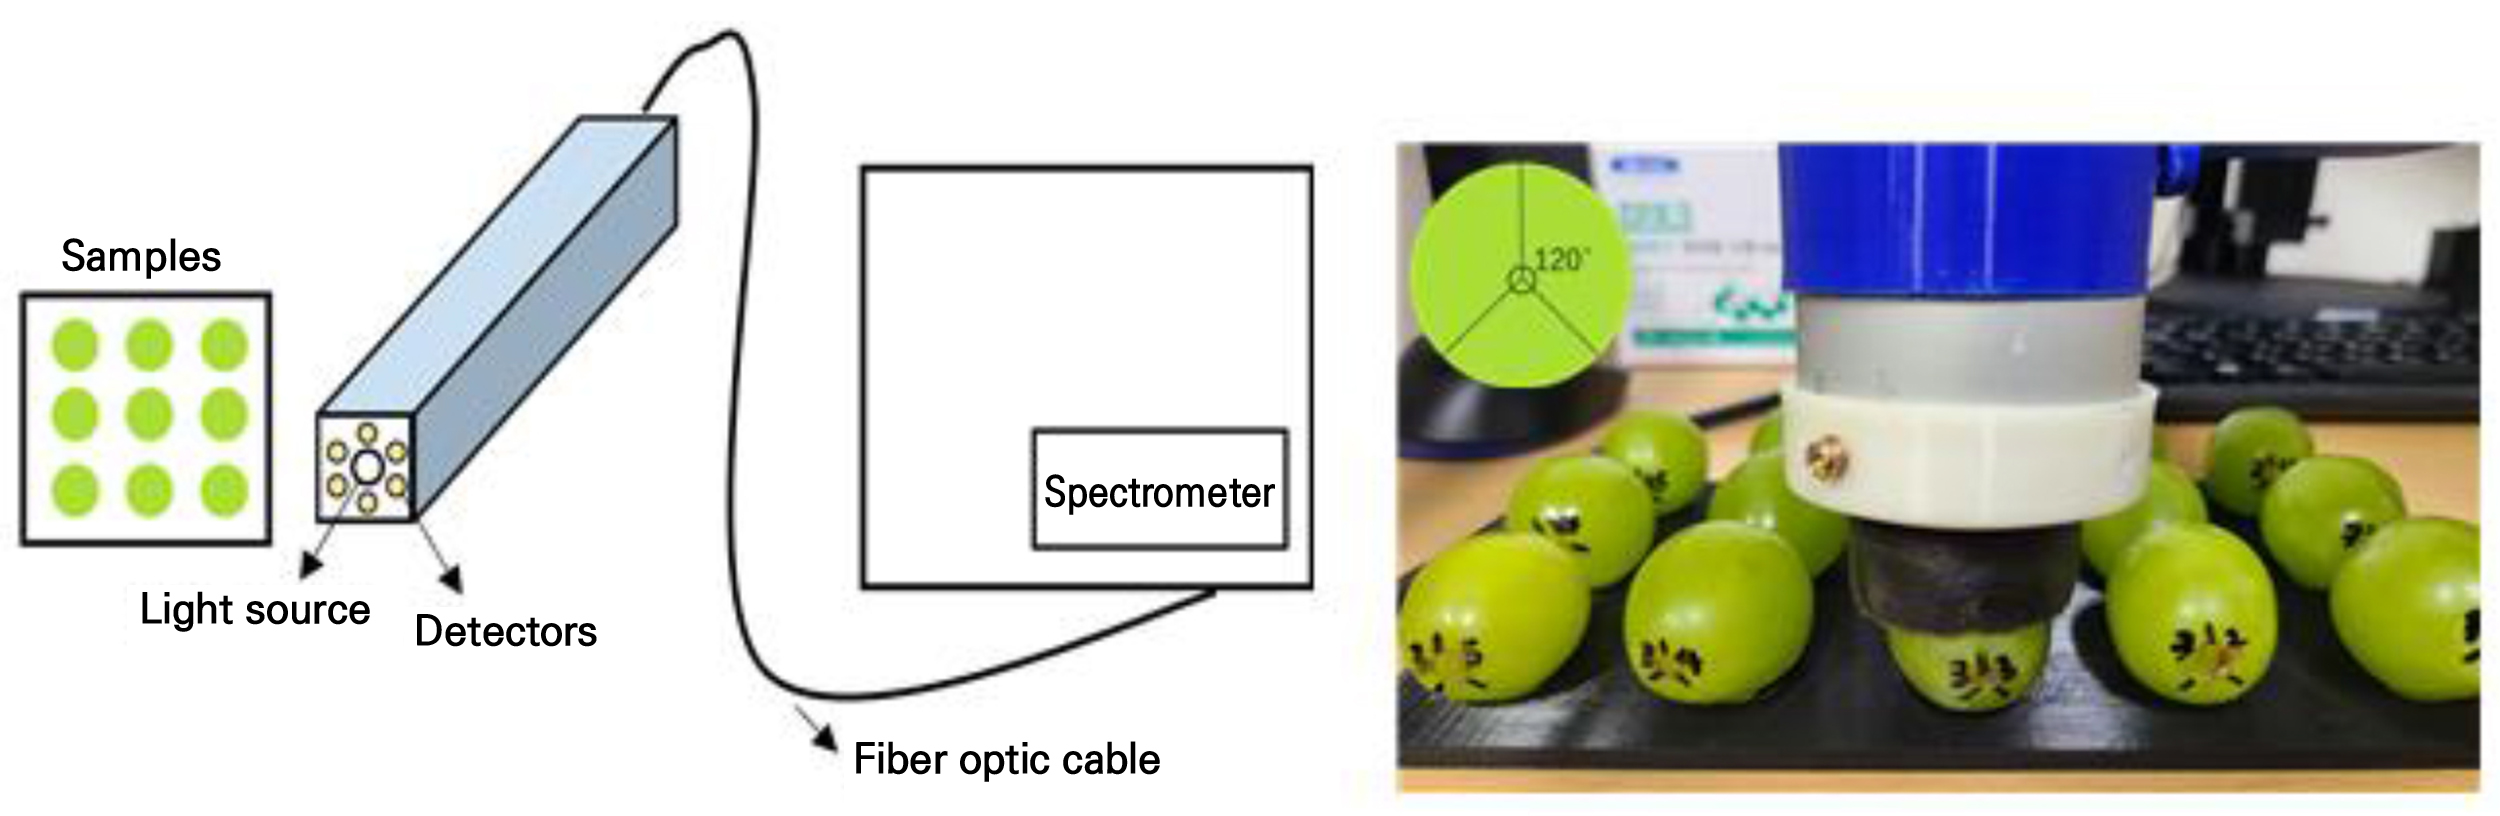
The portable Vis/NIR spectroscopy system and measurement positions used in this study are shown in Fig. 2. The system consisted of a 5 W halogen lamp (64637, OSRAM, Germany) positioned in the same direction as the detector. Reflectance spectra were acquired over the wavelength range of 470–1155 nm at a spectral resolution of 0.16 nm. At each peduncle browning stage, 12 independent grape clusters were used for spectral acquisition, and 15 berries were selected from each cluster, resulting in 180 berries per stage and 900 berries in total. Reflectance spectra were acquired at three equatorial positions approximately 120° apart on each berry, resulting in 540 spectra per stage and 2,700 spectra in total. All measurements were conducted in a dark room to minimize interference from ambient light. The spectra were calibrated using a white reference with 99% reflectance (Spectralon® White Diffuse Reflectance Standard, Edmund Optics, USA) and a dark reference obtained by completely blocking the incident light. The calibrated reflectance spectra were subsequently used for a spectral analysis.
Spectral preprocessing and development of PLSR models
The spectral preprocessing methods evaluated in this study included maximum, range, and mean normalization; standard normal variate (SNV); multiplicative scatter correction (MSC); and first- and second-derivative transformations. All preprocessing procedures were conducted using The Unscrambler® X software (version 10.4, CAMO Software AS, Oslo, Norway). The preprocessed spectra were used to develop partial least squares regression (PLSR) models for predicting the total soluble solids (TSS) content and the TSS/TA ratio. The dataset was randomly divided into calibration (70%) and prediction (30%) sets at the berry level. Individual berries were randomly assigned to either the calibration or prediction set, and all three spectra acquired from the same berry were retained within the same dataset to ensure that spectra from a single biological sample were not shared between the calibration and prediction sets. Calibration models were developed using the calibration set with 20-fold cross-validation, and their predictive performance capabilities were subsequently evaluated using the independent prediction set. The optimal number of latent variables (LVs) was determined based on the minimum RMSEV obtained from 20-fold cross-validation, while avoiding additional LVs that did not further improve model performance. No wavelength selection or additional dimensionality reduction was performed, and the full spectral range (470–1155 nm) was used for model development after spectral preprocessing. No spectra were excluded as outliers prior to model construction. Model performance was evaluated using the coefficients of determination for calibration (Rc2), validation (Rv2), and prediction (Rp2), as well as the root mean square errors of calibration (RMSEC), validation (RMSEV), and prediction (RMSEP).
Statistical analysis
Statistical analyses were performed using SPSS version 26.0 (IBM Corp., Armonk, NY, USA). Differences among peduncle browning stages were evaluated by means of a one-way analysis of variance (ANOVA), and mean separation was conducted using Duncan's multiple range test at p < 0.05. The collected parameters were correlated via Pearson's correlation testing.
Results
Cluster and berry physical characteristics and skin color
Significant differences in the cluster weight, berry weight, berry length, and berry diameter were observed among the peduncle browning stages (Table 1). Cluster weight tended to increase as peduncle browning progressed, reaching its highest value at stage 4. Berry weight and size generally increased up to stage 3. Significant differences in berry skin color parameters were observed among the peduncle browning stages (Table 1). Hunter L* values gradually decreased as peduncle browning progressed from stage 1 to stage 5. In contrast, Hunter a* values increased, whereas Hunter b* values decreased as browning progressed. Notably, changes in color parameters were more pronounced during the early stages of browning (stages 1–3) than during the later stages (stages 4–5).
Table 1.
Cluster weight, berry weight, length, diameter, and Hunter L*, a*, b* values of ‘Shine Muscat’ grapes harvested at different peduncle browning stages. Data represent the mean ± SE (n = 3). Different letters indicate a significant difference between peduncle browning stages at p
5
Firmness, TSS, TA and TSS/TA ratio and dry matter content
Firmness and TA gradually decreased as peduncle browning proceeded (Figs. 3A and 3B). In contrast, the total soluble solids content, TSS/TA ratio, and dry matter content increased as peduncle browning proceeded (Figs. 3C, 3D and 3E). Notably, the magnitude of the changes was more pronounced during the early stages of browning (stages 1 to 3) than during the later stages (stages 4 to 5), particularly for firmness and TA.
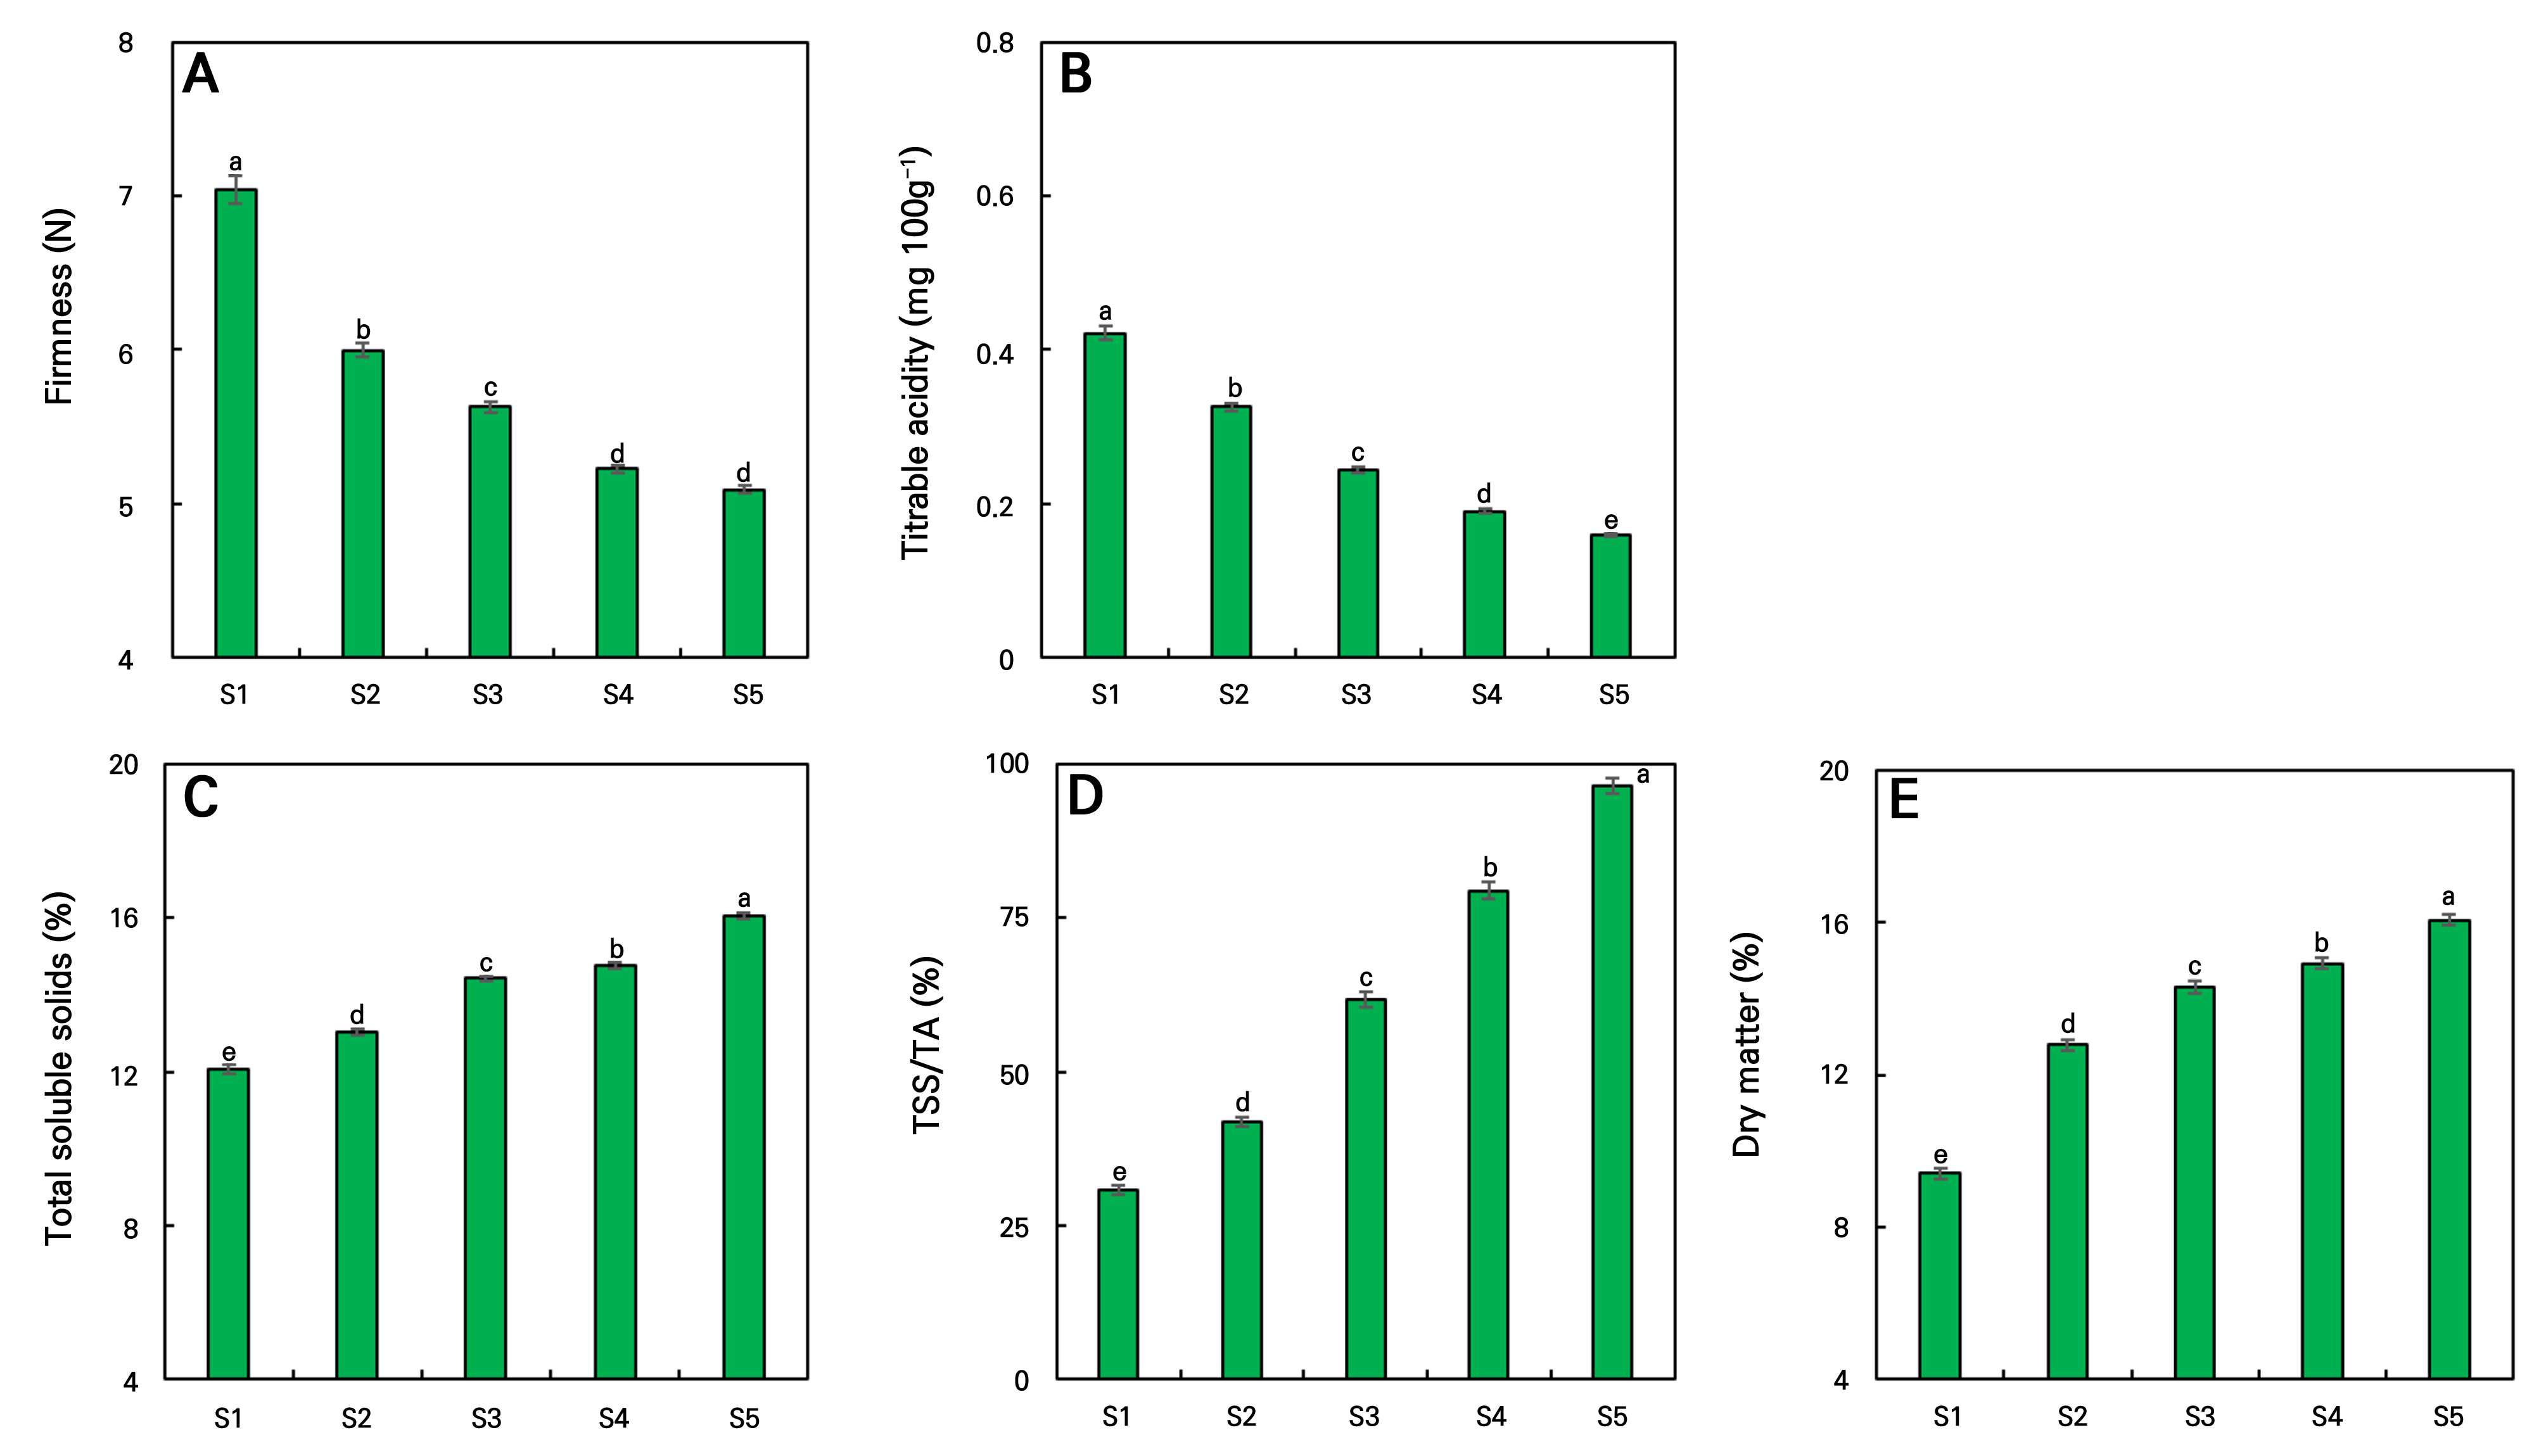
Fig. 3.
Firmness, titratable acidity (TA), the total soluble solids (TSS) content, TSS/TA ratio and dry matter content of ‘Shine Muscat’ grapes harvested at different peduncle browning stages. Data represent the mean ± SE (n = 3). Different letters indicate significant differences between peduncle browning stages at p < 0.05.
Soluble sugars
Significant differences in glucose and fructose contents were observed in both the skin and pulp among peduncle browning stages (Table 2). The Glucose content in the skin increased during the early stages of peduncle browning, reaching the highest levels at stages 3 and 4, and subsequently decreased at stage 5. In the pulp, the glucose content was highest at stages 2 and 3 and gradually decreased during the later stages. In contrast, the fructose content generally increased as peduncle browning proceeded in both the skin and pulp, with the highest levels observed at stage 5 in the skin and at stages 4 and 5 in the pulp (Table 2). The total soluble sugar content generally increased as peduncle browning advanced, reaching the highest levels at stages 4 and 5 in both the skin and pulp. Sucrose was not detected in any sample at any peduncle browning stage under the analytical conditions used in this study.
Table 2.
Glucose, fructose, and total soluble sugar contents in the skin and pulp of ‘Shine Muscat’ grapes harvested at different peduncle browning stages. Data represent the mean ± SE (n = 3). Different letters within each column indicate significant differences among peduncle browning stages at p
5. Sugar contents are expressed on a dry weight (DW) basis
Correlation analysis
The Pearson correlation analysis revealed significant relationships among advancing peduncle browning stage and fruit quality (Fig. 4). The browning stage was positively correlated with advancing dry matter content, total soluble solids content, and the TSS/TA ratio, whereas it was negatively correlated with firmness and titratable acidity. In addition, strong positive correlations were observed between advancing total soluble solids content and the TSS/TA ratio, while titratable acidity was negatively correlated with both variables. These results indicate that peduncle browning was closely associated with sugar accumulation, acid degradation, and fruit softening. Based on these relationships, TSS and the TSS/TA ratio were selected as target quality attributes for developing Vis/NIR-based nondestructive prediction models.
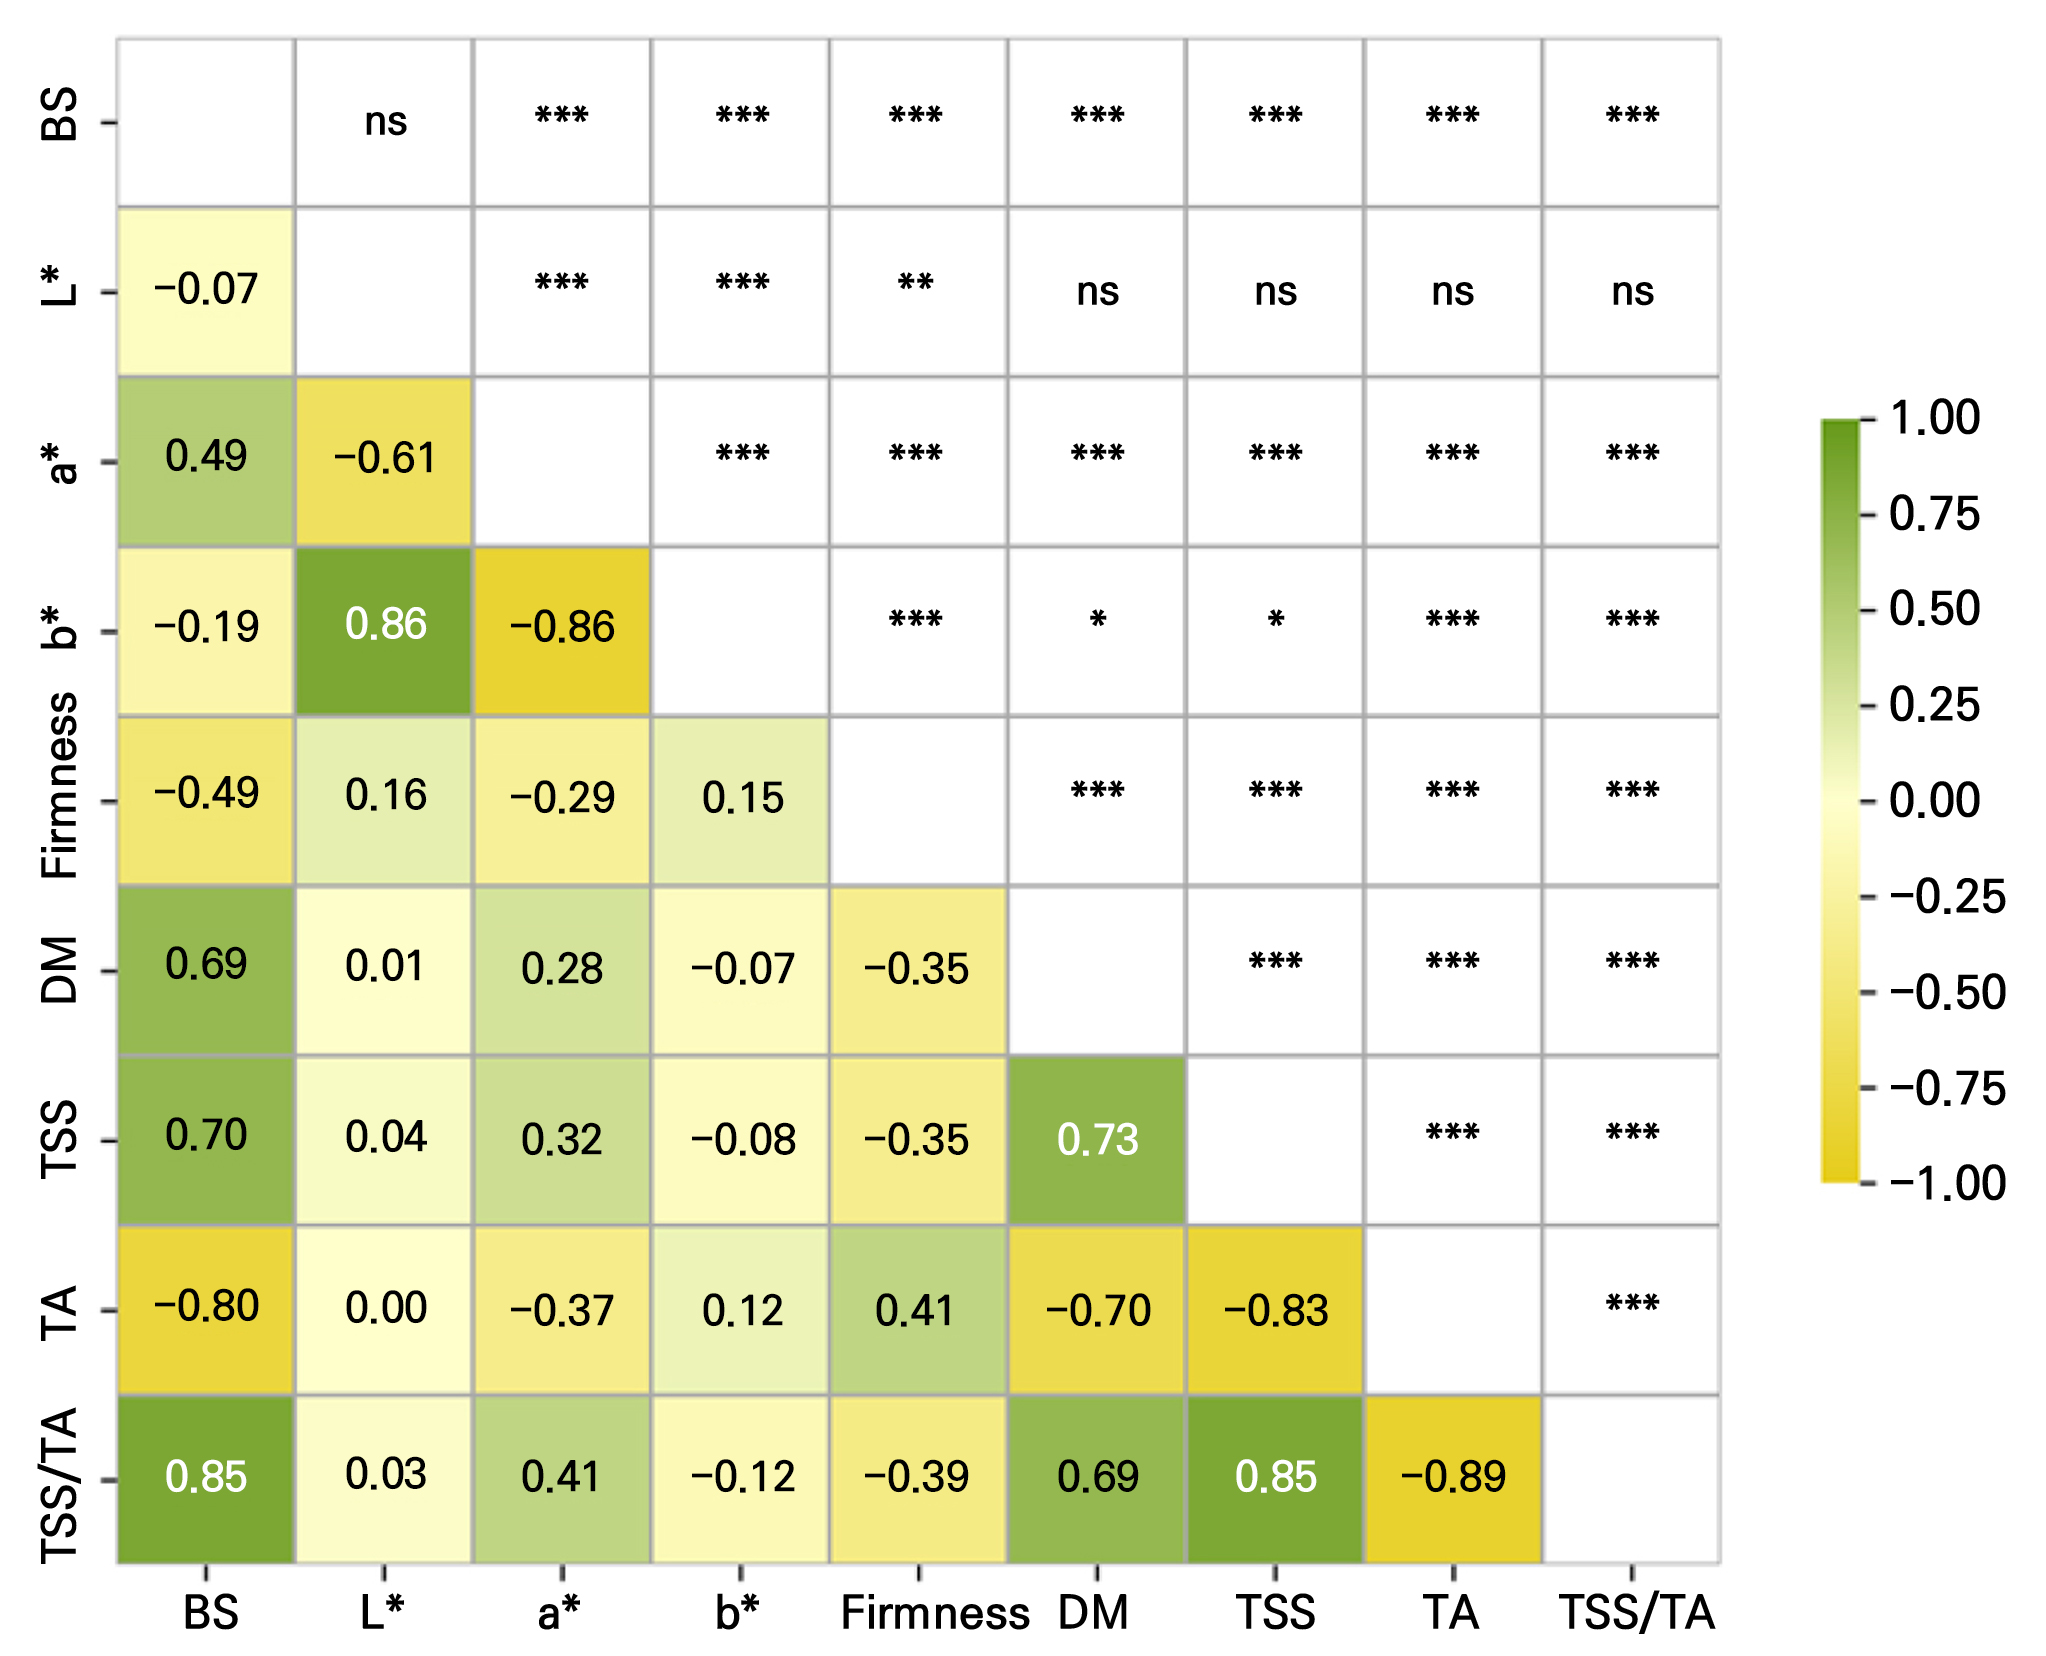
Fig. 4.
Pearson correlation coefficient (r) heat maps for Hunter L*, a*, b*, firmness, dry matter (DM), the total soluble solids (TSS) content, titratable acidity (TA), and the TSS/TA ratio of ‘Shine Muscat’ grapes harvested at different peduncle browning stages. Green and yellow colors represent positive and negative correlations between factors. BS stands for browning stages. *, 42, and 42* indicate significant correlations at p < 0.05, p < 0.01, and p < 0.001, respectively, and ns indicates a nonsignificant correlation (p > 0.05).
Spectral preprocessing to select optimal parameters for PLSR models
Figures 5A and 5D show the average Vis/NIR spectra of Shine Muscat grapes grouped according to the TSS level. Although the spectral profiles exhibited similar overall patterns, differences in the reflectance intensity were observed across the TSS groups, particularly in the 700–900 nm region.
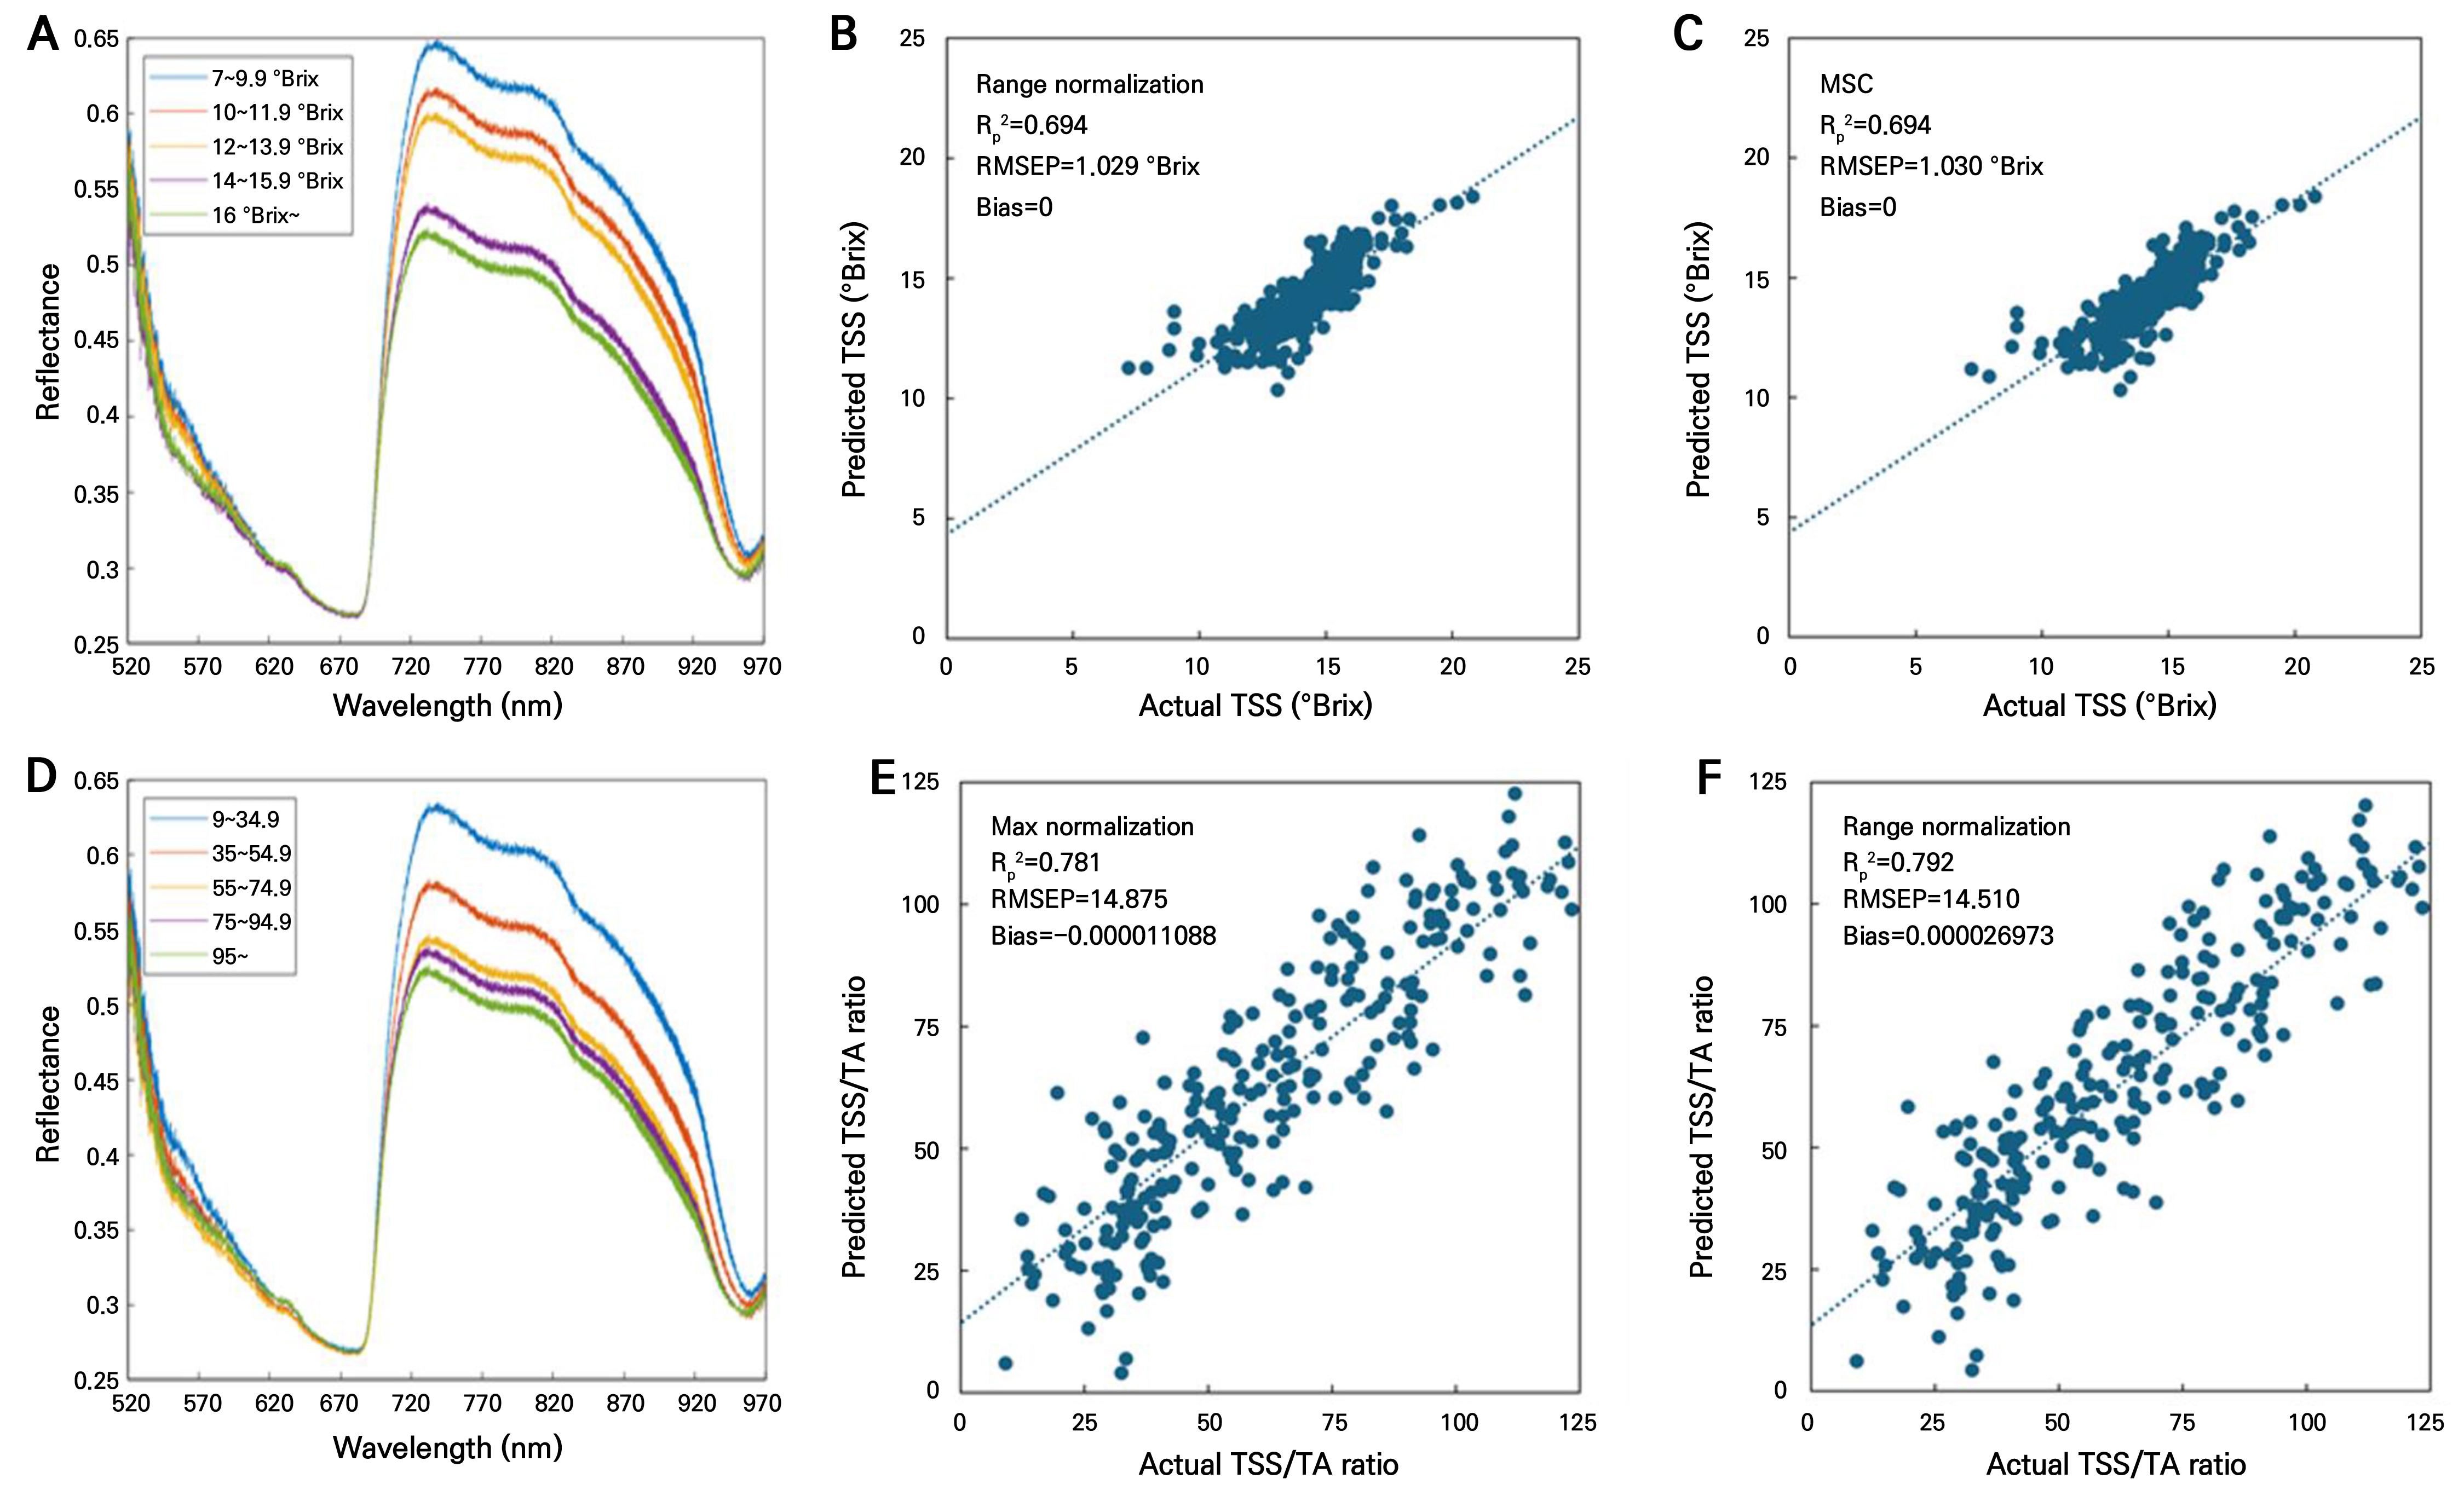
The descriptive statistics of the calibration and prediction datasets are summarized in Table 3. The calibration and prediction datasets exhibited similar distributions for both TSS and the TSS/TA ratio, with comparable mean values, ranges, and standard deviations, indicating that both datasets were suitable for subsequent PLSR model development. To improve the prediction performance, raw spectra were preprocessed using maximum normalization, range normalization, mean normalization, standard normal variate (SNV), multiplicative scatter correction (MSC), and first- and second-order Savitzky–Golay derivatives. The preprocessing methods were compared based on the coefficient of determination (R2) and the root mean square error (RMSE), and the optimal models are summarized in Table 4. Among the tested preprocessing techniques, range normalization and MSC exhibited comparable prediction performance for TSS, whereas range normalization yielded the best performance for predicting the TSS/TA ratio.
Table 3.
Total soluble solids (TSS) content and TSS/TA ratio of ‘Shine Muscat’ grapes for calibration and prediction sets
Table 4.
Performance comparison of PLSR models for predicting TSS and the TSS/TA ratio in ‘Shine Muscat’ grapes based on different spectrum preprocessing methods
For TSS prediction, the PLSR models developed using range normalization and MSC preprocessing exhibited comparable predictive performance, with identical Rp2 values of 0.694 and RMSEP values of 1.029 and 1.030 °Brix, respectively (Table 4). Regarding the prediction of the TSS/TA ratio, the optimal PLSR model was obtained using range normalization preprocessing with eight latent variables. The model achieved Rc2, Rv2, and Rp2 values of 0.802, 0.703, and 0.792, respectively, with RMSEC, RMSEV, and RMSEP values of 14.167, 17.405, and 14.510. Compared with the TSS model, the TSS/TA ratio model exhibited higher coefficients of determination in both validation and prediction sets, indicating a stronger relationship between spectral information and maturity-related changes represented by the TSS/TA ratio (Figs. 5E and 5F).
Discussion
The progression of peduncle browning was closely associated with changes in berry physical and chemical characteristics that are typically observed during fruit ripening in ‘Shine Muscat’ grapes. Berry weight, berry size, skin color, soluble sugars, the dry matter content, and the TSS/TA ratio increased with advancing browning stages, whereas firmness and titratable acidity gradually declined. These changes are consistent with the well-established physiological progression of grape berry ripening, during which sugars accumulate, organic acids are metabolized, and fruit texture gradually softens (Conde et al. 2007; Keller 2020). The close relationships identified by the Pearson correlation analysis further indicate that peduncle browning is associated with maturity-related quality attributes, supporting its potential as a practical visual indicator of fruit maturity.
The reduction in Hunter L* and b* values accompanied by an increase in Hunter a* values indicates that measurable changes in berry surface color occur during peduncle browning progression, despite the fact that ‘Shine Muscat’ exhibits relatively limited visual skin color changes compared with red or black table grape cultivars. This finding is in good agreement with Mehretie et al. (2024), who reported that external color characteristics remain useful for maturity evaluation despite the subtle color development of this cultivar.
In grape berries, sucrose transported through the phloem is rapidly hydrolyzed into glucose and fructose by invertase enzymes during ripening. Consequently, mature grape berries predominantly contain glucose and fructose, while sucrose is generally present at low concentrations or remains undetectable (Conde et al. 2007; Dai et al. 2011). In contrast, the decline in titratable acidity observed with an increase in browning severity is consistent with the utilization and degradation of organic acids during ripening (Keller 2020). Berry softening during maturation has been associated with modifications of the cell wall structure and reduced cell-to-cell adhesion (Brummell and Harpster 2001).
Collectively, these results indicate that peduncle browning is closely associated with physiological fruit maturation and may therefore serve as a practical visual indicator of harvest maturity. However, visual assessment alone cannot provide quantitative information on internal fruit quality attributes such as TSS and the TSS/TA ratio, which are important indicators of eating quality and harvest readiness. During fruit maturation, changes in the chemical composition and tissue structure alter the absorption and scattering characteristics of Vis/NIR spectra, providing the basis for nondestructive estimations of the internal fruit quality. Therefore, PLSR models were developed to evaluate the potential of portable Vis/NIR spectroscopy for predicting maturity-related quality attributes in ‘Shine Muscat’ grapes and to complement visual maturity assessment efforts.
Among the preprocessing methods evaluated, range normalization and MSC exhibited comparable prediction performance for TSS. MSC is widely used to minimize scattering effects caused by differences in sample surface characteristics, thereby improving the relationship between spectral information and fruit quality attributes (Geladi et al. 1985; Isaksson and Næs 1988). Similar improvements in prediction accuracy outcomes following MSC preprocessing have been reported in Vis/NIR studies of grapes and other horticultural products (Cen and He, 2007).
The optimal PLSR model for TSS achieved an Rp2 value of 0.694 and an RMSEP value of 1.03 °Brix, indicating moderate predictive performance. Similar prediction accuracy rates were found in previous studies using Vis/NIR spectroscopy for nondestructive assessments of grape maturity and the soluble solids content, suggesting that spectral information can effectively capture changes associated with sugar accumulation during ripening (Ping et al. 2023; Mehretie et al. 2024).
Notably, the TSS/TA ratio model exhibited higher predictive accuracy than the TSS model, with an Rp2 of 0.792. The TSS/TA ratio reflects the combined effects of sugar accumulation and organic acid degradation, which are the primary biochemical processes occurring during grape berry maturation. Therefore, this parameter may provide a more comprehensive representation of fruit maturity than TSS alone. Similar findings have been reported in recent studies, where maturity indices integrating multiple quality attributes showed stronger relationships with spectral information than individual compositional parameters (Daniels et al. 2019; Mehretie et al. 2024). Previous studies of grape maturity primarily focused on conventional physicochemical indices or non-destructive predictions of individual quality attributes. In contrast, the present study integrates progressive peduncle browning with changes in fruit quality attributes and Vis/NIR-based predictions of TSS and the TSS/TA ratio. This combined approach links an easily observable external characteristic with a non-destructive assessment of internal fruit quality and provides a practical framework for evaluating maturity-related quality changes in ‘Shine Muscat’ grapes. Despite the advances here, further validation using independent datasets collected across different seasons, harvest batches, and production locations will be necessary to evaluate the robustness and broader transferability of the models.
Collectively, these findings suggest that peduncle browning provides a rapid visual indication of fruit maturity, whereas portable Vis/NIR spectroscopy offers objective estimations of maturity-related quality attributes. The complementary use of these two approaches may support more reliable harvest timing and quality management of commercial ‘Shine Muscat’ grapes.
Conclusion
This study demonstrated that peduncle browning was closely associated with maturity-related changes in ‘Shine Muscat’ grapes, including sugar accumulation, acid degradation, fruit softening, and skin color development. These findings indicate that peduncle browning can serve as a practical visual indicator of fruit maturity. Furthermore, Vis/NIR spectroscopy combined with PLSR enabled nondestructive predictions of TSS and the TSS/TA ratio, with higher predictive performance observed for the TSS/TA ratio. Overall, the results highlight the potential of Vis/NIR spectroscopy as a rapid and nondestructive tool for estimating key maturity-related quality attributes. The integration of peduncle browning assessment with spectroscopic techniques may contribute to improved harvest timing decisions and more efficient quality management of ‘Shine Muscat’ grapes during production and postharvest handling.
Supplementary Material
Supplementary materials are available at Horticultural Science and Technology website (https://www.hst-j.org).
- HORT_20260042_Fig_S1.docx
Supplementary Fig. S1. Meteorological conditions during the growing season of ‘Shine Muscat’ grapes. (A) Monthly mean temperature and (B) accumulated temperature and monthly accumulated rainfall from March to September 2024.
