

Introduction
Materials and Methods
Plant materials
Fruit quality analysis
Primary metabolite analysis
VOC analysis
Statistical analysis
Results
Representative fruit appearance
Physicochemical characteristics
CIE color characteristics
Primary metabolite profiles
VOC profiles and representative compounds
Dataset-level multivariate comparison of analytical profiles
Discussion
Cultivar-dependent variations in fruit-quality traits
TD-GC-MS-based VOC profiles and cultivar-associated variations
Integration of quality traits and VOC profiles improves cultivar characterization
Limitations and implications for cultivar characterization
Conclusion
Introduction
Peach (Prunus persica L.) is valued as a fresh fruit because sweetness, acidity, texture, appearance, and aroma all contribute to eating quality (Kader 2008). These traits are perceived together during consumption. For example, sweetness is influenced not only by SSC, but also by acidity and fruit texture. Previous studies focusing on peaches and nectarines have reported that the sugar-acid balance is closely associated with consumer acceptance, while firmness and peel color are important for maturity evaluation and marketability (Colaric et al. 2005; Crisosto and Crisosto 2005). Fruit weight, SSC, TA, firmness, and peel color are commonly measured when peach fruit quality levels are evaluated. These measurements are simple and reproducible and are therefore useful for routine quality assessments. The same traits are also widely used to monitor quality changes during postharvest storage and to evaluate the effectiveness of storage treatments (Pervitasari et al. 2021; Liu et al. 2024). However, they do not always explain differences in fruit chemical compositions among cultivars. Fruits with similar SSC values may still differ in terms of their individual sugars, sugar alcohols, organic acids, and amino acids, all of which contribute to taste and reflect differences in cultivar- and maturity-related fruit metabolism (Wu et al. 2005; Desnoues et al. 2014; Cirilli et al. 2016).
Previous metabolomic studies have reported genotype- or cultivar-dependent variations in peach primary metabolites, showing that the metabolite composition provides information beyond conventional quality measurements (Desnoues et al. 2014; Cirilli et al. 2016; Baccichet et al. 2021). Aroma-related volatile compounds are another important component of peach fruit quality. Peach fruits contain various VOCs, including esters, aldehydes, alcohols, terpenes, lactones, and fatty acid derivatives (Horvat et al. 1990; Aubert and Milhet 2007; Sánchez et al. 2012). These compounds are produced through several metabolic pathways, and their abundance can vary markedly among cultivars. VOC profiles have been used to distinguish peach cultivars and to describe cultivar-associated aroma variations (Eduardo et al. 2013; Mohammed et al. 2021; Wang et al. 2023). Because the volatile composition of peaches is produced by a mixture of compounds from multiple pathways, VOC profiling may reveal cultivar-associated differences that are difficult to detect if using SSC, acidity, or firmness alone.
Although fruit-quality traits, primary metabolites, and VOCs have each been studied in peach, they are often analyzed separately. For newly bred cultivars, it is useful to determine which dataset most clearly reflects differences within a given experimental set and whether combining datasets broadens cultivar characterization. In particular, newly bred cultivars may exhibit only small differences in conventional quality traits such as SSC, making separation based on routine measurements alone difficult. We hypothesized that when SSC values are similar among cultivars, primary metabolite and TD-GC-MS-based VOC profiles would provide additional information for cultivar-associated characterization and that combining routine quality traits with VOC information would provide complementary dataset-level information. However, because cultivar, fruit maturity, and prior postharvest handling were confounded in this distribution-center sample set, any observed differences were expected to reflect their combined effects rather than cultivar-specific traits alone. Therefore, in this study, three newly bred peach cultivars were analyzed using routine fruit-quality traits, primary metabolite profiles, and TD-GC-MS-based VOC profiles. The exploratory separation performance of each dataset was compared, and the effect of combining fruit-quality traits with VOC information was evaluated. Because the fruits were obtained from distribution centers in a single season, the conclusions are restricted to the tested sample set and should be validated across additional production years, growing environments, and postharvest histories.
Materials and Methods
Plant materials
Three newly bred peach cultivars, ‘Hwanggwibi’, ‘Seola’, and ‘Yanghongjang’, were used in this study. ‘Hwanggwibi’ and ‘Yanghongjang’ fruits were obtained through an agricultural product distribution center in Eumseong, Republic of Korea, and ‘Seola’ fruits were obtained through an agricultural product distribution center in Jeonju, Republic of Korea. Because the fruits were obtained through distribution centers rather than directly from farms, orchard-level production sites, exact harvest dates, and pre-distribution storage and handling histories were not fully available. Therefore, the dates of receipt at the institute were recorded as sample acquisition dates and should not be interpreted as harvest dates. ‘Hwanggwibi’, ‘Yanghongjang’, and ‘Seola’ were received on September 3, September 16, and October 26, 2025, respectively. Fruits were received as commercially marketed fruit. Fruits of similar sizes and with similar external coloration were selected, and damaged fruits were removed before the analysis. After receipt, fruits were temporarily held in a 5°C cold room only until sample preparation for each cultivar. Immediately before the fruit-quality measurements, primary metabolite analysis, and VOC collection, fruits were equilibrated at approximately 20°C for 1 d. No storage-period comparison or storage treatment was conducted in this study; all measurements were performed at a single analytical sampling point after pre-analysis equilibration. Because preharvest and pre-distribution postharvest histories were not fully controlled, the interpretation of metabolite and VOC data was restricted to this single-season distribution-center sample set.
Fruit quality analysis
Fruit weight, SSC, TA, peel color, and firmness were measured for each cultivar. Fruit weight was measured using an electronic balance (BCH-600, Hansung Instruments Co., Ltd., Gwangmyeong, Republic of Korea). Peach flesh juice was extracted using a fruit juicer (FruX80, Goojung ENT Co., Ltd., Seoul, Republic of Korea), and SSC and TA were determined using a refractometer-acidity meter (PAL-BX|ACID F5, Atago Co., Ltd., Tokyo, Japan). The SSC/TA ratio was calculated by dividing SSC by TA. Peel color was measured at two equatorial positions of each fruit using a chroma meter (CR-400, Konica Minolta, Inc., Tokyo, Japan) and recorded as CIE L*, a*, and b* values. Chroma was calculated as C* = (a*2 + b*2)1/2, and hue angle was calculated using the four-quadrant arctangent function, h° = atan2 (b*, a*), and is expressed in degrees. Firmness was measured at two equatorial positions using a texture analyzer (TAplus, Lloyd Instruments Ltd., England; AMETEK, Inc., Berwyn, PA, USA) equipped with an 8-mm-diameter cylindrical probe. The test speed, trigger force, and depression limit were set to 2.5 mm s‒1, 0.98 N, and 10 mm, respectively.
Primary metabolite analysis
The primary metabolite analysis was performed as previously described, with minor modifications (Lisec et al. 2006; Ko et al. 2025). Peach flesh juice was prepared from mesocarp tissue only. For each biological replicate, flesh juice from three fruits was pooled, immediately frozen, and stored at ‒80°C until analysis. Samples were thawed once before extraction. The frozen peach juice sample (50 µL) in each case was transferred to a 2-mL screw-cap tube and extracted with 1.4 mL of cold methanol containing 20 µL of a ribitol solution as an internal standard (10 mg mL‒1 in water; equivalent to 200 µg per sample). The mixture was shaken at 800 rpm for 10 min at 70°C and then centrifuged at 10,000 × g for 3 min. The supernatant (700 µL) was transferred to a centrifugable glass vial, mixed with 375 µL of cold chloroform and 700 µL of cold water, vortexed for 10 s, and centrifuged at 10,000 × g for 3 min. The upper polar phase was collected for a water-soluble metabolite analysis. An aliquot of the polar phase (50 µL) was transferred to a 1.5-mL tube and dried using a centrifugal evaporator at 30°C for 20–30 min. To ensure complete dehydration, 20 µL of methanol was added to the dried residue, and the sample was dried again. For methoximation, the dried extract was mixed with 50 µL of methoxyamine hydrochloride in pyridine (40 mg mL‒1) and incubated at 800 rpm for 90 min at 37°C. For trimethylsilylation, 80 µL of N-methyl-N-(trimethylsilyl)trifluoroacetamide (MSTFA) was added and the mixture was incubated at 800 rpm for 20 min at 50°C. Derivatized metabolites were analyzed using a GCMS-QP2020 NX system (Shimadzu, Kyoto, Japan) equipped with a DB-5MS column (30 m × 0.25 mm i.d., 0.25 µm film thickness). The injection volume was 1 µL. Samples were injected in split mode at a split ratio of 10:1. The injector temperature was maintained at 250°C. Helium was used as the carrier gas, with a column flow rate of 1.20 mL min‒1 and a linear velocity of 40.4 cm s‒1. The column oven temperature was initially held at 35°C for 2 min, increased to 120°C at 8°C min‒1, then increased to 280°C at 17°C min‒1, and held for 1 min. The total run time was 23.04 min. The ion source and interface temperatures were both maintained at 250°C. Mass spectra were acquired in scan mode over an m/z range of 40–400 with a solvent cut time of 1 min, an event time of 0.30 s, and a scan speed of 1250. Metabolites were tentatively identified through a similarity search using the NIST 21 Mass Spectral Library and reference information. Retention index-based identification was not performed for primary metabolite analysis. Peak areas were normalized to the ribitol internal standard, and the normalized data were autoscaled before the multivariate analysis. PLS-DA and VIP analyses were conducted with MetaboAnalyst 6.0 (Pang et al. 2024).
VOC analysis
Headspace VOCs were collected using conditioned Tenax TA thermal desorption tubes. For each biological replicate, four fruits with a total mass of approximately 1200–1300 g were placed in an 8-L sealed stainless-steel container and equilibrated for 30 min (Ju et al. 2025). Four biological replicates were analyzed per cultivar. After equilibration, headspace air was drawn through the tubes at 0.5 L min‒1 for 10 min using a portable air sampling pump (MP-Σ500NII, Sibata Scientific Technology Ltd., Saitama, Japan). The collected VOCs were analyzed using a TD-100xr thermal desorption system (Markes International Ltd., Llantrisant, UK) coupled with a GCMS-QP2020 NX system (Shimadzu, Kyoto, Japan). The split ratio for the TD-GC-MS analysis was 20:1. Chromatographic separation was performed on a DB-5MS column (30 m × 0.25 mm i.d., 0.25 µm film thickness). The oven temperature was held at 35°C for 5 min, increased to 300°C at 10°C min‒1, and maintained for 2 min. Peak detection and integration were performed using LabSolutions GCMS software (Shimadzu). Compounds were tentatively identified via a similarity search using the NIST 21 Mass Spectral Library. Selected compounds used for biological interpretation were further verified using authentic standards analyzed under the same conditions. D-limonene, 2-ethyl-1-hexanol, and acetic acid were presented as representative standard-confirmed VOCs because they showed significant cultivar-dependent differences according to an ANOVA followed by Tukey’s HSD test. Total VOC abundance was expressed as ng hexyl acetate equivalents per tube using a hexyl acetate calibration curve (y = 196,627x + 248,375; R2 = 0.9998).
Statistical analysis
Fruit-quality traits were analyzed using ten individual fruits per cultivar. The primary metabolite analysis was performed using four pooled biological replicates per cultivar, with each replicate consisting of flesh juice prepared from three fruits. The VOC analysis was performed using four biological replicates per cultivar, with each replicate consisting of four fruits adjusted to approximately 1200–1300 g. For the dataset-level multivariate comparison, matched observations with complete records across the relevant feature matrices were used, resulting in a matched matrix containing three biological replicates per cultivar. Data are presented as the mean ± standard deviation. Differences among cultivars were tested by means of a one-way analysis of variance (ANOVA), followed by Tukey’s honestly significant difference (HSD) test at p < 0.05. PCA, PLS-DA, and VIP analyses were conducted using MetaboAnalyst 6.0 (Pang et al. 2024). For PLS-DA validation, Q2 was calculated using leave-one-out cross-validation, and model significance was assessed in permutation tests with 999 permutations, following recommended validation approaches for supervised metabolomics models (Westerhuis et al. 2008; Szymańska et al. 2012). PERMANOVA (permutational multivariate analysis of variance) was performed using Euclidean distance matrices with 999 permutations (Anderson 2001). Homogeneity of the multivariate dispersion was assessed using PERMDISP before interpreting the PERMANOVA results (Anderson 2006). Routine quality traits, primary metabolites, TD-GC-MS-based VOC profiles, and the combined quality + VOC dataset were analyzed separately.
Results
Representative fruit appearance
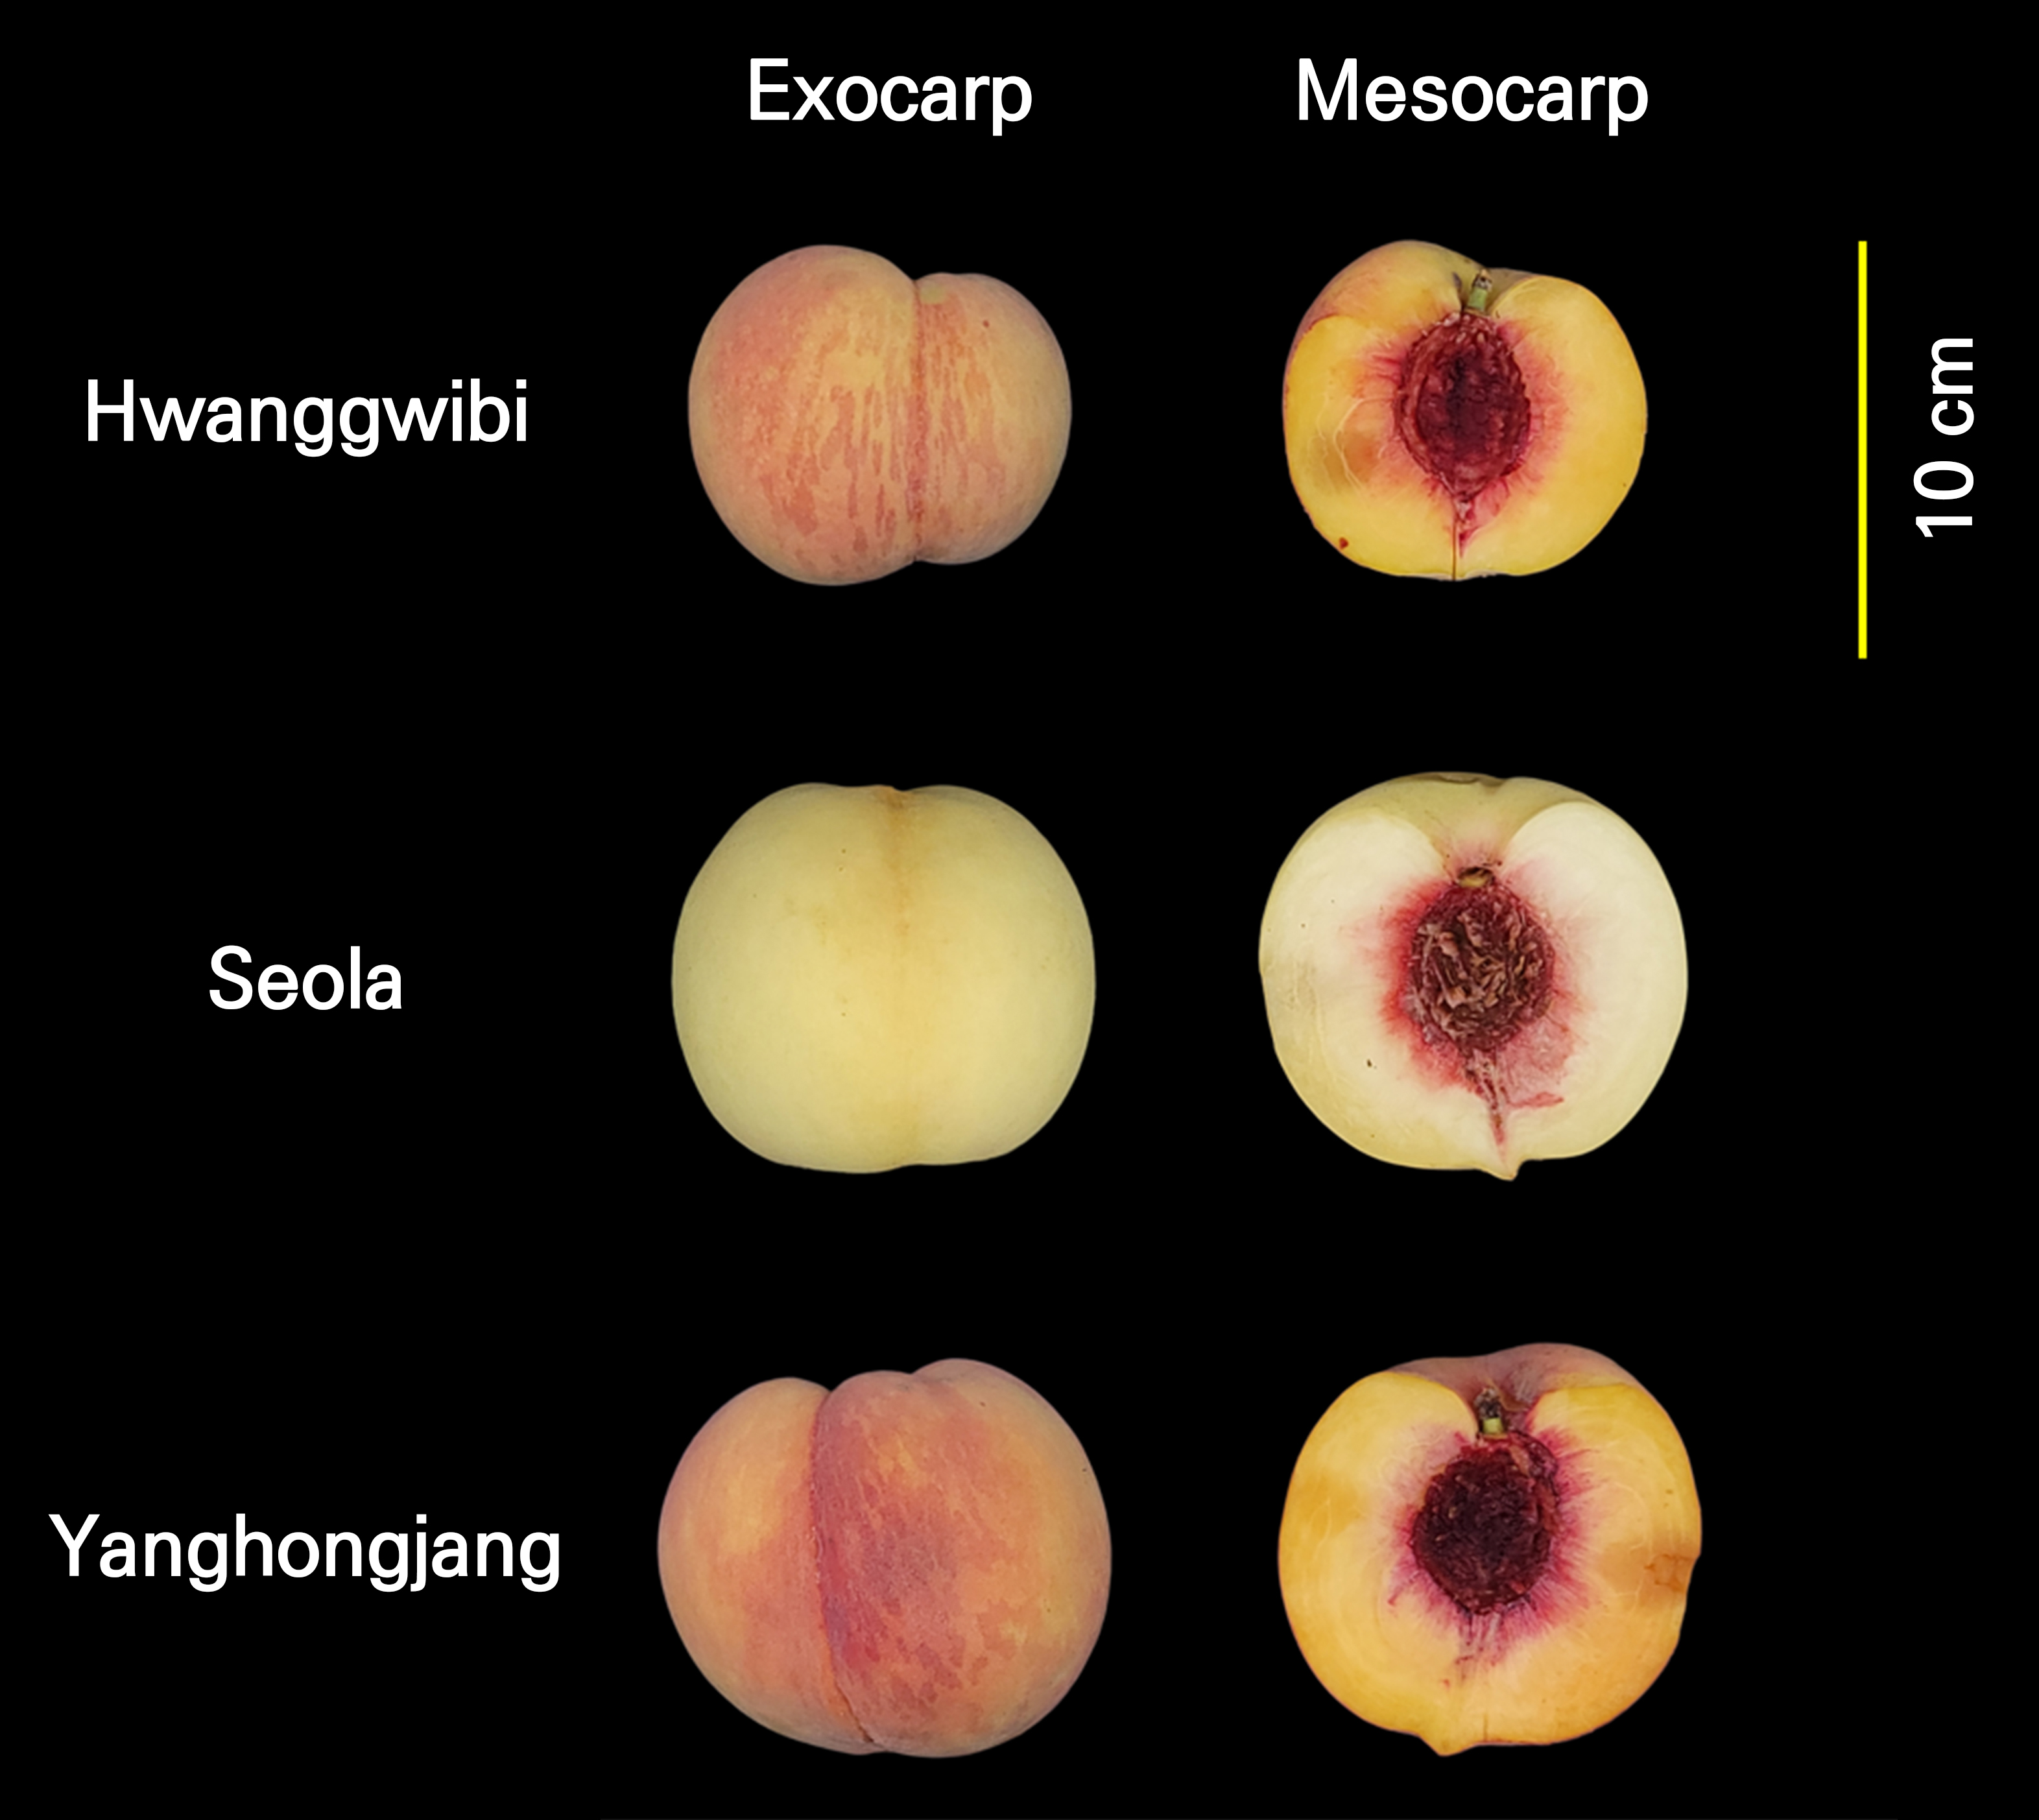
Representative whole and longitudinally cut fruits of the three peach cultivars are shown in Fig. 1. The cultivars showed visible differences in the external peel color and internal flesh appearance. ‘Seola’ had a pale peel and light flesh, whereas ‘Yanghongjang’ showed stronger red coloration on the peel and around the stone. ‘Hwanggwibi’ showed an intermediate external appearance with a yellow-orange background color and moderate red pigmentation. These visual differences were consistent with the colorimetric differences described below.
Physicochemical characteristics
Fruit-quality traits varied among the three peach cultivars (Fig. 2 and Table 1). Fruit weight ranged from 300.2 to 365.2 g. ‘Yanghongjang’ had the highest fruit weight, whereas ‘Hwanggwibi’ had the lowest mean fruit weight (Fig. 2A). SSC values were similar among the cultivars and ranged from 12.1 to 12.6°Brix (Fig. 2B). A clearer difference was observed in TA. ‘Seola’ showed the highest acidity (0.66%), followed by ‘Hwanggwibi’ (0.58%) and ‘Yanghongjang’ (0.54%) (Fig. 2C). Because SSC values were similar but TA differed, the SSC/TA ratio varied among the cultivars. The ratio was highest in ‘Yanghongjang’ (24.5) and lowest in ‘Seola’ (19.3) (Fig. 2D). Firmness also differed among the cultivars. ‘Seola’ had the highest firmness (39.7 ± 3.0 N), followed by ‘Hwanggwibi’ (33.1 ± 4.7 N), whereas ‘Yanghongjang’ showed much lower firmness (13.1 ± 3.9 N) (Table 1). These results indicated that acidity, the SSC/TA ratio, and firmness contributed more strongly to cultivar-associated differences than SSC.
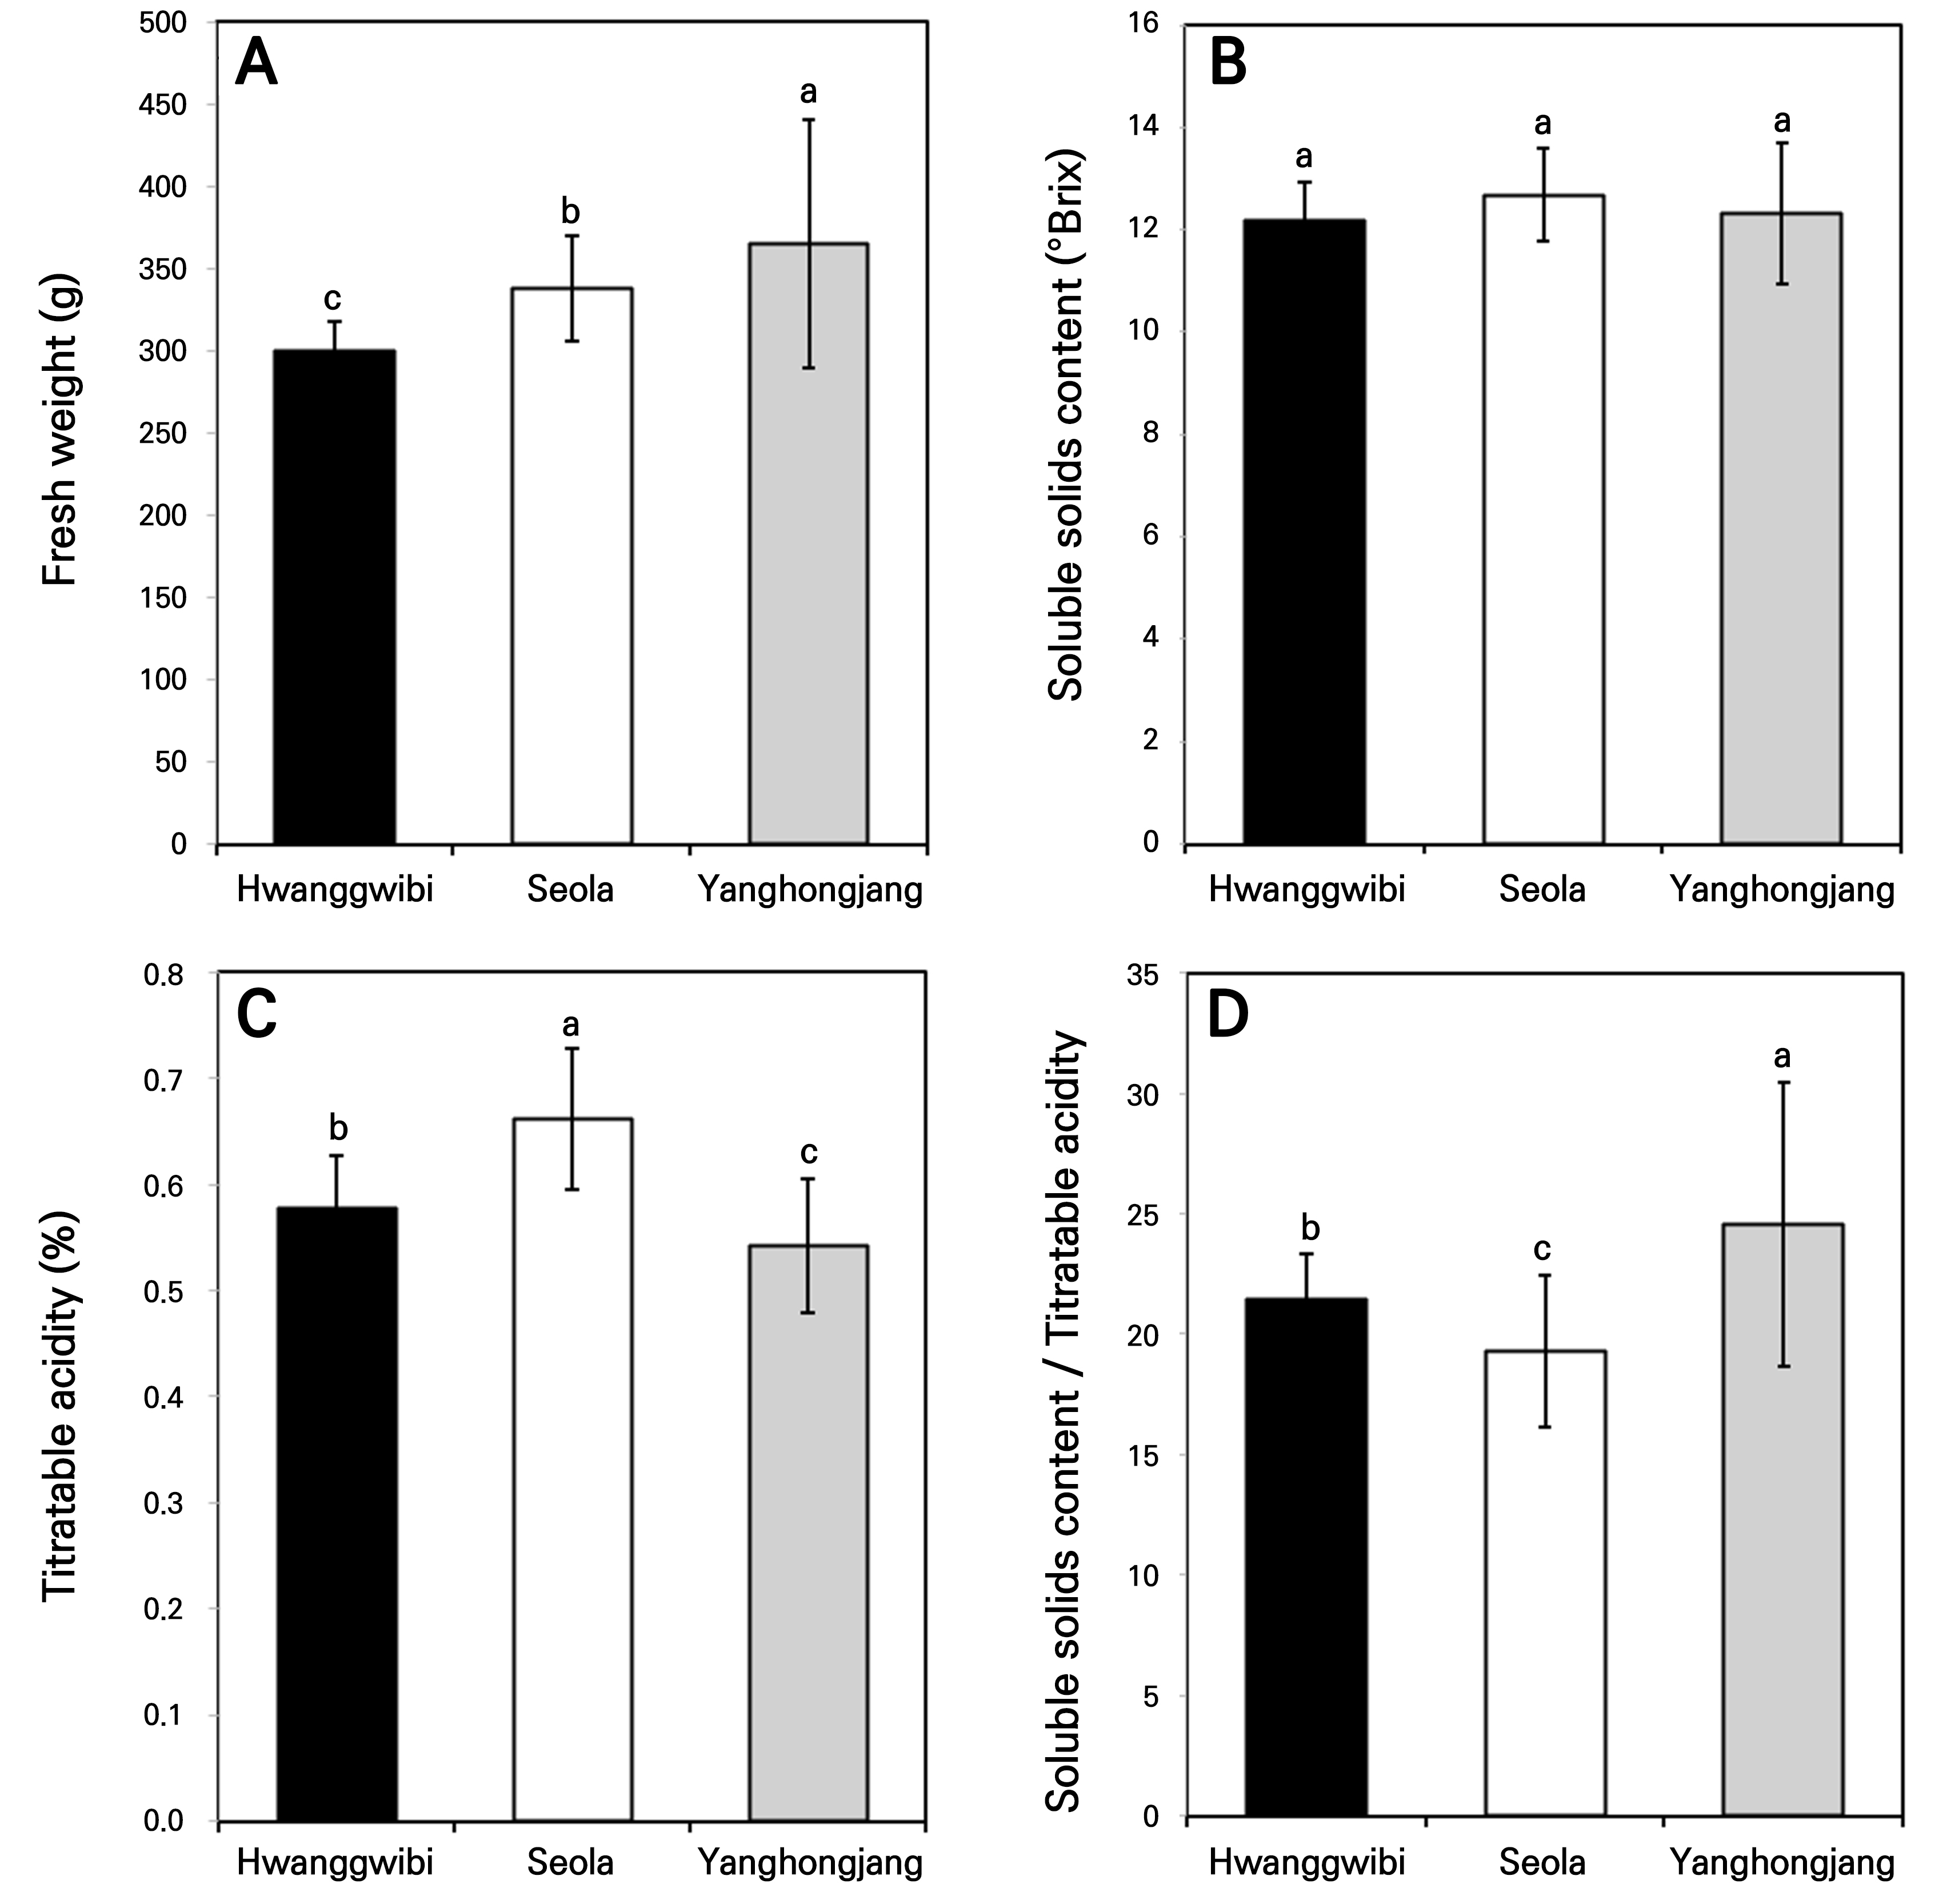
Fig. 2.
Physicochemical characteristics of the three peach cultivars: (A) Fresh weight, (B) soluble solids content (SSC), (C) titratable acidity (TA), and (D) SSC/TA ratio. Values are presented as the mean ± standard deviation (SD; n = 10). Different letters indicate significant differences among the cultivars according to Tukey’s honestly significant difference (HSD) test (p < 0.05).
Table 1.
Firmness of three peach cultivars measured at two equatorial positions of the fruit
| Trait | Cultivar | Mean | Left | Right |
| Firmness (N) | Hwanggwibi | 33.1 ± 4.7 b | 33.4 ± 6.2 b | 32.7 ± 3.2 b |
| Seola | 39.7 ± 3.0 a | 40.6 ± 1.1 a | 38.7 ± 4.8 a | |
| Yanghongjang | 13.1 ± 3.9 c | 10.7 ± 2.8 c | 15.5 ± 2.0 c |
CIE color characteristics
Peel color differed clearly among the cultivars (Table 2). ‘Seola’ had the highest L* value (77.9 ± 2.4), indicating the brightest peel surface. ‘Yanghongjang’ had the lowest L* value (57.7 ± 5.6). The a* value was highest in ‘Yanghongjang’ (21.6 ± 6.6), reflecting stronger red coloration, whereas ‘Seola’ showed negative a* values (‒2.0 ± 1.1). The b* value was highest in ‘Hwanggwibi’ (44.1 ± 4.8), indicating stronger yellow coloration. Chroma and hue angle showed similar cultivar-associated tendencies. No significant difference was observed between the left and right measurement positions, indicating that the observed color differences were mainly cultivar-associated.
Table 2.
CIE L*, a*, b*, chroma, and hue angle values of three peach cultivars as measured at the equatorial plane of the fruit
Notes. Values are presented as the mean ± standard deviation (SD; n = 10). Different letters within each column indicate significant differences among the cultivars according to Tukey’s honestly significant difference (HSD) test (p < 0.05). No significant differences were observed between the left and right measurement positions for any color parameter.
Primary metabolite profiles
The hierarchical clustering analysis based on primary metabolites revealed cultivar-associated metabolic patterns (Fig. 3A). Samples from the same cultivar tended to cluster together, indicating differences in primary metabolite compositions among the tested cultivars. ‘Seola’ showed relatively high levels of organic acids and amino acids, in this case quinic acid, malic acid, citric acid, proline, glutamic acid, and asparagine. In contrast, ‘Yanghongjang’ showed higher relative abundance levels of carbohydrate-related metabolites, specifically glucose, sorbopyranose, glucitol, fructose, and arabinofuranose. ‘Hwanggwibi’ showed mixed metabolite patterns, with variations in sugar-alcohol- and organic-acid-related compounds. The VIP analysis showed that sorbitol had the highest contribution to cultivar-associated differentiation, followed by glucopyranose, myo-inositol, galactaric acid, stearic acid, palmitic acid, quinic acid, sucrose, glutamic acid, and proline (Fig. 3B). These results showed that the tested cultivars differed in terms of their metabolite compositions despite their similar SSC values.
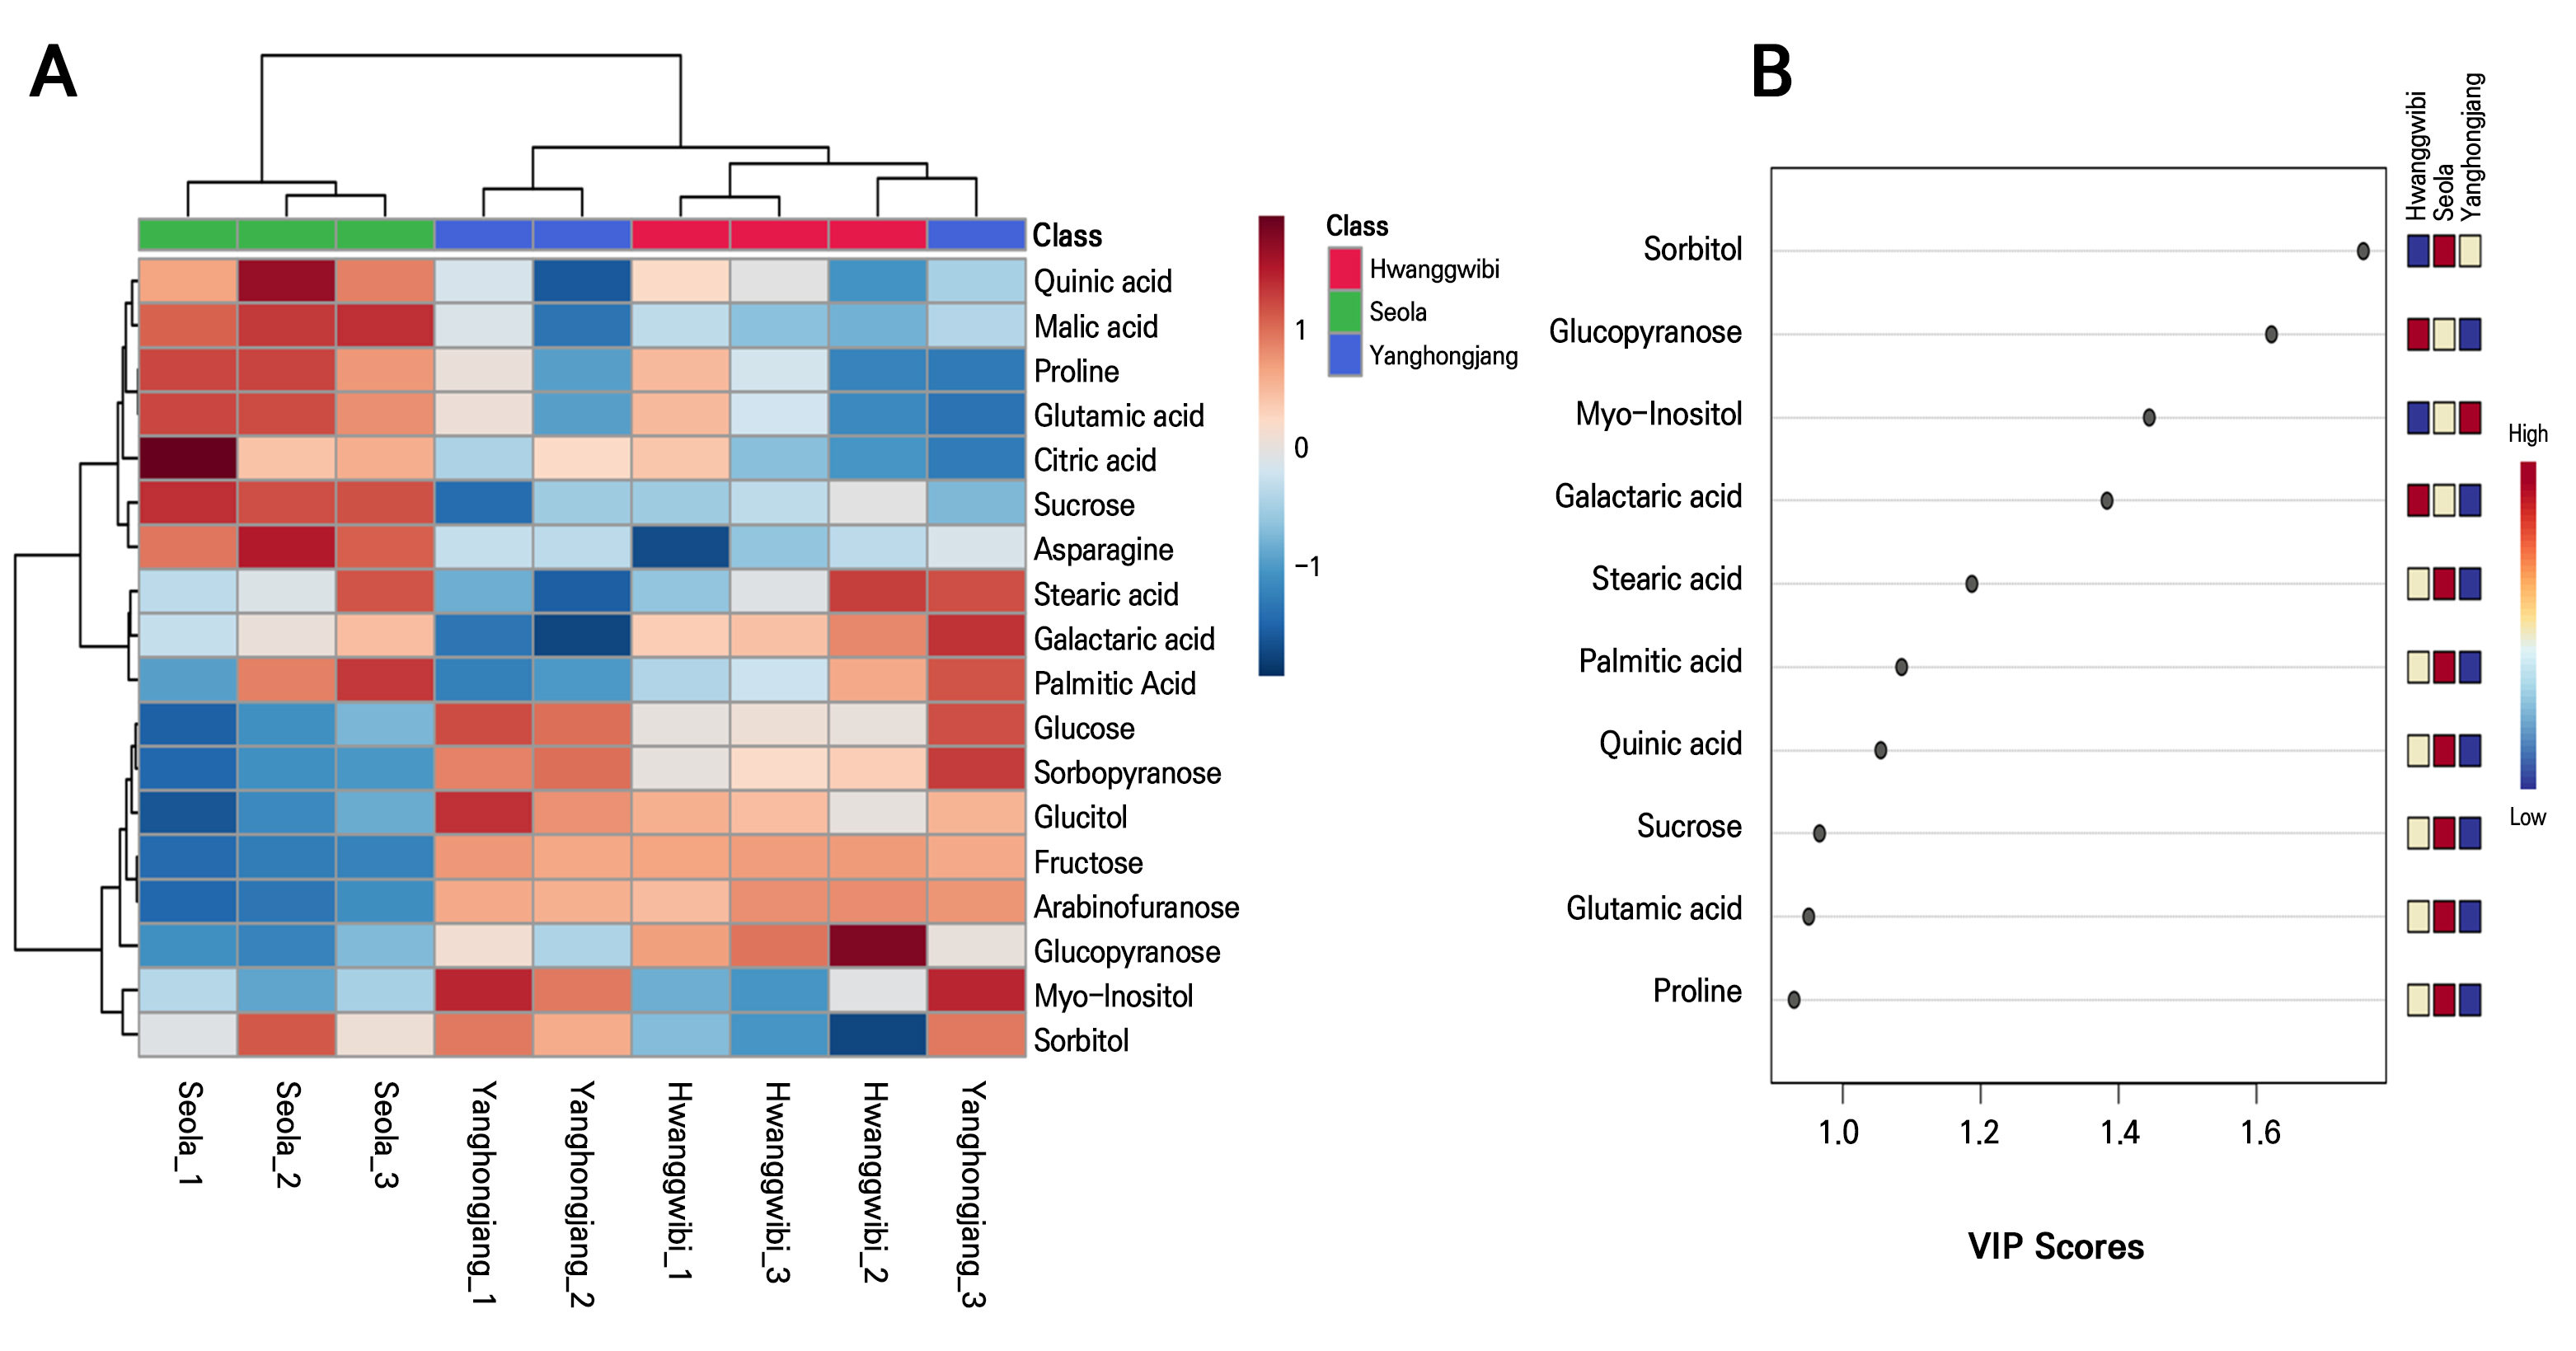
Fig. 3.
Primary metabolite profiles of three peach cultivars: (A) Hierarchical clustering heatmap based on normalized metabolite abundances. Rows represent metabolites and columns represent pooled biological replicates. Red and blue colors indicate relatively high and low abundance levels, respectively. (B) Variable importance of the projection (VIP) scores of the top candidate discriminatory metabolites identified from PLS-DA. Small color bars indicate the relative metabolite abundance level in each cultivar.
VOC profiles and representative compounds
TD-GC-MS-based VOC profiling showed cultivar-associated volatile patterns (Fig. 4A). The VOC heatmap revealed cultivar-associated clustering patterns, although some overlap among cultivars was observed. Among the VOCs confirmed using authentic standards, D-limonene, 2-ethyl-1-hexanol, and acetic acid were selected as representative compounds because they showed significant differences among the cultivars based on ANOVA followed by Tukey’s HSD test (Figs. 4B–4D). D-limonene was most abundant in ‘Yanghongjang’ (Fig. 4B). In contrast, 2-ethyl-1-hexanol was highest in ‘Seola’ and lowest in ‘Yanghongjang’ (Fig. 4C). Acetic acid was relatively high in ‘Hwanggwibi’ and ‘Seola’ compared to ‘Yanghongjang’ (Fig. 4D). These selected VOCs contributed to the cultivar-associated variation observed in the TD-GC-MS dataset. The class-level analysis further showed that hydrocarbons and esters accounted for large proportions of the detected VOCs in all cultivars, while total VOC abundance was highest in ‘Hwanggwibi’ and lowest in ‘Yanghongjang’ (Supplementary Fig. S1).
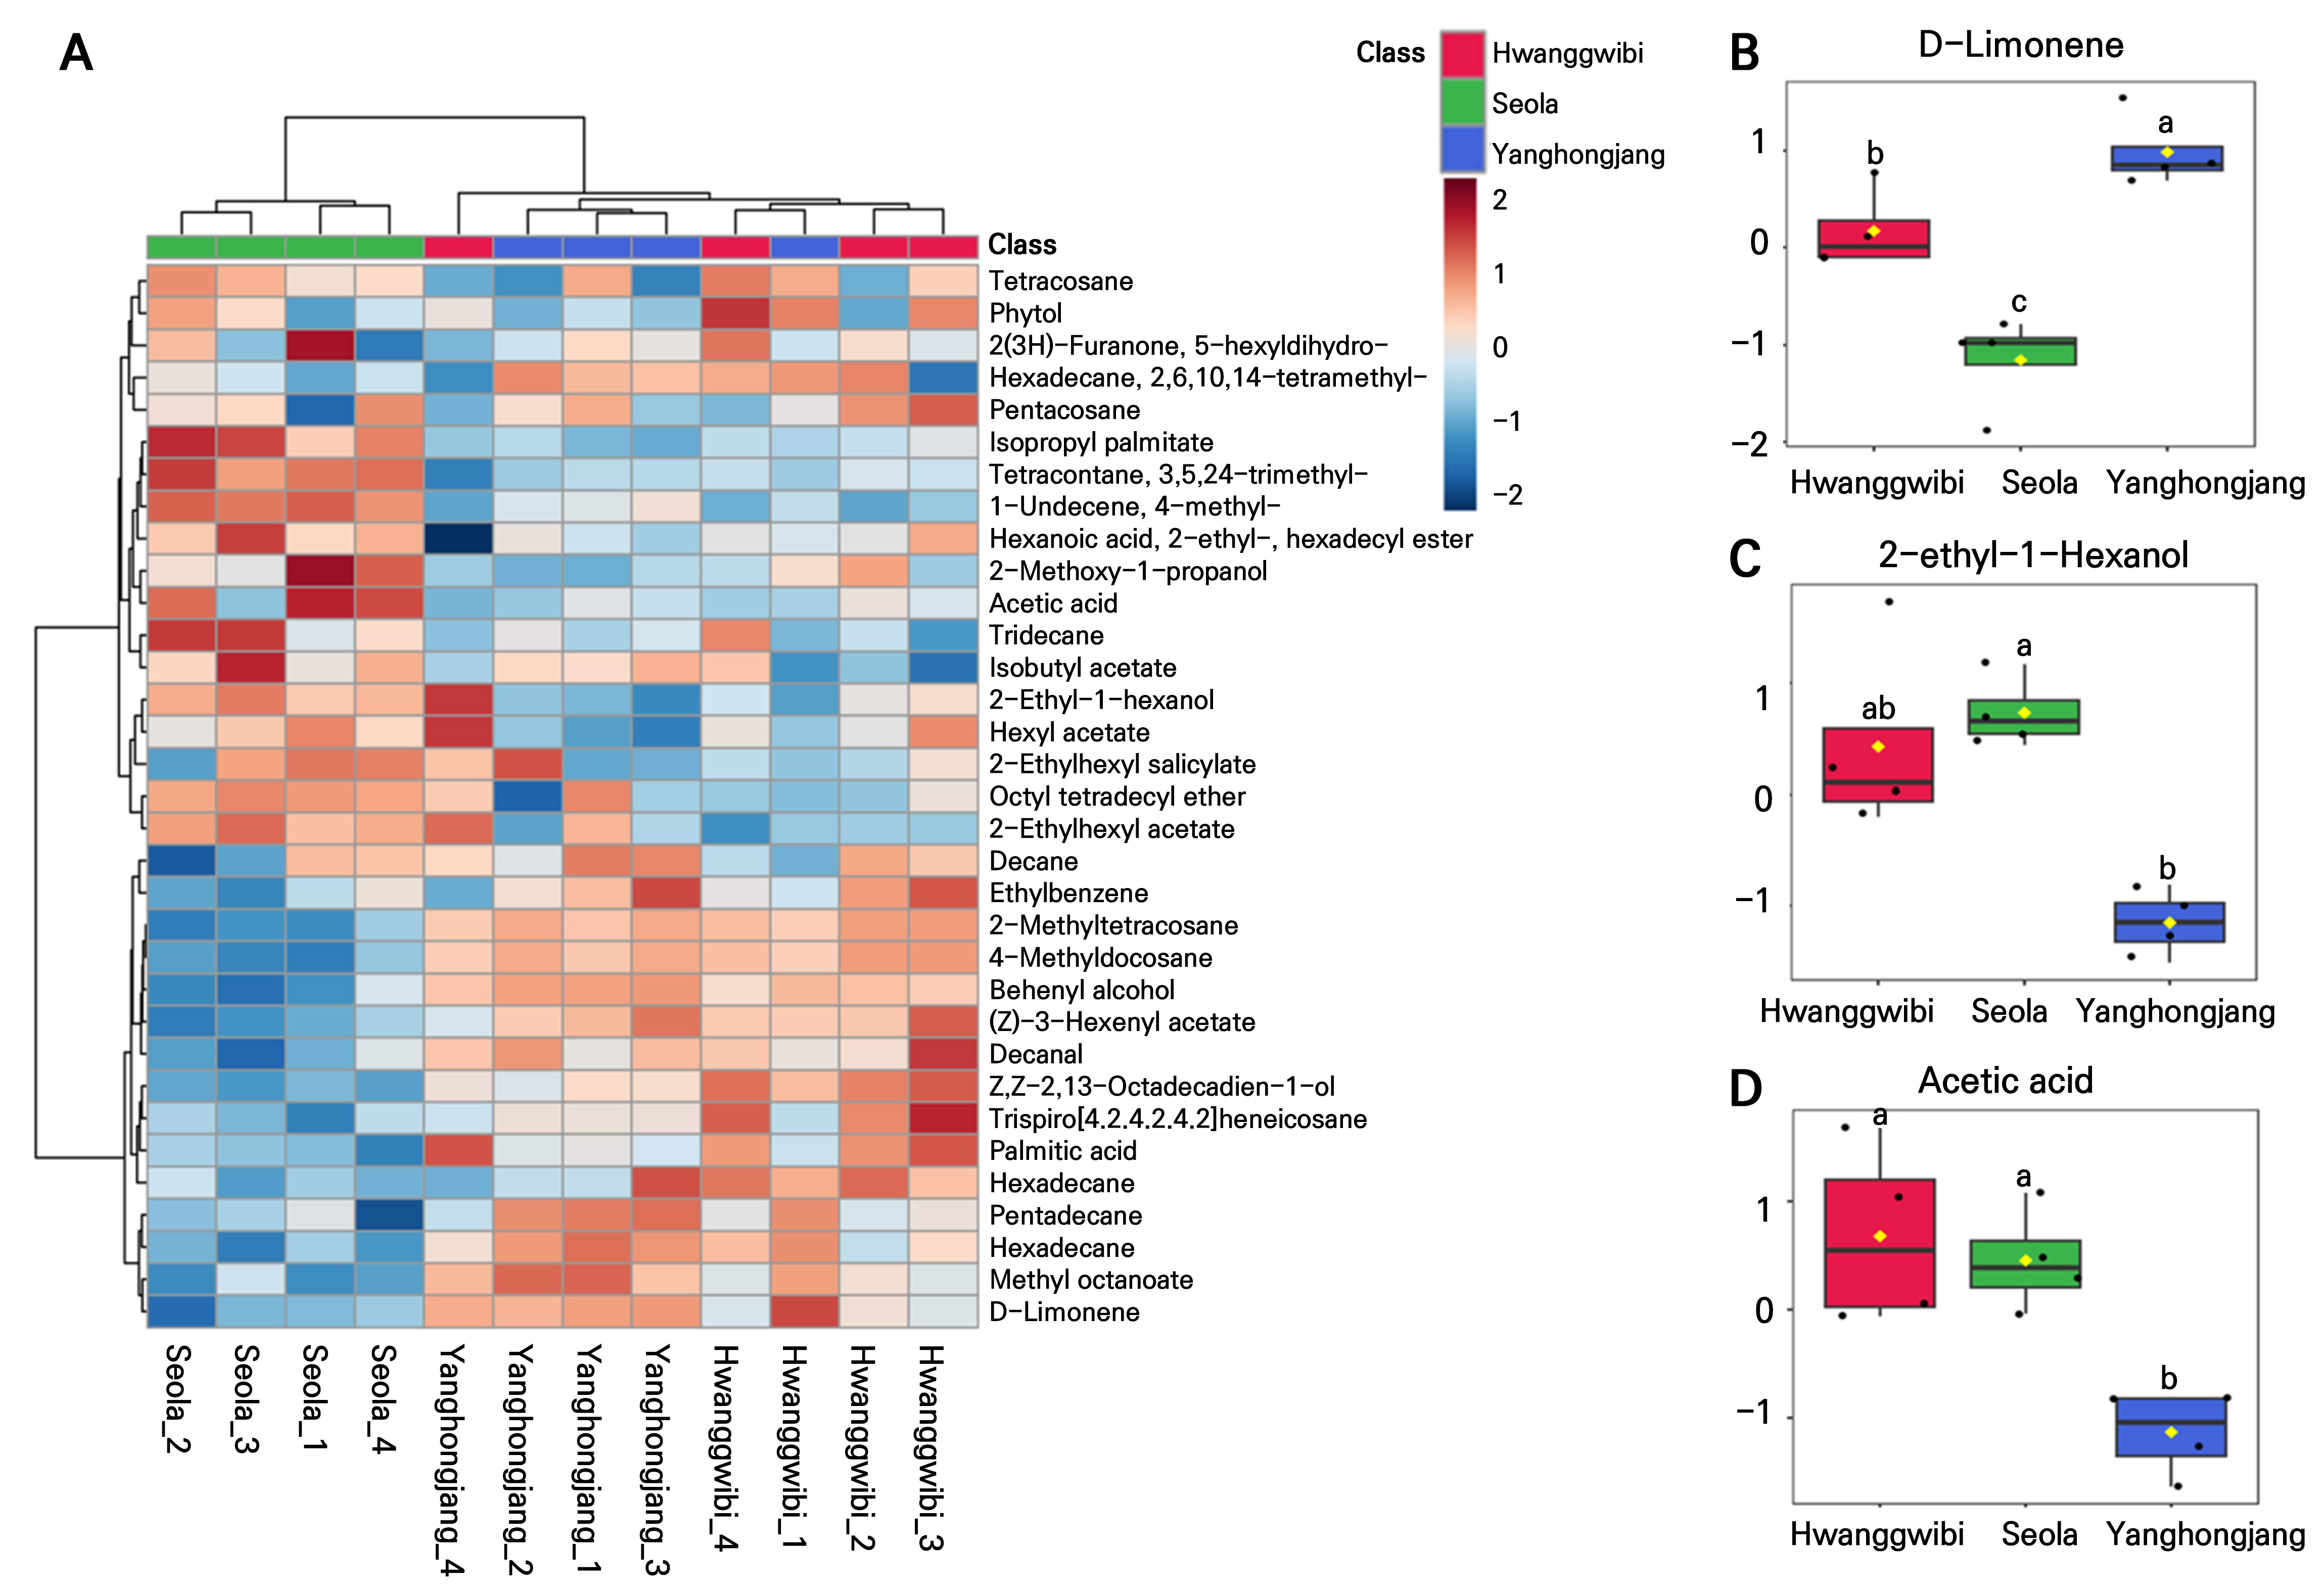
Fig. 4.
TD-GC-MS-based VOC profiles of three peach cultivars: (A) Hierarchical clustering heatmap showing cultivar-associated variations in the VOC composition. Rows represent VOCs and columns represent biological replicates. (B–D) Relative abundances of representative VOCs confirmed using authentic standards and selected based on significant differences among the cultivars by ANOVA followed by Tukey’s HSD test: D-limonene (B), 2-ethyl-1-hexanol (C), and acetic acid (D). Different letters indicate significant differences among the cultivars according to Tukey’s HSD test (p < 0.05).
Dataset-level multivariate comparison of analytical profiles
PCA score plots were used to examine cultivar-associated separation based on routine quality traits, TD-GC-MS-based VOC profiles, and the combined quality + VOC dataset (Fig. 5). PERMANOVA, PERMDISP, and PLS-DA validation assessments were then used to compare the exploratory separation ability of the routine quality traits, primary metabolites, TD-GC-MS-based VOC profiles, and the combined quality + VOC dataset (Table 3). In the PCA score plot based on routine quality traits, the three cultivars showed partial separation (Fig. 5A). The VOC dataset produced clearer grouping, with less overlap among the cultivars (Fig. 5B), and the combined quality + VOC dataset also showed distinct separation among the cultivars (Fig. 5C). PERMANOVA indicated significant cultivar-associated differences for all datasets. Routine quality traits explained 77.8% of the variation (R2 = 0.778, p = 0.002), primary metabolites explained 49.0% (R2 = 0.490, p = 0.006), TD-GC-MS-based VOCs explained 68.6% (R2 = 0.686, p = 0.002), and the combined quality + VOC dataset explained 71.6% (R2 = 0.716, p = 0.002). The PERMDISP results were not significant for the four matrices (p > 0.05), suggesting that the PERMANOVA results were not primarily driven by differences in within-group dispersions. In leave-one-out cross-validated PLS-DA, the combined quality + VOC dataset showed the highest Q2 value (Q2 = 0.963), followed by the TD-GC-MS-based VOC dataset (Q2 = 0.915), routine quality traits (Q2 = 0.885), and primary metabolites (Q2 = 0.186). Permutation tests indicated significant PLS-DA model performance for all datasets. These results indicate that routine quality traits, VOC profiles, and their combined dataset were useful for exploratory separation of the tested cultivars, while the combined quality + VOC dataset provided the strongest cross-validated predictive performance. Given the small sample size (n = 3 for the matched multivariate analysis), these model-performance and discriminatory results should be regarded as exploratory rather than confirmatory, and cross-validation and permutation testing cannot fully offset this constraint. These multivariate results should be interpreted with caution because the study was based on a limited single-season sample set.
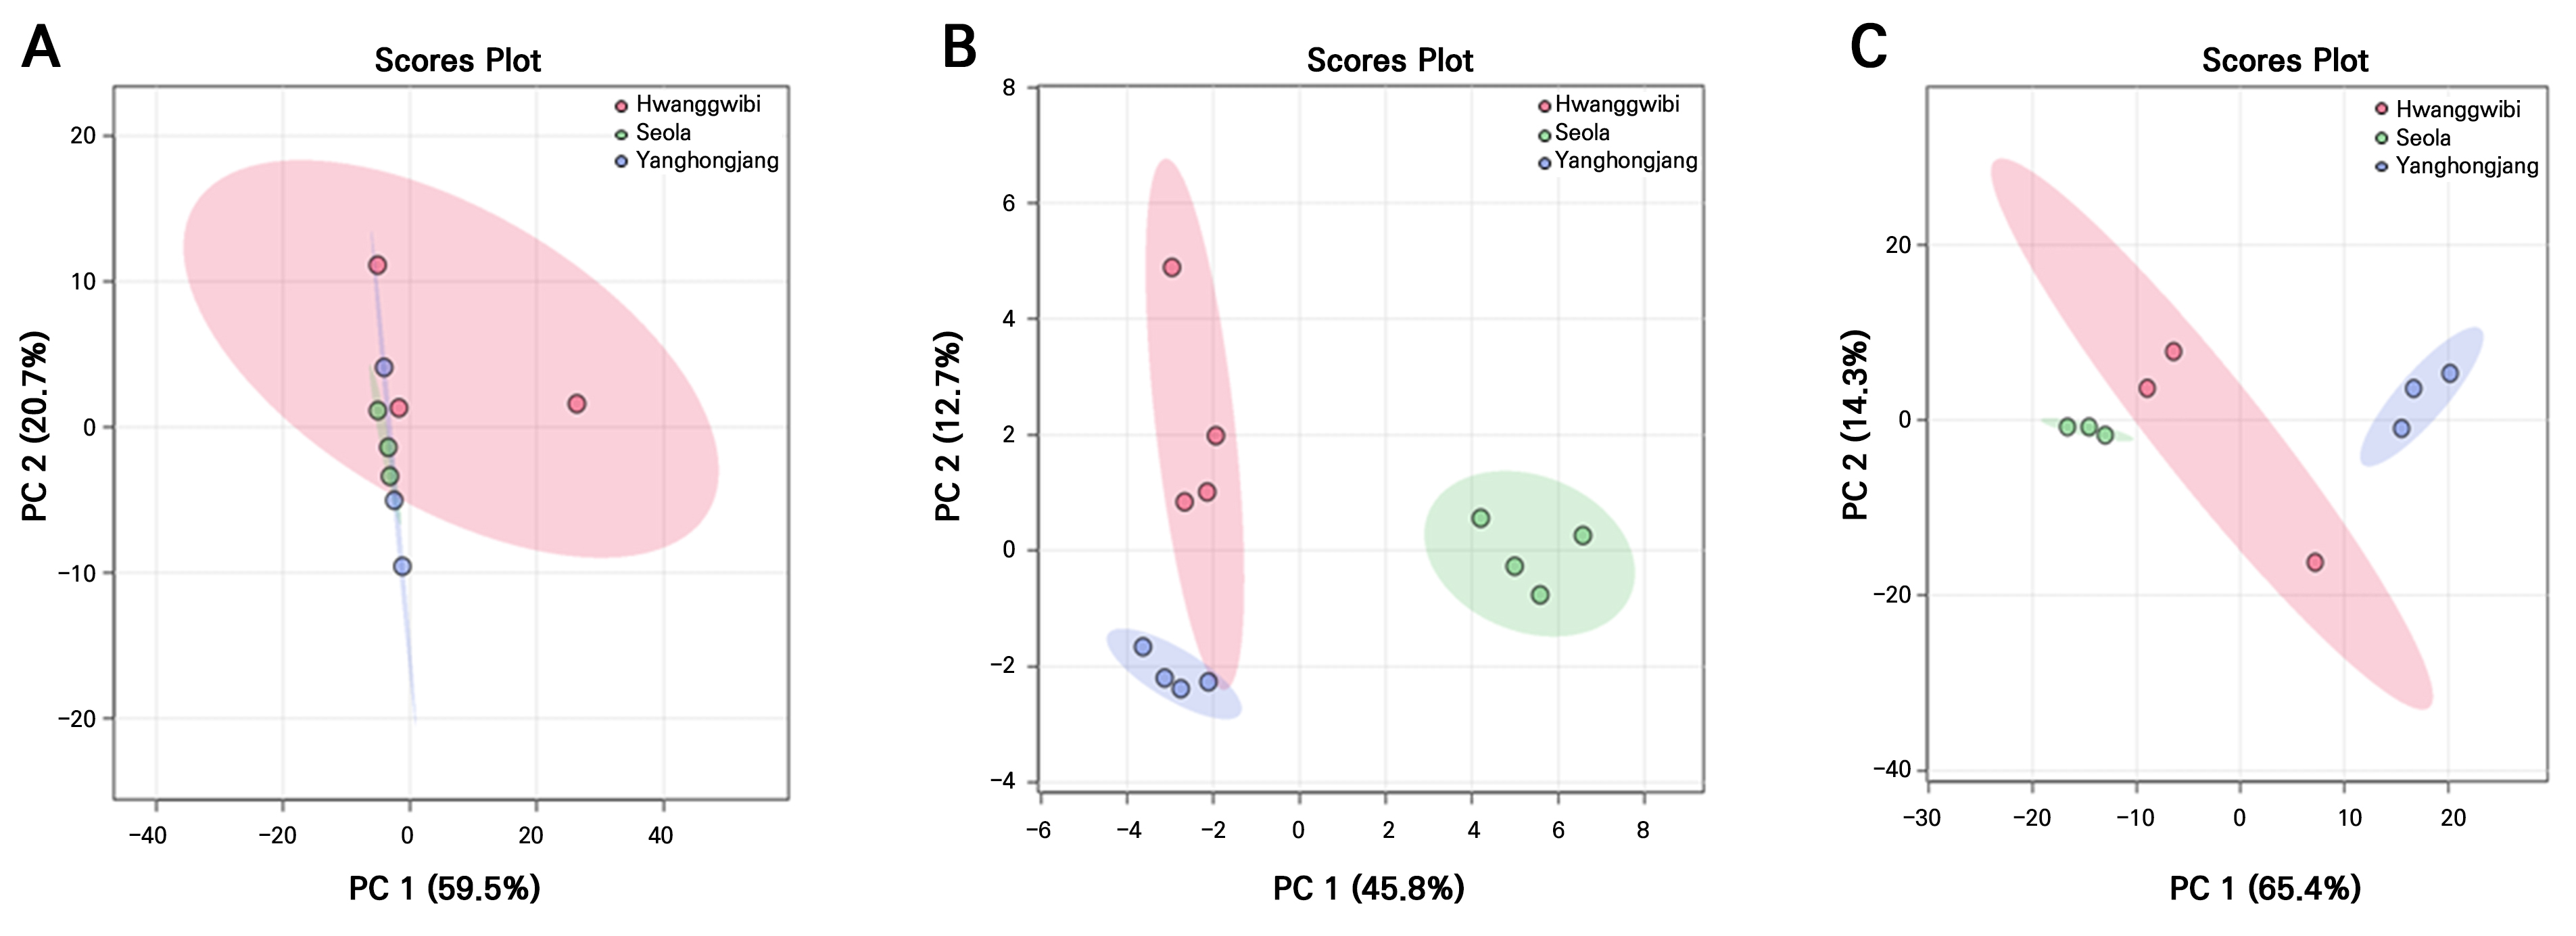
Fig. 5.
Dataset-level comparison of cultivar-associated separation based on routine quality traits, TD-GC-MS-based VOC profiles, and the combined quality + VOC dataset. Routine quality traits consisted of the fruit weight, soluble solids content (SSC), titratable acidity (TA), SSC/TA ratio, firmness, and peel color parameters (L*, a*, b*, chroma, and hue angle). (A) PCA score plot of routine quality traits, (B) PCA score plot of TD-GC-MS-based VOC profiles, and (C) PCA score plot of the combined quality + VOC dataset. Ellipses indicate 95% confidence intervals.
Table 3.
Multivariate validation of routine quality traits, primary metabolites, TD-GC-MS-based volatile organic compounds (VOCs), and the combined quality + VOC dataset for exploratory peach cultivar-associated separation
Notes. The combined dataset included routine quality traits and TD-GC-MS-based VOCs, but not primary metabolite features. For the dataset-level comparison, the matched data matrix contained three biological replicates per cultivar. PERMANOVA was performed with 999 permutations, homogeneity of the multivariate dispersion was assessed by PERMDISP, and the PLS-DA predictive ability was evaluated by means of leave-one-out cross-validation (Q2) and permutation testing with 999 permutations. Abbreviations: TD-GC-MS, thermal desorption–gas chromatography–mass spectrometry; VOCs, volatile organic compounds; PERM., PERMANOVA; DISP., PERMDISP; Perm., permutation; PERMANOVA, permutational multivariate analysis of variance; PERMDISP, test for homogeneity of the multivariate dispersion; PLS-DA, partial least squares-discriminant analysis; R2, coefficient of determination; Q2, cross-validated predictive ability; P, permutation-based P-value.
Discussion
Cultivar-dependent variations in fruit-quality traits
The three cultivars showed only a narrow SSC range of approximately 12°Brix, but this did not mean that their quality profiles were similar. The largest differences appeared in acidity, firmness, peel color, and the SSC/TA ratio. ‘Yanghongjang’ had the highest SSC/TA ratio because its acidity was relatively low, whereas ‘Seola’ showed the opposite tendency, with higher acidity and firmer flesh. These patterns agree with previous reports that peach and nectarine eating quality is influenced by the sugar-acid balance and texture rather than by soluble solids alone (Colaric et al. 2005; Crisosto and Crisosto 2005). Thus, if only SSC had been considered, the differences between ‘Seola’ and ‘Yanghongjang’ would have been underestimated. Color data also matched the visual differences among the fruits. ‘Seola’ had a brighter peel surface and negative a* values, while ‘Yanghongjang’ showed stronger red coloration. Therefore, within this sample set, routine quality traits showed that the three cultivars differed mainly in terms of their acidity, texture, and peel color as opposed to their soluble solids content.
Primary metabolite profiling provided additional information that was not captured by SSC. Although SSC values were similar among the cultivars, the relative abundance of individual sugars, sugar alcohols, organic acids, and amino acids differed. This is consistent with previous peach metabolomic studies showing that soluble solids content is not equivalent to the composition of individual primary metabolites (Desnoues et al. 2014; Cirilli et al. 2016; Baccichet et al. 2021). The higher relative abundance of organic acids in ‘Seola’ was also consistent with its higher TA, whereas the higher abundance levels of carbohydrate-related metabolites in ‘Yanghongjang’ may partly explain why this cultivar had a high SSC/TA ratio despite a similar SSC value. Sorbitol showed the highest VIP contribution, which is biologically plausible because sorbitol is a major translocated carbohydrate in Rosaceae fruit and is closely linked to sugar metabolism during peach fruit development (Cirilli et al. 2016). In peach, given that sorbitol imported from source leaves is converted to fructose and glucose via sorbitol dehydrogenase during ripening, the higher sorbitol-related signal in ‘Yanghongjang’ is consistent with its greater relative abundance of hexoses. Likewise, the elevated organic acids in ‘Seola’ (malic, citric, and quinic acids) reflect the tricarboxylic acid cycle and cytosolic acid-storage pathways that govern peach fruit acidity. These results suggest that primary metabolite profiling can reveal compositional differences that are masked when only bulk SSC is measured.
TD-GC-MS-based VOC profiles and cultivar-associated variations
The TD-GC-MS-based VOC profiles showed clearer cultivar-associated grouping than routine quality traits. Hydrocarbons and esters occupied large portions of the detected VOCs, but their relative proportions differed among the cultivars. Total VOC abundance was highest in ‘Hwanggwibi’ and lowest in ‘Yanghongjang’ (Supplementary Fig. S1), indicating that cultivar-associated differences were not limited to a few selected compounds. Among the standard-confirmed VOCs, D-limonene, acetic acid, and 2-ethyl-1-hexanol showed distinct cultivar-associated patterns. D-limonene was especially high in ‘Yanghongjang’, which also had a relatively large terpene fraction. Cultivar-dependent differences in peach volatiles, including terpenes, esters, aldehydes, alcohols, and lactones, have been reported previously (Eduardo et al. 2013; Mohammed et al. 2021; Wang et al. 2023). The present VOC results are consistent with those reports and suggest that volatile profiling can capture cultivar-associated chemical variations that are not apparent from routine quality traits alone. However, TD-GC-MS data should not be interpreted as a direct sensory aroma profile. Some compounds contributing to statistical separation may not have strong aroma activity, and long-chain compounds may be associated with surface-derived materials such as cuticular waxes. Therefore, the interpretation was kept at the level of standard-confirmed compounds, VOC classes, and exploratory cultivar-associated separation. Sensory analysis and odor activity value assessments would be required to determine which VOCs actually contribute to perceived peach aroma.
Integration of quality traits and VOC profiles improves cultivar characterization
The comparison among the datasets showed that routine quality traits and TD-GC-MS-based VOC profiles described different aspects of the fruit. Quality traits reflected physical and basic compositional characteristics such as the fruit size, acidity, firmness, peel color, and SSC/TA ratio. VOC profiles, in contrast, reflected differences in the volatile composition. In the updated multivariate validation, all datasets showed significant cultivar-associated separation according to PERMANOVA, and dispersion homogeneity tests were not significant. Routine quality traits explained a large proportion of the variation, indicating that basic phenotypic traits were already informative in this sample set. However, TD-GC-MS-based VOCs and the combined quality + VOC dataset showed high cross-validated PLS-DA Q2 values, with the combined dataset showing the highest predictive ability. This distinction is important because PERMANOVA R2 and cross-validated PLS-DA Q2 describe different aspects of dataset performance: PERMANOVA reflects the proportion of multivariate variation associated with cultivar grouping, whereas PLS-DA Q2 reflects the predictive performance under cross-validation. Consequently, a dataset explaining a larger proportion of variation is not necessarily the one that provides the highest predictive performance. In the present study, routine quality traits accounted for the largest proportion of cultivar-associated variation (R2 = 0.778), whereas the combined quality + VOC dataset achieved the highest cross-validated predictive ability (Q2 = 0.963). These outcomes are therefore not contradictory: routine quality traits captured a large proportion of cultivar-associated phenotypic variation, whereas the addition of VOC information improved the predictive discrimination of the cultivars, indicating that VOC profiles provide complementary rather than redundant information. Thus, VOC profiling did not simply replace routine quality traits; rather, it provided complementary chemical information that was not included when assessing the fruit size, SSC, acidity, firmness, or peel color. For newly bred peach cultivars with similar SSC values, combining conventional quality measurements with VOC profiling may therefore provide a broader exploratory characterization than either data type alone. This interpretation should be regarded as exploratory because the study included a limited number of cultivars and samples.
Limitations and implications for cultivar characterization
The main implication of this study is that integrated phenotyping can provide a more detailed characterization of newly bred peach cultivars than routine quality measurements alone within a defined experimental set. Nevertheless, the results should not be generalized beyond the tested sample set without further validation. Fruits were obtained through distribution centers, and exact harvest dates, orchard-level production sites, preharvest conditions, and pre-distribution handling histories were not fully available. The dates reported in the Materials and Methods section therefore represent sample acquisition dates rather than harvest dates. Although fruits were kept at 5°C after receipt and equilibrated at approximately 20°C for 1 d before analysis, this was a pre-analysis handling procedure and not a storage treatment. Peach VOC profiles can change during postharvest handling, low-temperature holding, and depending on the subsequent shelf-life conditions (Brizzolara et al. 2020; Farcuh and Hopfer 2023), and primary metabolites can also be affected by fruit maturity and the postharvest physiology (Wu et al. 2005; Desnoues et al. 2014). Therefore, the observed differences should be interpreted as cultivar-associated patterns reflecting the combined effects of cultivar, fruit maturity, and postharvest handling within this single-season distribution-center sample set rather than as stable genotype-specific markers attributable to cultivar alone. Further studies using controlled harvest dates, uniform postharvest handling, multiple production years, and multiple locations are required to validate the stability of these metabolite and VOC patterns.
Conclusion
In this study, three newly bred peach cultivars with similar SSC values were characterized using routine quality traits, primary metabolite profiling, and TD-GC-MS-based VOC profiling. The cultivars differed in acidity, the SSC/TA ratio, firmness, peel color, the primary metabolite composition, and in their volatile profiles. Multivariate validation showed that routine quality traits, TD-GC-MS-based VOC profiles, and the combined quality + VOC dataset all contributed to exploratory cultivar-associated separation, with the combined dataset showing the highest cross-validated PLS-DA Q2 value. These results suggest that TD-GC-MS-based VOC profiling can complement conventional fruit-quality measurements by adding volatile-composition information. Because the study was based on a single-season distribution-center sample set without sensory validation, the results should be interpreted as baseline information for the tested cultivars rather than as validated genotype-level or sensory markers. Further validation across production years, locations, and controlled postharvest conditions is needed.
Supplementary Material
Supplementary materials are available at Horticultural Science and Technology website (https://www.hst-j.org).
- HORT_20260027_Fig_S1.docx
Supplementary Fig. S1. Comparison of volatile organic compound (VOC) class distributions and total VOC abundance levels among three peach cultivars: (A) Relative proportions of VOC classes, specifically hydrocarbons, esters, terpenes, alcohols, acids, aldehydes, and furanones, detected by TD-GC-MS. Values are expressed as percentages of the total VOC abundance within each cultivar. (B) Total VOC abundance expressed as ng hexyl acetate equivalents per tube. Values are presented as the mean ± SD (n = 4). Different letters indicate significant differences among the cultivars according to Tukey’s HSD test (P < 0.05).
