

Introduction
Materials and Methods
Plant Materials
Measurement Methods
Establishment of the Logistic Growth Model
Growth Model Testing and Developmental Stage Evaluation
Results
Assessment of Materials and Parameters
Acquirement of the Model Logistic Function
Fruit Developmental Stage Division
Discussion
The Logistic Function Could be Useful for Describing Augmelon Growth
The Volume Parameter is Appropriate for Establishing an Augmelon Growth Model
Practice and Utilization of the Growth Stages in A. Trifoliata Breeding and Field Management
Conclusions
Introduction
Akebia trifoliata belongs to the Lardizabalaceae family, which contains approximately 9 genera and 50 species (Li et al., 2010); tends to grow in areas with high heat conditions, sufficient precipitation and high humidity (Wang et al., 2020); and is widely distributed in East Asia, especially China, Korea and Japan (Liu et al., 2007). When A. trifoliata fruit matures, the pericarp rapidly generates a unilateral crevice alongside the ventral suture in a few days, therefore, it is also commonly called augmelon (August melon) in various counties of China.
A. trifoliata, as a traditional Chinese medicine, has been widely used for more than 2000 years in East Asia, and the dried vines and roots are usually prescribed as antineoplastic, diuretic, and antiphlogistic agents (Liu et al., 2020). When the fruit is at the onset of maturity, the creamy pulp becomes soft and diaphanous, and develops a persimmon– and litchi–like flavour. Compared with other common fruits, augmelons have a surprisingly high content of vitamin C (Liu and Qian, 2002). Moreover, the seeds can be extracted to obtain edible oil that contains considerable amounts of oleic acid and linoleic acid (Ma et al., 2009). Therefore, A. trifoliata fruit has high potential as both fruit and oil crops.
Generally, field management strategies, including fruit number control, bagging and fertilization, are highly dependent on the developmental stage of the harvest organs. A. trifoliata has been systemically domesticated as a fruit crop in China for approximately 30 years (Xiong and Zeng, 1993), but the developmental stages of its fruit are still poorly understood. Therefore, defining the growth stages of A. trifoliata fruit is a fundamental and urgent need for its domestication and artificial cultivation.
Although a few studies on the growth stages of A. trifoliata fruit have been carried out via variance analysis (Xiong et al., 1996) and line graph observations (Li and Li, 1991), the results were not relevant to researchers and gardeners because of the absence of reasonable or solid evidence to support the assertions made in these previous reports. Hence, a more accurate and effective strategy to segment developmental stages is to establish a strictly mathematical model. The logistic equation, as a classic function that performs well in describing sigmoidal increases, is extensively applied to simulate or forecast plant organ development (Fujikawa et al., 2004). Moreover, with the piecewise fitting method, the logistic equation can fit complex curves consisting of several consecutive sigmoid increases (Tseng and Yu, 2014).
Besides an applicable mathematic model, determining an appropriate parameter of fruit growth that can truly describe the fruit growth dynamic is very important. Fruit length is usually employed as the sole parameter in the aforementioned studies, but this parameter is only effective for columnar or globular fruit (Xiong et al., 1996). However, the fruit of A. trifoliata exhibit various shapes ranging from columnar to crooked or oblate (Li et al., 2010), so finding an appropriate universal growth parameter is important for dividing the developmental stages of this fruit.
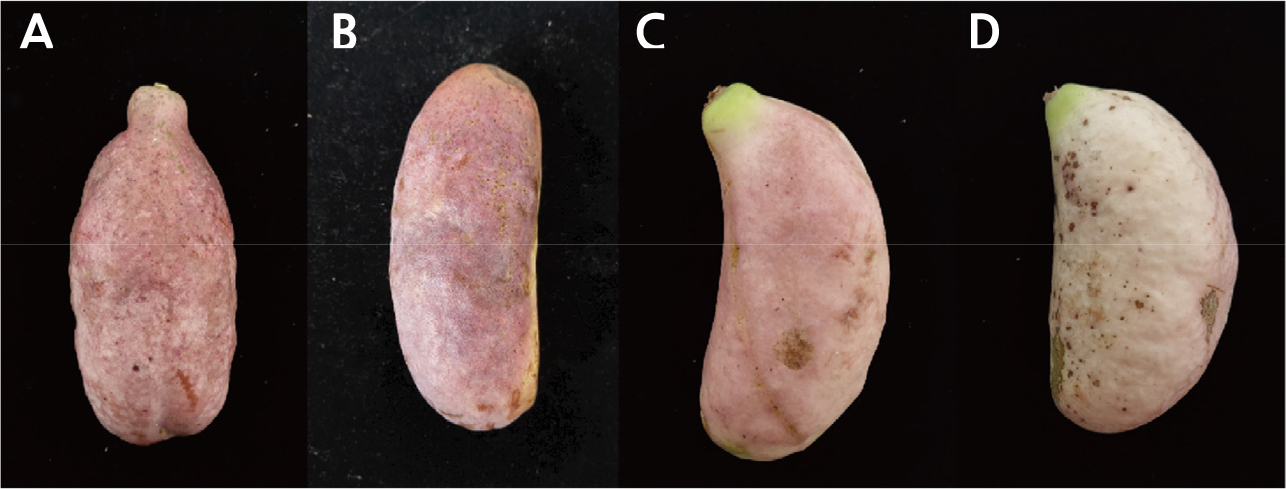
In the present study, 4 cloned lines, named Shusen 2, Shusen 3, Shusen 4 and Shusen 5, with spindle, nephroid, pyriform and banana–like fruit shapes, respectively, were selected to observe fruit development, to screen parameters for establishing the logistic equation and testing its suitability and to divide the developmental stages of this fruit.
Materials and Methods
Plant Materials
To establish a universal standard for identifying the A. trifoliata fruit developmental stage, we selected four plant lines with various fruit shapes (Fig. 1) (Shusen 2 with a spindle fruit shape and from Hunan Province, Shusen 3 with a nephroid fruit shape and from Sichuan Province, Shusen 4 with a pyriform fruit shape and from Chongqing Province, and Shusen 5 with a banana–like fruit shape and from Chongqing Province). Plants were collected from the region where the wild germplasms of A. trifoliata were mainly distributed, and the lines were then cloned by cutting. All cloned lines were planted in 2 m × 3 m experimental blocks at the Chongzhou Research Station of Sichuan Agricultural University (30°43' N–103°65' E) in Southwest China.
Measurement Methods
Three plants of each genotype were selected to investigate the fruit growth parameters. On each plant, 15 flowers (fruits) were marked after artificial fertilization on 19 March 2019. Then, growth parameters, including fruit length, width 1 (front view to ventral suture), width 2 (side view to ventral suture), weight and volume, were measured every 10 days until 15 September 2019, at which time approximately 50% of the fruits ripped, for a total of 18 measurements. Fruit length and width were determined directly from 10 marked fruits, while fruit weight and volume were measured on 5 unmarked fruits from the same plant that showed lengths and widths similar to the average lengths and widths of the marked fruits. Volume was measured by the drainage method, where the increase in volume was read directly. Fruits in the later developmental stage were bound to a standard volume of iron to increase the total volume, and the volume of the fruit equalled the total volume minus the volume of the iron standard, because the fruit could not be completely soaked in water due its low density.
Establishment of the Logistic Growth Model
The growth progress curve was simulated by a logistic model of the fruits exhibiting a pyriform shape (line Shusen 4), while those of Shusen 2 (spindle), Shusen 3 (nephroid) and Shusen 5 (banana) (Fig. 1) were employed to test the model. Fruit volume was chosen as the primary parameter for model establishment because it is the direct consequence of cell division and multiplication during fruit development. Several incomplete parts were integrated into a single intact function by the piecewise fitting method (Yu and Tseng, 2016). The functional curve was fitted by the nonlinear least squares program of the statistical software Origin (2019b, v9.6.5). Finally, the development period was appropriately divided according to the inflection points of the fitted curve.
Growth Model Testing and Developmental Stage Evaluation
To determine the suitability of the established model for different plants with various fruit shapes, the other three lines, Shusen 2 (spindle), Shusen 3 (nephroid) and Shusen 5 (banana), were employed for further simulation. By comparing the fitting goodness between all three simulated curves and the actual curve for volume growth, the best function was identified by the previously published piecewise method (Tseng and Yu, 2014). In each part of the equation, two inflections of the second derivative (both the rising and declining inflection of the volume increasing rate) were determined by the characteristic parameter method in Table 1 (Hu et al., 2013). Finally, the augmelon developmental stages could be divided according to the calculated inflections, and each stage was named after the developmental characteristic.
Results
Assessment of Materials and Parameters
Although the augmelons exhibited various shapes with differences in the curvature degree, thickness and roundness, there were four main shapes: pyriform, spindle, banana–like and nephroid (Table 2). The feature index of pytiform and spindle materials are more similar in curvature and round degree than other materials, therefore pytiform shape was selected as the model material to form a transverse contrasts whit spindle material and a vertical contrasts with the other two materials (Table 2 and Fig. 2). Growth dynamics curves of five parameters were drawn for the pyriform shape and shown in Fig. 2.
Table 2.
Feature index of different fruit shapes
| Strain name | Fruit shape | V/Dz | L/W1y | W1/W2x |
| Shusen 4 | Pyriform | 1.12 | 2.19 | 1.05 |
| Shusen 2 | Spindle | 1.09 | 2.40 | 1.01 |
| Shusen 5 | Banana-like | 1.30 | 2.31 | 0.93 |
| Shusen 3 | Nephroid | 1.48 | 2.07 | 0.88 |
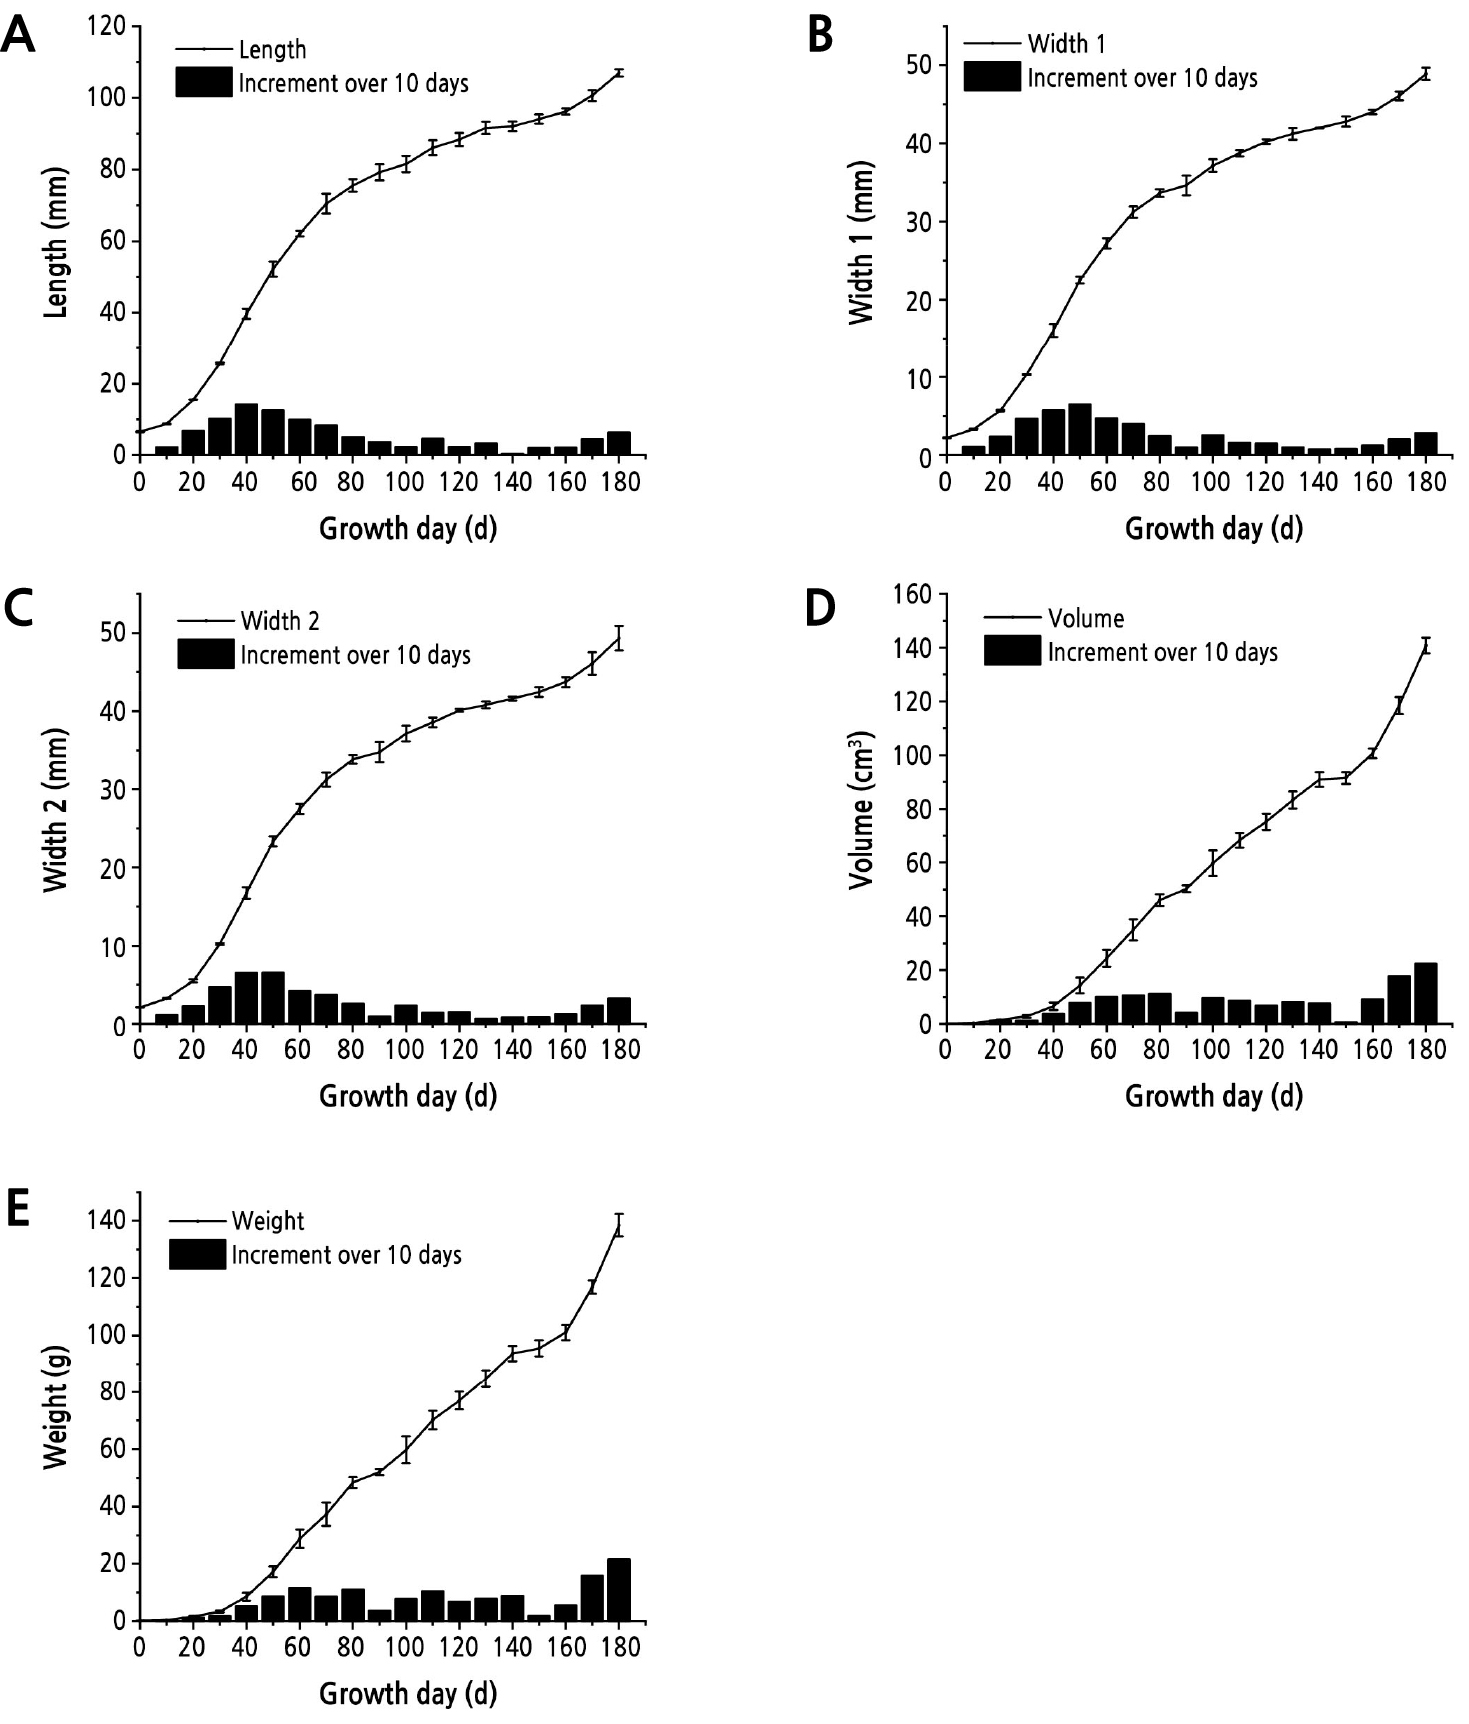
Fig. 2.
Growth dynamics of the five parameters for the pyriform shape. a Length curves showing two peaks, at the 30th day and 150th day; b, c width curves showing two peaks, on the 30th day and 150th day, and one suspected peak on the 90th day; d, e volume and weight curves showing three peaks, on the 30th day, 90th day and 150th day. These differences mean that a peak may be hidden in the length curve and that volume is the most suitable parameter.
Acquirement of the Model Logistic Function
In the model material, the volume growth exhibited two typical peaks (double–sigmoid curve) and one suspected peak, while the trends of the other four indices were not obvious (Fig. 2). Thus, the fruit growth period was divided into 2 sections (0–150 d and 150–180 d) or 3 sections (0–90 d, 90–150 d and 150–180 d) for piecewise fitting of the logistic model. The two–piece fitting equation and the three–piece fitting equation were further determined (Table 3). Both were applied to calculate the expected value for fruit volume simulation, and the goodness of fit between the expected value and observed value of the other three plant lines was tested (Table 3). The results for the goodness of fit showed that the difference between the expected value from the three–piece function and the observed values for the other three plant lines was not significant at the p < 0.05 level, while two-piece function has significant difference in two lines (Table 3), which indicated that the three–piece function was more suitable for establishing the model logistic function of augmelon growth.
Table 3.
Model logistic functions and their goodness of fit for the verification materials
| Fitting Method |
Fitting period (d) | Equations acquired | Goodness of fit (P-value) | ||
|
Spindle shape |
Nephroid shape | Banana-like | |||
| 2-piece function | 0–150 | V = 95.221/(1+e3.9229-0.045490t ) r2 = 0.9961 | 0.1943 | 0.0240* | 0.0083** |
| 150–180 | V = 23106.185/(1+e7.8156-0.015056t ) r2 = 0.9936 | ||||
| 3-piece function | 0–90 | V = 55.674/(1+e5.3927-0.085588t ) r2 = 0.9996 | 0.9544 | 0.3477 | 0.2127 |
| 90–150 | V = 104.578/(1+e3.3221-0.036009t ) r2 = 0.9957 | ||||
| 150–180 | V = 23106.185/(1+e7.8156-0.015056t ) r2 = 0.9936 | ||||
t fruit growth duration; V fruit volume; P value calculated with the Pearson chi-square method; r2 determination coefficient; P-value < 0.05 indicates that there is a significant difference between the model and verification data; P-value > 0.05 indicates no significant difference between the expected value and observed value.
Fruit Developmental Stage Division
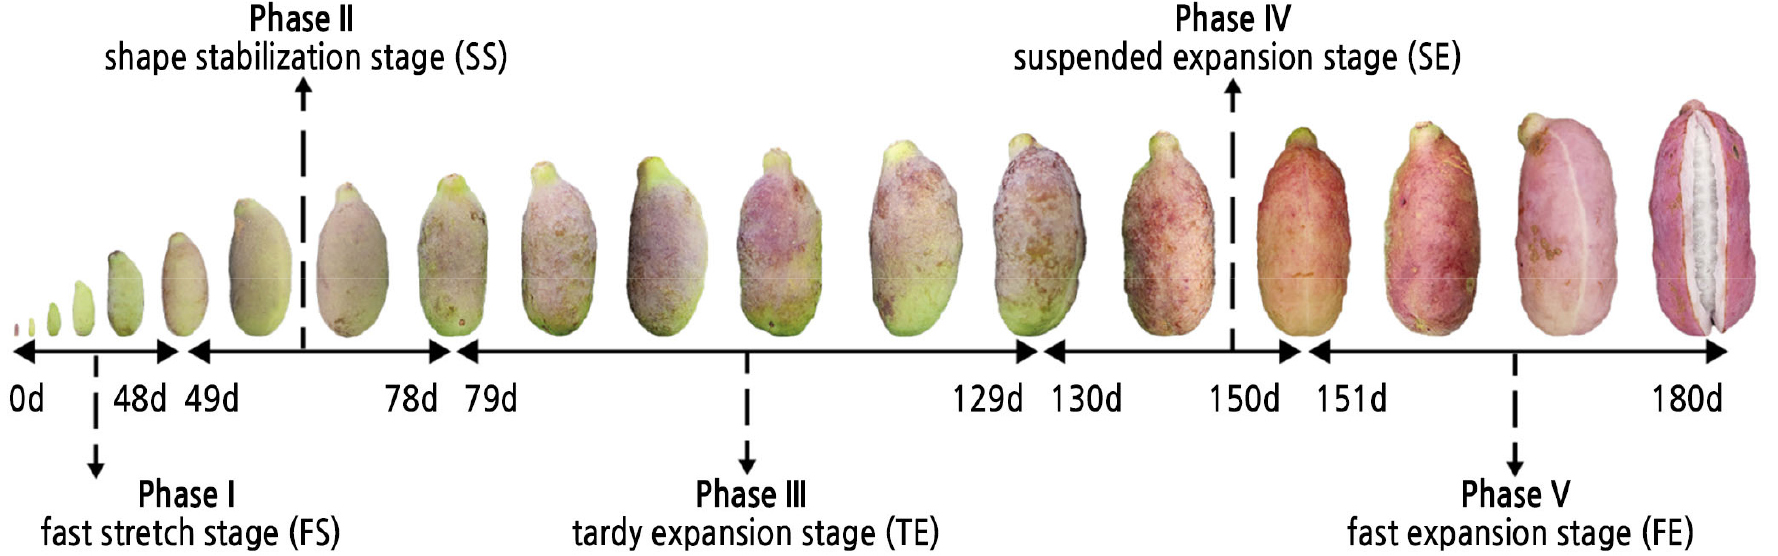
Three pairs of inflections (48 d, 78 d; 56 d, 129 d; and 432 d, 607 d) were identified on the three–part function curve. Three over-edged inflections (56 d, 432 d and 607 d; the two overly high inflections resulting from the small sample size at 150 d–180 d) were removed, and another important boundary point (150 d) was added to the simulated curve because it is an important point for either 2- or 3-section growth. Consequently, the corresponding 5 developmental stages consisted of the fruit fast stretch stage (FS) from 0 to 48 d, shape stabilization stage (SS) from 49 to 78 d, tardy expansion stage (TE) from 79 to 129 d, suspended expansion stage (SE) from 130 to 150 d and fast expansion stage (FE) from 151 to 180 d. The stages were named according to both the developmental process and increase in all parameters and indices measured or observed (Fig. 3). The average rate of fruit volume increase each day was the slowest at 0.29 cm3/d in FS and the fastest at 2.64 cm3/d in SE.
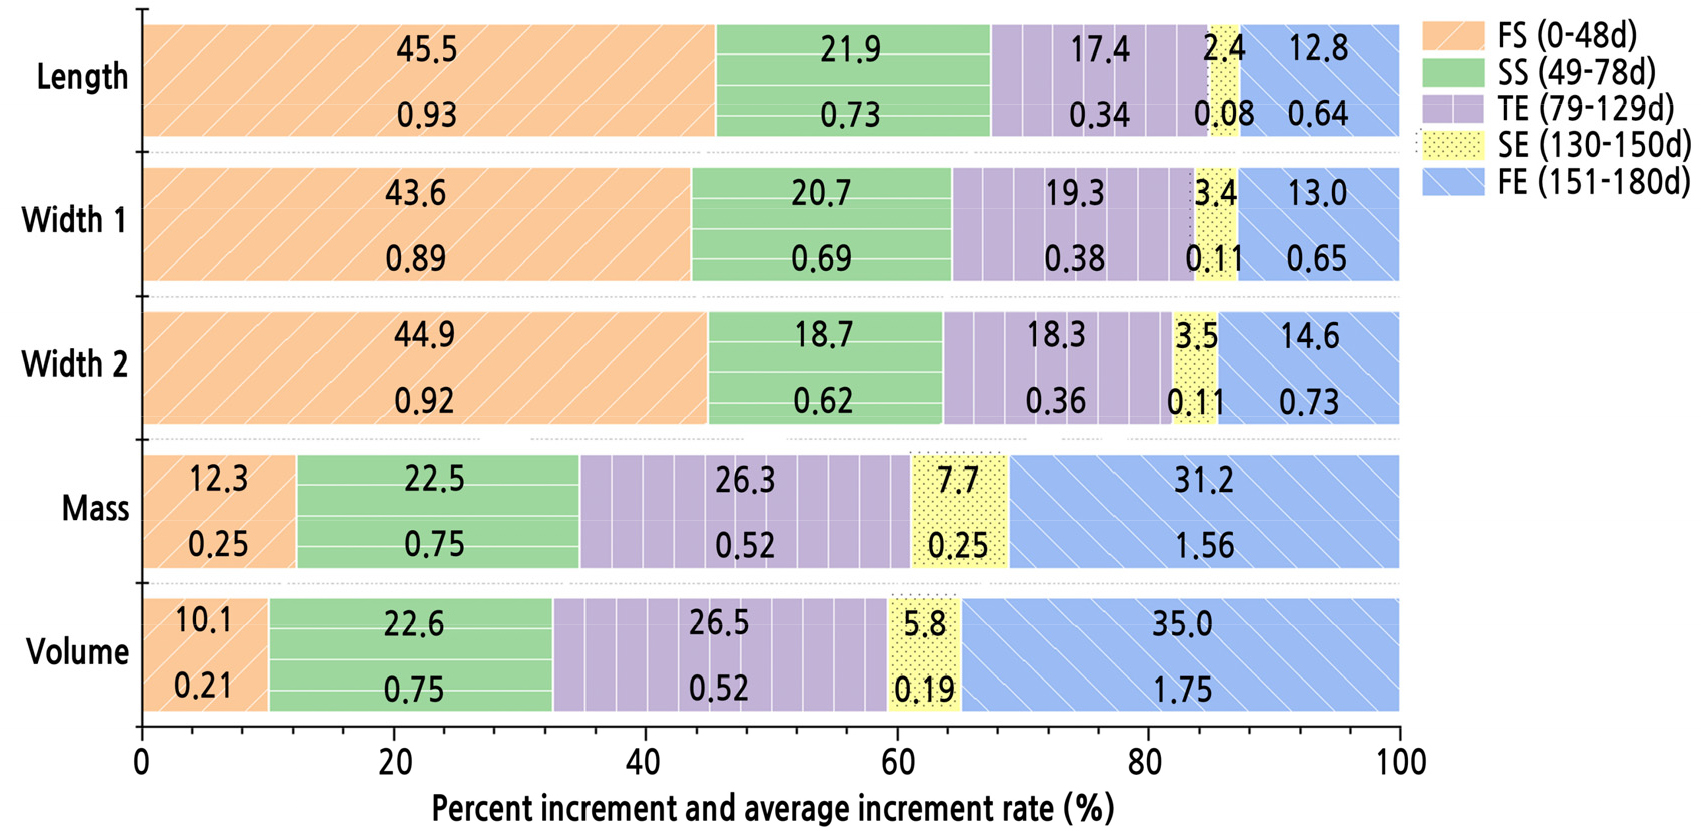
Fig. 3.
Percent increment and average increment rate in the five stages of each parameter. Five stages are represented with five colour. In each stage, upper value means percent increment, the proportion of the total increment in one period; lower value means average increase rate, the average increment in one day during each period.
In total, length and width increases mainly occurred in the early stages, especially in FS, while volume and weight increases mainly occurred in the later stages of fruit growth. In FS, the rates of the increases in both volume and weight were the slowest while the rates of the increases in both length and width were the fastest, so the length and width were approximately half those of ripe fruit at only one-fourth of the total experimental growth time. In the SS, the five parameters exhibited commensurate increases, while in the TE, the rates of the increases in all parameters became synchronously low. In SE, the rates of the increases in all five parameters were close to zero, and the peel colour changed from green or crimson to pink or purple, accompanied by some new shoots sprouting from the plants. In FE, the rates of the increases in the four parameters increased again, but the rate of the increase in volume was the highest, contributing to approximately one-third of total increase in the mature fruit volume and eventually resulted in fruit cracking. We also found that the fruit could not be completely soaked in water when we measured the volume in FE.
Discussion
The Logistic Function Could be Useful for Describing Augmelon Growth
In the 1930s, scientists noticed the complexity of plant organ growth (Pearsall, 1927). The growth of plant organs often exhibits S-shaped, double-S-shaped or more complex developmental dynamics. A logistic equation was first created for describing S-shaped curves for population increases and was then widely used in many biological systems for describing other sigmoid-like dynamics by different kinds of transformations (Tsoularis and Wallace, 2002). The piecewise fitting method is an important transformation that is especially suitable for continuous sigmoid curves. For example, apple size was well predicted from apple diameter, with a determination coefficient of r2 = 0.99 (Ortega-Farías and León, 2002). Based on the typical continuous S-shaped growth of augmelons (Fig. 2), this paper integrated a verified strategy to establish a piecewise logistic function with determination coefficients of r2 > 0.99 in each functional part and with good suitability for three plant materials, indicating that the piecewise fitting method is useful for describing augmelon growth.
The Volume Parameter is Appropriate for Establishing an Augmelon Growth Model
In addition to an appropriate mathematical model, a proper growth parameter can also increase the precision of simulation because there are various shapes within the same fruit crop (White et al., 2000). The basic feature of the selected growth parameter is that it reflects the real dynamics of organ development, and the volume parameter could be more suitable than the other four parameters in augmelon phenological research due to the effect of fruit shape (Xiong et al., 1996). In the present study, although the other four parameters were significantly correlated with weight, only volume appealed to a larger and more stable correlation between them, which suggests that volume is insensitive to the fruit shape changes and is a suitable parameter exhibiting the real growth dynamics of augmelons (Table 4).
Table 4.
Correlation coefficient between the weight and other parameters for the four materials
The growth of augmelons was previously divided into 4 stages by length and width (Li and Li, 1991) because of the slow rate of increase in the fruit length curve in Fig. 2 after 80 d, which makes it difficult to identify the difference in growth rate changes during the stage from 80 d to 150 d. However, volume, as a direct consequence of cell division and multiplication (Bertin et al., 2003), is a cubic function of length and width; volume is therefore an exponential magnification of fruit expansion and is more sensitive than length and width to expansion changes. Therefore, in our study, the period from 80 d to 150 d was refined into phase III and phase IV (Fig. 4). This suggests that volume data contain more dynamic development information than length or width data and are more suitable for phenological partitioning of augmelons.
Practice and Utilization of the Growth Stages in A. Trifoliata Breeding and Field Management
Based on both a suitable model and the ideal parameters, this partitioning of the growth stages of augmelons could be more objective and accurate and therefore could be widely applied in breeding, field management and so on. As a matter of fact, we found that this 5-stage partition works well during field observation due to its convenience of practice, because unique features in each stage were obvious. Practically, the red or violet peel, the whole pink or purple peel, and the white and wider ventral suture turns are hallmarks of the SS, SE, and FE stages, respectively, and FS and TE could be further identified by SS cutting. This information can be used by growers to predict when they should implement certain crop management practices, such as irrigation, fertilization, and pest and disease control (Whiting et al., 2015), and provide a valuable reference for both gardeners and scientists to precisely investigate or record the fruit growth state.
Conclusions
In this study, by analysing a volume-based logistic model, fruit phenology was partitioned into 5 phases accurately and rationally. In terms of naming each phase, we provide more angles to generalize the development features of each phase with the names shape fast stretch (FS), shape stabilization (SS), tardy expansion period (TE), suspended expansion period (SE), and fast expansion period (FE). Compared to other growth parameters, volume displays development dynamics that are more detailed in each phase and are more universal for various materials with different fruit shapes.
