

Introduction
Materials and Methods
Plant Material
Cultivation of Plants and Morphological Characterization
DNA Extraction
PCR Protocol and SRAP Analysis
Data Scoring and Analysis
Results and Discussion
Morphological Characterization of the Melon Accessions
Genetic Diversity Findings based on SRAP
Conclusions
Introduction
Melon (Cucumis melo L.) is a diploid species belonging to the Cucurbitaceae family (2n = 2x = 24) (Yildiz et al., 2011; Napolitano et al., 2020). Melon is an annual, herbaceous, trailing or creeping plant (Lorenz and Maynard, 1988). This economically important crop has high nutritional value in terms of carbohydrates and vitamin A and is one of the major fruits grown in Turkey and other countries (Ermiş and Aras, 2017). Melon is cultivated in open and low tunnels, but production in modern greenhouses has recently gained popularity. Evaluation of local germplasm resources is of great importance for breeding and germplasm conservation efforts.
Turkey and Cyprus are located on the two important Vavilov’s plant genetic centers (Mediterranean and Near Eastern Centers). Cyprus is also situated on the crossroads of Europe, Asia, and Africa, and also on the Silk Road, which acted as a bridge during the past centuries connecting the East and the West. Therefore, Turkey and Cyprus are important sources of plant germplasm resources for wild plants and cultivated crops (Şehirali et al., 2005; Yılmaz et al., 2012).
Plant germplasm resources can be divided into two groups—the oldest existing local varieties and their wild relatives. Traditional local varieties and landraces are valuable resources because of their adaptation to the local climate and soil conditions. They also show better resistance to local pests and diseases and may have many other desirable attributes. Determining the morphological and molecular characteristics of traditional local varieties and landraces will further the development of genotypes that are resistant and/or tolerant to pests, diseases, salinity, drought, and other environmental stresses. Therefore, assessing the diversity of local germplasm collections is important for crop improvement (Yılmaz et al., 2012; Solmaz et al., 2016; Dal et al., 2017).
In this study, we evaluated melon accessions from different regions of northern Cyprus and some melon genotypes collected from Turkey. We first identified and characterized the morphological diversity among the local melon germplasm resources, and then compared their genotypes at the molecular level. Our findings provide valuable data for vegetable breeding programs and conservation of local germplasm resources.
Materials and Methods
Plant Material
In total, 32 melon accessions were collected. These included 19 melon genotypes from the Nicosia, Famagusta, Kyrenia, Morphou, and Lefke districts of Northern Cyprus collected from professional farmers, amateur vegetable producers, vegetable traders, sellers, and consumers. In addition, 4 hybrid melon cultivars and 9 local melon genotypes commonly grown in Turkey were also collected (Table 1).
Table 1.
Melon accessions used in the study and their regional locations
Cultivation of Plants and Morphological Characterization
The seeds of the melon accessions were sown in a peat–perlite soil mixture at a ratio of 3:1 and grown in a greenhouse in a multicell tray. When three to four leaves appeared, the seedlings were transferred to the greenhouse at 100–50 × 50–60 cm spacing. The plants were irrigated and fertilized as needed and pests and diseases were managed according to local practices. A drip irrigation system was used, and the plants were grown on trellises, and pruned as needed. The morphological characteristics of the melon accessions were determined according to the criteria of The International Union for the Protection of New Varieties of Plants (UPOV, 2006) and International Plant Genetic Resources Institute (IPGRI, 2003), using 52 traits, comprising 38 for fruit, 10 for leaves, and 4 for seeds (Table 2).
Table 2.
Characteristics of melon samples according to modified criteria from the Protection of New Varieties of Plants and Institute of Plant Genetic Resources for 52 identified traits
DNA Extraction
The cetyl trimethyl ammonium bromide (CTAB) method reported by Doyle and Doyle (1990) was used to isolate the DNA of the 32 melon genotypes. DNA concentrations were determined using a semi-automatic microplate reader (Power Wave HT, BIO-TEK Instruments, Inc., Winoos, VT, USA), and DNA concentrations were prepared at 10 ng·µL-1 for polymerase chain reaction (PCR) assays.
PCR Protocol and SRAP Analysis
The PCR was performed in a 15 µL volume of a master mixture containing (5 U/µL) Taq DNA polymerase, 20 ng genomic DNA, 1 × PCR buffer, dNTPs (2.5 mM), and MgCl2 (25 mM) (Gülşen et al., 2005). The amplification protocol was 1 cycle at 2 min at 94°C for denaturation; 5 cycles 1 min at 94°C; 35 cycles 1 min at 35°C; 1 min at 72°C; followed 1 min at 94°C for extension and 1 cycle 1 min at 35°C; 1 min at 72°C; and the final extension at 72°C for 10 min. PCR products were analyzed on a 2.5% agarose gel stained with ethidium bromide (EtBr) in Tris-borate EDTA (TBE) buffer visualized under UV light. For molecular characterization, 11 SRAP primer combinations were used for estimating the genetic distance among the 32 melon genotypes (Table 3).
Table 3.
SRAP primer combinations used in the study
Data Scoring and Analysis
The gel images were evaluated, and the band sizes from each primer pair were recorded in Table 4. The values were given as (1) in the presence of the DNA band and (0) in the absence of the DNA band and the binary matrix dendrogram was prepared using NTSYS ver. 2.11 [Exeter Software; Rohlf (2000)]. Only the reproducible bands were scored, and any differences in band intensity were not considered. The level of diversity determined using UPGMA (Unweighted Pair Group Method Arithmetic Average) groupings of similarity matrix with SAHN (sequential, agglomerative, hierarchical, and nested clustering) according to Rohlf (1998). Results of each characteristic for the genotypes were transformed into standardized units. PAST3 was used for the principal component analysis (PCA).
Table 4.
Size ranges (bp), the total number (n) and number of polymorphic bands (np), and percentage of polymorphism (% P) of SRAP primers among the melon accessions
Results and Discussion
Morphological Characterization of the Melon Accessions
Descriptive statistics for the studied characteristics are shown in Table 5. A remarkable variability was observed among the accessions. This high variation may further the progress of selection studies. We observed the highest variation in fruit length (FL) and the smallest variation in the abscission of the peduncle (BFH). In addition, the diameter of the fruit (FD) was highly variable. Based on these results, the standard deviation values of the characteristics were quite high among the accessions.
Table 5.
Statistics for the studied characteristicsz
| Characteristic | Mean | SDy | Characteristic | Mean | SDy |
| FL | 185.75 | 41.19 | IBC | 3.31 | 3.36 |
| FD | 134.25 | 22.87 | CC | 1.75 | 1.22 |
| FLDR | 1.41 | 0.39 | ICC | 3.44 | 1.97 |
| FWS | 1.69 | 0.69 | MFMWCS | 5.50 | 1.14 |
| SFL | 3.28 | 1.51 | MSTCS | 4.63 | 1.64 |
| MFFC | 3.00 | 1.08 | FC | 1.81 | 0.78 |
| GDMP | 5.50 | 1.52 | FCD | 4.69 | 1.45 |
| SCS | 4.00 | 3.93 | Weight | 1.94 | 0.62 |
| DSCS | 0.69 | 0.93 | FMES | 2.06 | 0.76 |
| DP | 2.31 | 2.89 | SS | 6.06 | 1.68 |
| DS | 2.31 | 2.89 | SHES | 1.41 | 0.50 |
| FHL | 5.06 | 1.64 | CSS | 1.41 | 0.50 |
| FHFF | 4.69 | 1.26 | SC | 1.72 | 0.46 |
| BFH | 9.00 | 0.01 | MT | 4.69 | 1.45 |
| EBFH | 5.38 | 1.86 | CT | 6.31 | 0.90 |
| BS | 2.19 | 0.78 | NL | 3.16 | 0.45 |
| STS | 2.22 | 0.66 | LSS | 5.22 | 1.82 |
| SR | 4.19 | 1.12 | LBGC | 4.74 | 1.64 |
| G | 7.50 | 3.17 | DLLL | 3.96 | 1.40 |
| MWBC | 3.38 | 2.25 | LBELL | 3.85 | 1.43 |
| WG | 3.38 | 2.20 | LTL | 3.25 | 1.23 |
| DG | 2.31 | 2.26 | LL | 4.06 | 1.90 |
| CS | 3.63 | 2.51 | PL | 2.90 | 1.06 |
| BF | 6.50 | 3.77 | LHC | 4.44 | 1.90 |
| TBL | 3.06 | 3.22 | LHL | 5.04 | 1.75 |
| FBF | 1.78 | 1.39 | LBB | 5.97 | 1.89 |
zAbbreviations as in Table 2.
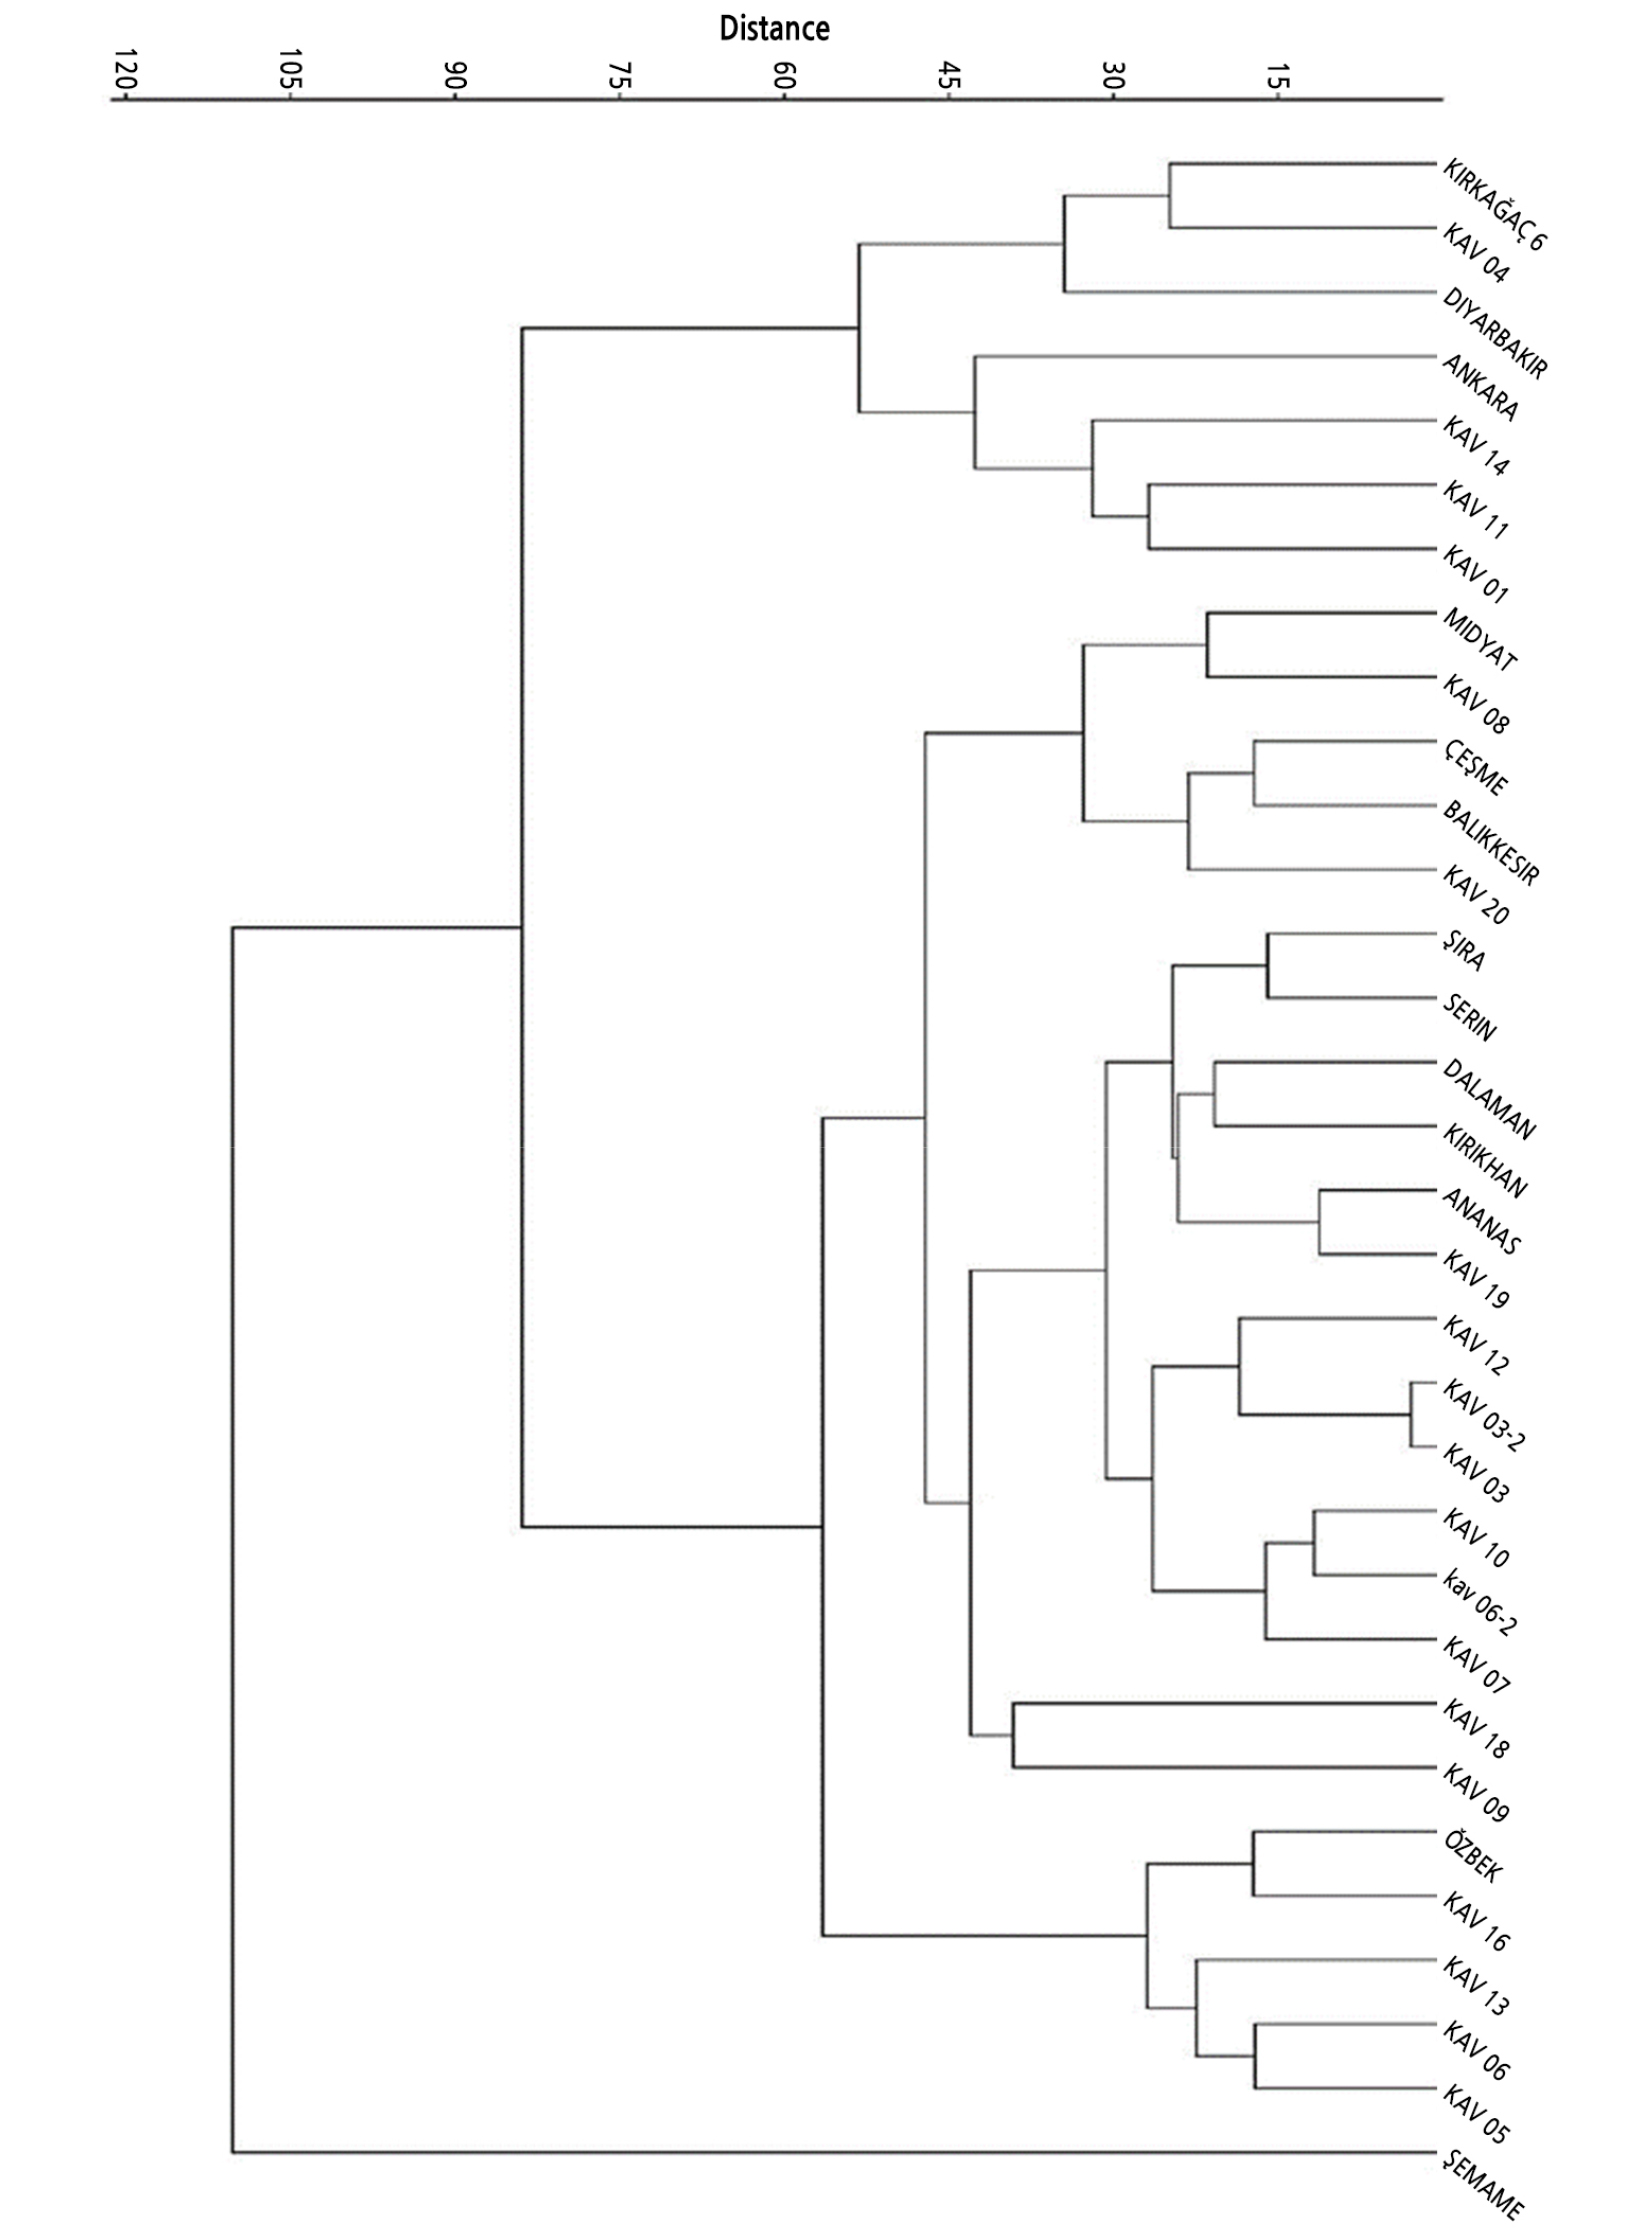
A dendrogram was generated using 52 morphological traits in 32 melon accessions according to UPOV criteria, and between 15 and 120 similarities were found among the accessions. According to the dendrogram based on all morphological data, the melon accessions were divided into three major clusters (Fig. 1). The first major cluster comprised only one genotype, Şemame, which was separate from all others. The second comprised 24 accessions with genotypes Midyat, KAV 08, Çeşme, Balıkesir, KAV 20, Şıra, Selin, Dalaman, Kırıkhan, Ananas, KAV19, KAV 12, KAV03, KAV03-2, KAV 10, KAV 06-2, KAV 07, KAV 18, KAV 09, Özbek, KAV 16, KAV 13, KAV 06, and KAV 05. The KAV03 and KAV03-2 genotypes were very similar to those in the third cluster. The third major cluster comprised genotypes Kırkağaç, KAV 04, Diyarbakır, Ankara, KAV 14, KAV 11, and KAV 01. A similar result was reported by Ermiş and Aras (2017) who divided 64 melon genotypes into 3 main groups based on their morphological traits and determined that the genetic distance among the 64 melon varieties was between 0.96 and 0.16. On the other hand, Köse (2008) classified melon genotypes into 4 main groups based on 14 quantitative morphological traits.
According to the results of PCA, 13 PCs (PC1 to PC13) with Eigenvalues > 1 accounted for the individual variance and contributed 88.385% of the total variation in the genotypes (Table 6). The proportion of total variation explained by these PCs, more than 2/3, was used for the next step. The percentages of the cumulative variation accounted for by each of the five PCs are 20.699, 13.929, 10.356, 8.345, and 6.874%.
Table 6.
Eigen values and percentage of variation for each principal componentz
The coefficients defining the five PCs of these data are provided in Table 7. The first PC showed the highest variability in the data on succeeding components. The value of any character in the first PC has never been > |0.3|; however, in this study, no character in the first PC reached this value. PC1 had a high value for leaf blade size (LSS) (|0.27|) and green leaf blade (LBGC) |0.26|. In the second PC, number of carpels (CT) and plant growth (NL) (|0.31|) were the prominent characteristics. In the other three PC groups, the characteristics that reached |0.3| were as follows: grooves (G) (|0.35|), color of grooves (CC) (|0.31|), and intensity of CC (ICC) (|0.30|) in PC3; weight (|0.31|) in PC4; and FL (|0.39|), time of ripening (MT) (|0.33|), and fruit length/diameter (FLDR) (|0.31|) in PC5. These nine traits (from PC1 and PC5) represent a high PC value for determining genetic diversity. PCA reduces the complexity of the data by transforming the number of correlated variables into a smaller number of variables. The results of our study suggest that the genetic variability of this melon collection can most likely be determined by selecting these nine characteristics.
Table 7.
Characteristics with an Eigenvalue ≥ |0.3| in the first five principal components (PCs)z
| PC1 | PC2 | PC3 | PC4 | PC5 |
| CT (|0.311|) | G (|0.351|) | Weight (|0.312|) | FL (|0.392|) | |
| NL (|0.311|) | CC (|0.302|) | FLDR (|0.314|) | ||
| ICC (|0.310|) | MT (|0.330|) |
zAbbreviations as in Table 2.
The bi-plot from the PCA is presented with the 52 characteristics in Fig. 2. In the PCA graph, the characteristics for TBL, IBC, and FBF are clustered together (Fig. 2). In addition, BFH and FCD are grouped with high Eigenvalues in PC2.
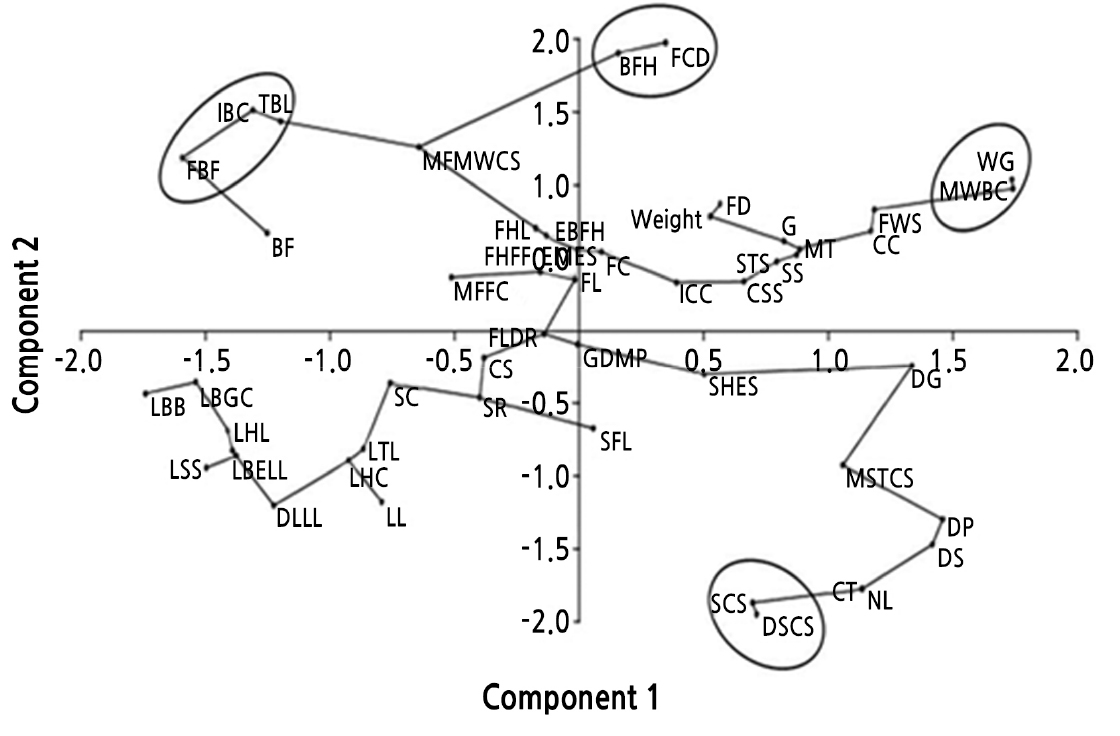
Fig. 2.
Distribution of observed characteristics based on the first and second principal components (Abbreviations as in Table 2).
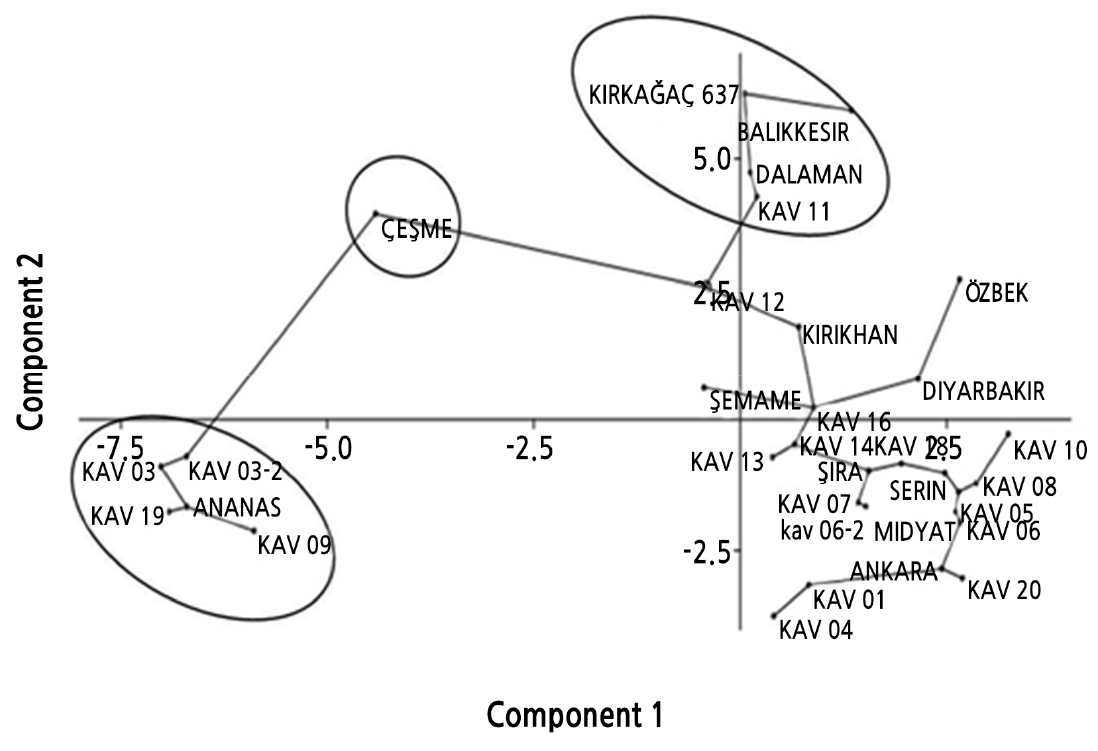
The projections of all melon genotypes in a two-dimensional graph are provided in Fig. 3. PC1 and PC2 coordinates of the PCA implemented using morphological data accounted for 34.63% of the diversity. Based on the PCA, three main groups were created (Fig. 3). The first group comprised Kırkağaç 637, Balıkesir, Dalaman, and KAV 11 genotypes. The second comprised KAV 03, KAV 03-2, KAV 19, KAV 09, and ANANAS genotypes. The third group comprised from other melon genotypes.
Genetic Diversity Findings based on SRAP
Eleven SRAP markers combinations were used for assessing the genetic diversity among the 32 melon genotypes (Table 3). The 11 SRAP markers produced 81 amplified fragments (alleles) with a mean of 5.1 alleles per primer, and 56 of these were polymorphic. The percentage of polymorphism was 100% with two primers-ME 8-EM 16 and ME 12-EM 16. The amplified DNA fragments ranged from 140 to 1,200 bp. The percentage of polymorphic bands ranged from 25 to 100%, with an average of 70.1% (Table 4). Many studies have been conducted on the molecular and morphological diversity among melon genotypes, including in Turkey. Yildiz et al. (2011) studied the percentage of polymorphism in 63 melon (C. melo L.) genotypes using RAPD, ISSR, and SRAP markers, and reported that the average similarity between any two pairs of genotypes examined was estimated by a molecular variation of 0.73 ± 0.48 and ranged between 0.46 and 0.96 within-group genetic similarities. Chen et al. (2010) assessed the genetic diversity of 61 melon accessions using 16 SRAP primer combinations and reported 265 polymorphic bands.
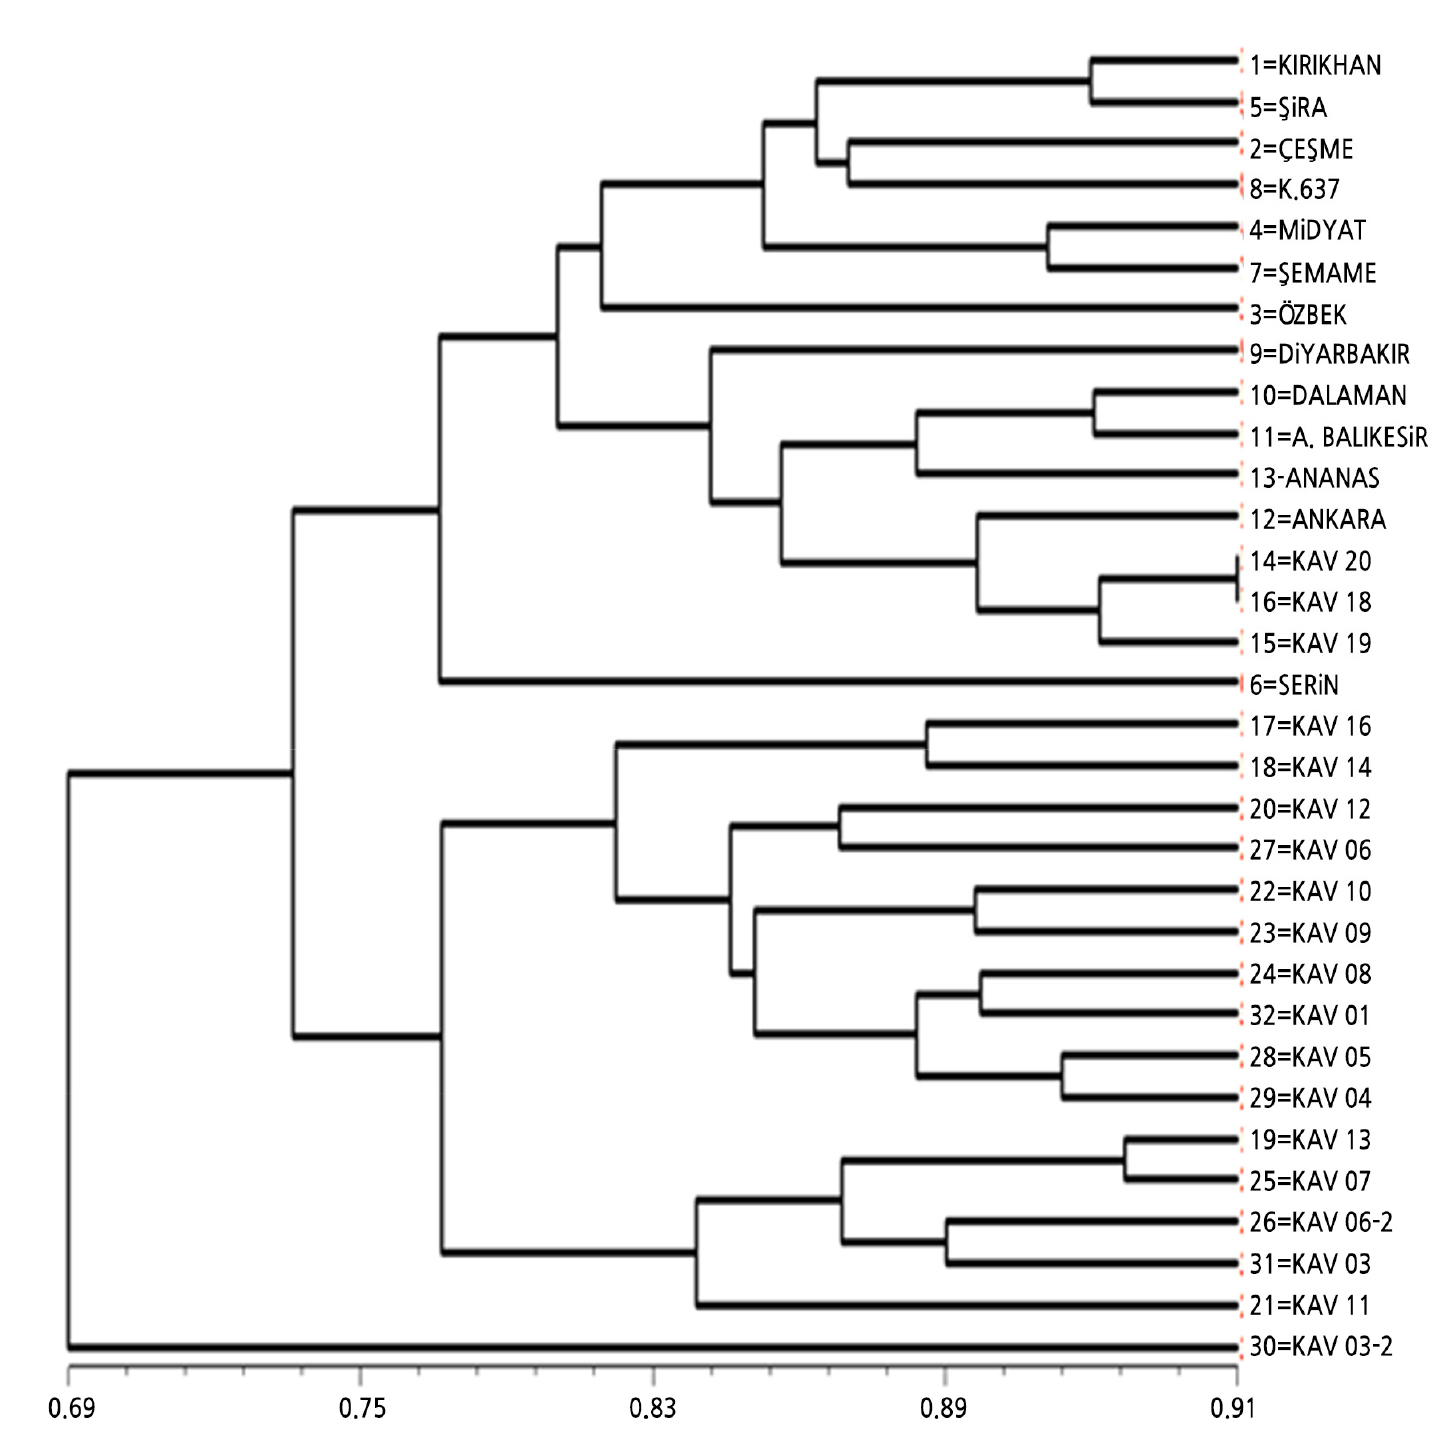
A dendrogram was created using the 11 SRAP primers, given in Fig. 4. Cluster analysis showed that there is high genetic variation among the genotypes. The polymorphism rate ranged from 0.69 to 0.96%. The melon genotypes were divided into two major clusters based on the SRAP data (Fig. 4). The first major cluster comprised only one genotype, KAV 03-2. KAV 20 and KAV 18 genotypes were similar as molecular data (Fig. 4).
Genetic characterization in melons has been conducted using different molecular markers, including RAPD, SRAP, SSR, and ISSR markers (Garcia-Mas et. al. 2000; Kohpayegani and Behbahani, 2008). Sensoy et al. (2007) used 109 polymorphic RAPD markers obtained from 33 primers to assess the genetic diversity in 56 Turkish melons (C. melo L.) with 23 foreign melon genotypes. Their results showed that Turkish melon germplasm, with broad genetic diversity, may play an important role in the preservation of melon genetic diversity. Kohpayegani and Behbahani (2008) evaluated the genetic diversity of the melon collection from Iran with 15 SSR markers and showed 87% polymorphism. A study by Solmaz et. al. (2016) using 31 SRAP markers on 93 watermelon (Citrullus lanatus) genotypes from Turkey found 97.3% polymorphism.
Idehen (2017) used SRAP markers to discriminate 50 ‘Egusi’ melon accessions from different parts of Nigeria. At the end of the study, 65.48% of the bands were found to be polymorphic with similarity coefficients of the accessions ranging from 0.51-0.96 (Idehen, 2017). Wang and Wang (2011) analyzed polymorphism in 12 stiffen muskmelons, 30 thick-skin muskmelons, and two wild melon accessions using SRAP markers. They found that 10 pairs of primer combinations amplified 166 bands, and 104 of them were polymorphic. The genetic distances of the accessions were between 0.08 and 0.79 (average 0.375), and the 54 Cucumis melo accessions were divided into two groups: 1 India wild melon and 3 Hami melons; the other group was divided into two sub-groups, the first was 12 Cucumis melo sp. conomom, the second was 1 China wild melon and 37 Cucumis melo sp. melo.
Conclusions
Determining the genetic variation and morphological characteristics of local melons is important in breeding programs. Here, we characterized the genotypes of melons selected from northern Cyprus and some melon genotypes selected from Turkey and determined their potential to be used in a breeding program. The results of our study suggest that there could be an opportunity in breeding programs for creating more environmentally viable and disease- and pest-resistant plants.
