

Introduction
Materials and Methods
Field Information and the Device for Image Collection
Image Collection and Analysis
Results
Image Characteristics from Ideal Strawberry Image
Strawberry Volume Estimation Using Image Processing
Validation of the Volume Estimation Model Using Image Process
Application of the Fresh Weight Estimation Model
Introduction
The volume produced from crop plants is generally based on fresh weight after harvesting or dry weight measurements. Non-destructive methods of measuring volume not only reduce the loss of crop yields, but also enhance the efficiency of volume surveys. Image processing techniques can be utilized as a nondestructive method of examining volume without coming into direct contact with crops. They can also be used to diagnose the incidence of pests or physiological disorders affecting crops. Image processing provides volume information rapidly and accurately, and enables continuous, repeated measurements.
Image processing has been widely utilized for the analysis of plants and animals. Images are first acquired using an analog or digital camera, and various image processing techniques can be applied during image analysis, which can then be classified using statistical and identification procedures. Xu and Zhao (2010) developed an algorithm that uses image processing to automatically grade strawberries according to their size, shape and color. This algorithm obtains the cross-section of strawberries from green and blue values in the RGB color space and has a detection error smaller than 5%, a color grading accuracy of 88.8% and a shape classification accuracy above 90%. The average time the program took to grade one strawberry was three seconds.
Cho et al. (2006) developed a device that measures the size and shape of red peppers from images. Through histogram analysis using green values only, they achieved an average accuracy of 86%. Costa et al. (2011) proposed an automated shape processing algorithm after comparing various image processing techniques used on agricultural products. Other research has employed digital image processing to estimate the volume of lettuce (Jung et al., 2015), oranges (Sayinci et al., 2012) and tomatoes (Campillo et al., 2008).
Physical properties of fruits (i.e. mass and volume) are the most important parameters for classification of product quality and quantity. Researchers estimated the mass of various agricultural products like fruits using modeling techniques (Tabatabaeefar, Rajabipour, 2005; Khoshnam et al., 2007; Naderi-Boldajia et al., 2008); however, measurement of fruit mass was limited in realtime without contact of fruit directly (Khoshnam et al., 2007). For real-time measurement, sorting the quality of fruit based on volume may prove to be a more efficient method than sorting the quality of fruit based on mass.
The water displacement method (WDM) is a volumetric measurement of objects. Mohsenin (1970) reported that the WDM was one of the simplest measurements for the volume of objects such as fruits and vegetables. The actual volume was measured as the mass of displaced water after dipping a fruit into a water-filled container divided by water density. The calculation for the volume of a conical frustum can be found in mathematics handbooks for dimensional analysis and modeling (Szirtes, 2006), and by using imaging processing based on this mathematical method, Khojastehnazhand et al. (2009) calculated the lateral surface area on volume of a conical frustum.
Omid et al. (2010) developed an image processing technique to measure the volume and mass of citrus fruits such as lemons, limes, oranges and tangerines. They used two CCD cameras to calculate the volume of the fruits. The calculated volumes were in good agreement with the actual volumes determined by WDM. The coefficient of determination (R2) for fruits between actual volume and calculated volume were 0.96 to 0.98. Additionally, by estimating the volume, the method of calculating the volume of the fruits was 90-96% accurate in fruit mass estimation. In other words, if the fruit density is assumed to be constant, it is possible to estimate the volume of fruits in a non-destructive manner through the detailed analysis of external features.
While information can be conveniently retrieved from images taken with a smartphone, the analysis may not be accurate due to the intensity of surrounding light, the angle of image capture, and shadows. Kim (2014) proposed a Gaussian-based denoising algorithm based on frequency domain analysis to overcome the limit of processing performance
This study presents a non-destructive image processing method to estimate the volume of strawberries. Strawberries have 200 to 400 seeds uniformly distributed on their surfaces that create a pattern. We hypothesized that changes in the regularity of this pattern can be used to derive dimensional information, which can be difficult to obtain from cross-sectional observations. The purpose of this study was to develop a model to estimate the volume of fruits based on images captured with a smartphone camera and to validate the proposed model for strawberries.
Materials and Methods
Field Information and the Device for Image Collection
study was performed on ‘Seolhyang’ strawberries(Fragaria x ananassa Duch) grown on a strawberry farm in Nodonggu, Gadeok-myeon, Cheongju-si, Chungcheongbuk-do. Ten strawberries were randomly selected every week for eight weeks from March 17 to April 19 2016. Mass and volume measurements were taken from images captured with a smartphone. The smartphone used in this study was a Galaxy Note2 (SM-N910S, Samsung, Korea), which had the following specifications: Processor, 1.6 GHz Quadcore CPU; Memory, 2 GB; Pixel density, 267 ppi; Camera, 8 megapixel; Resolution, 1280 × 720. The fruit was placed on a piece of graph paper and adjusted such that it took up the same area in each image. The smartphone was 20 cm away from the fruit during image capture. The fresh weight of strawberries was measured using an electronic scale (Model CB-120, A&D Electric Balance, CA, USA). The size of the fruit was measured using a Vernier caliper (530-101, Mitutoyo, Japan) with the plane divided into the longitudinal and lateral axes. Length measurements in the lateral axis were divided into major and minor axes. The volume was measured using the water displacement method, which involves dipping a strawberry in a water-filled beaker and measuring the amount of water that overflows, as given by Eq. 1.
V =Wa-Ww/γω =Wbfw-Wbw/γω =Wd/γω (1)
where,
V is the volume of the object,
Wa is the weight of the object in air,
Ww is the weight of the object in water,
Wbfw is the total weight of the beaker, water and object
Wbw is the weight of the beaker and water
Wd is the weight of the overflowed water and
γω is the specific weight of water ( 9,810 N/m-3).
Image Collection and Analysis
Seeds on the surface of strawberries form regular patterns and changes in their sharpness and regularity may be observed depending on the volume of the strawberry. To examine the periodicity of patterns, the pwelch function provided in MATLAB 7.10.0 (Mathworks, MA, USA) was used. This frequency spectral density function converts the regularity of spatial distribution to the frequency space and gives the size of the energy by frequency. RGB values for strawberry seeds were retrieved after converting the background of the images to black and white, and excluding the red area of the fruit. The seeds were replaced with white dots in the processed images to emphasize the periodicity information. After false coloring the strawberry surface and background black, random noise was inserted to reduce the size of spatial frequency that arose from the black background.
Results
Image Characteristics from Ideal Strawberry Image
Fig. 1 shows three snapshots of strawberry surfaces at different growth stages. As the growing days increased, the clearness, number and periodicity of seeds increased. Our initial hypothesis was constructed by visual and qualitative inspection on those images, and asked if there is a significant relationship between topological distribution of seeds on surface of strawberries and phenotypic information of relationship between seed distribution. Thus, this study assumed that the sharpness and regularity of seeds form a proportionate relationship to the volume of the fruit. Basic experiments were conducted, as shown in the figure, to determine the characteristics of images before image processing. Fig. 2 shows the three ideal images that mimetically express the sharpness and regularity of seeds. From Fig. 2A to 2C, the periodicity, sharpness and regularity were varied to observe changes in the volume of the fruit. The results from image analyses produced by applying the pwelch function to Fig. 2 are given in Fig. 3. An examination of spatial frequencies, which correspond to the phenotypic information of seeds, shows an increase in volume with periodicity and sharpness. Fig. 4 shows the procedures involved in this process. In Fig. 4A, the reflected light on the surface made it difficult to distinguish the fruit from the background. Fig. 4B illustrates that lowering the tone and applying a histogram equalization to emphasize the surface resolved this issue of contrast. In Fig. 4C, to retrieve color values, the impixel function of MATLAB was applied to the area recognized as seeds. The range of RGB values was 0.04 < red < 0.80 for red, 0.15 < green < 0.4 for green and blue < 0.30 for blue. Using these ranges, the strawberry seeds were extracted as shown in Fig. 4D. Based on the extracted images, the periodicity of the strawberry seeds was analyzed by first applying the FFT2 function in MATLAB to derive spatial frequency components, followed by the surf function to determine the location of the largest data value. The corresponding frequency and spectral density were obtained using the pwelch function, and correlational analysis was performed to examine the relationship of seed precocity to fruit volume. The noise processing was performed on the background to remove periodicity, and the periodicity of the seeds was obtained by again applying the FFT2 function followed by the pwelch function.
Fig. 1.
Comparison of number and size of seeds during the fruit development of ‘Seolhyang’ strawberry. The first day of harvesting period on measurement (A), 27 days after the beginning of measurement (B), and 62 days after the beginning of on measurement (C).
Fig. 2.
Prepared ideal images to represent different frequency, clearness and size of seeds that correspond to strawberry growth stages. Relatively lower frequency, clearness and smaller size (A), middle frequency, clearness and size (B), and relatively higher frequency, clearness and larger size (C).
Strawberry Volume Estimation Using Image Processing
Table 1 shows the volume and weight measurements from 80 strawberry samples with variation of volume at harvest stage. A frequency domain analysis was applied to construct the initiative image processing algorithm as proposed by Kim (2014).
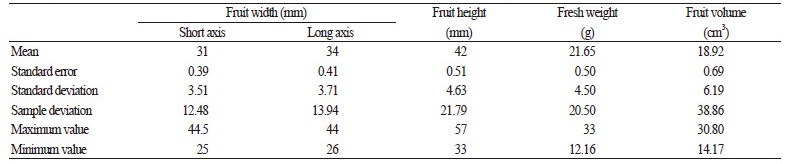
Fig. 3.
Plot of the log scaled power spectrum calculated by the pwelch function according to the prepared three ideal images from Figure 2.
Fig. 4.
Illustration of the image processing procedure for seed recognition. Original image (A), enhanced image using histogram equalization (B), manual identification of seed area using the impixel function in matlab (C), binary image of seed by thresholding the RGB range (D) (0.04 < R < 0.80, 0.15 < G < 0.40, B < 0.30 ).
Fig. 5.
Illustration of how the power spectrum density of the major component in frequency domain was determined. Point (1) denotes the highest value in the two-dimensional frequency domain, point (2) denotes the power spectrum density derived by point (1).
Fig. 6.
Illustration of the image processing procedure for enhancing seed frequency. White spots replaced strawberry seeds corresponding to location on and size of the fruit (A); background removal including non-seed area on strawberry surface (B); and the embedded random noise for lowering frequency power of the background (C).
The experiment was performed using by removing the image background to extract the strawberry seeds, and applying the pwelch function to determine seed periodicity (Fig. 7). The pwelch function presents the periodicity of the data based on average values of seed periodicity. Relatively large values at the three points indicate a strong periodicity. The normalized frequency over 3 on seed periodicity can be neglected as they are close to zero.
Correlational analysis was performed for relationship between the frequency intensity of the three points and the volume of the fruit (Fig. 8). The coefficient of determination R² at the first point was 0.0241 and the equation was y = 0.0372x + 5.2789, where y is the volume of the fruit, and x is the distance between seeds (Fig. 8A). The coefficient of determination R² at the second point was 0.0217, and the equation was y = 0.0289x + 5.8438 (Fig. 8B). Finally, the coefficient of determination R² at the third point was 0.0108, and the equation was y = 0.1028x + 9.2726 (Fig. 8C).
Since an R² value close to one indicates a strong correlation, the frequency intensity at the three points are not always found to correlate to the fruit volume because the background was not completely removed when extracting the strawberry seeds. Furthermore, the strong periodicity of the black areas resulted in the strawberries having a relatively weaker seed periodicity on analysis.
To resolve the issue of the background not being completely removed from the images, the second analytical method was employed. The experiment was conducted with a total of 80 data values, with 40 used to predict the volume of strawberries based on image processing, and the remaining to validate the estimation formula. The images were converted to black and white and the strawberry seeds were replaced with white dots. In this way, the unnecessary background was removed from the images, allowing the strawberry seeds to be easily extracted by the program. The pwelch function was used to calculate the seed periodicity of the extracted images, and the correlation to the fruit volume was analyzed for all sections (Fig. 9).
Fig. 7.
The select magnitude of power spectrum density for correlation analysis using the volume of strawberries (arrows point to the selected power magnitude).
Fig. 8.
Scatter plots indicating the insignificant relationship between power magnitude of frequency and strawberry volume. The first power magnitude (A), the second power magnitude (B), the third power magnitude (C).
Between the two points with a coefficient of determination close to one, the first point was the periodicity of seeds in the y (circumference) direction and the second point is the periodicity of seeds in the x (length) direction.
Correlational analysis between the periodicity of strawberry seeds and volume at the first point (Fig. 10A) gave an R² of 0.8346 and showed a negative correlation (y = −4257.7x + 42.722). For the second point (Fig. 10B), the R² was 0.8946 and established a positive correlation (y = 1067.9x + 8.2903). The larger the volume of the fruit, the smaller the distance was between seeds at the periphery in the y (circumference) direction. The negative relationship between volume and seed distances is causes the periodicity to decrease, resulting in a negative correlation between seed periodicity and fruit volume. However, the seeds grew more distinct in the x (length) direction when the volume of the fruit increased, and a positive correlation was established due to the negligible decrease in periodicity in the y direction.
Fig. 9.
Select magnitude of power spectrum density for correlation analysis with strawberry volume (arrows point selected power magnitude).
Fig. 10.
Scatter plots between power magnitude and strawberry volume. Strong negative correlation with the first power magnitude (A), strong positive correlation with the second power magnitude (B).
Validation of the Volume Estimation Model Using Image Processing
The x-axis, y-axis and their average were verified with the correlation formula to compare the actual fruit volume to the volume obtained from image processing. A comparison of the estimated volume and actual volume obtained from the y-axis correlation formula (y = 0.6144x + 26.34) gave an R² = 0.7439 (Fig. 11A). A comparison of the two volumes using the x-axis correlation formula of y = 1.7271x - 10.103 gave an R² = 0.8662; thereby establishing a positive correlation of the actual volume and estimated volume in the y-axis (Fig. 11B). The R² = 0.6027 when y = 1.421x – 4.3784; the average of the two axes was used to compare the estimated and actual fruit volumes (Fig. 11C). The good correlation was found between the actual volume and estimated volume in the y-axis with an R² = 0.7439, but this was inadequate for calculating the fruit volume because of the negative correlation between the actual volume and estimated volume. The correlation between the volume obtained using the average of the two axes and the actual volume was 0.6027. There was a very high correlation between the estimated volume in the x-axis and the actual volume, with an R² = 0.8662. The correlation formula y = 1.7271x – 10.103 was derived using the periodicity of seeds in the x-axis and was deemed suitable for volume estimation.
Application of the Fresh Weight Estimation Model
Correlation analysis was performed between the fruit volume and the fresh weight (Fig. 12A), which produced to the correlation formula z = 0.6845y + 9.11 and an R² = 0.7067 (z: strawberry fresh weight, y: strawberry volume). We estimated the fresh weight by processing the images of eight samples with the smallest standard error of calibration (SEC).
When the volume estimation model was cross-validated with fresh weight, the R² = 0.9348 (n = 40) (Fig. 12B). In general, models that estimate fresh weight based on volume have many constraints and improving the accuracy of volume-based fresh weight models will enhance the accuracy of fresh weight estimations. We stated that additional studies were needed to support these results. The fresh weight estimation appears promising for rapid, efficient estimation of fruit weight. Results from this study were conducted for the strawberry species ‘Seolhyang’ and with a relatively small number of observations; therefore, it will need to be repeated with more extensive sampling across various strawberry species to confirm the application of the methodology.
This study aimed to estimate the volume of strawberry fruits based on phenotypic information acquired with smartphones. By analyzing the frequency of seeds on the surface of strawberries, this study found a significant relationship between seeds distributed in the lengthwise direction and overall volume of the fruit. For this technique to be utilized on farms, the performance of the volume estimation model should be improved through optimization of the image processing algorithm and further research on proxy variables. Moreover, it is essential to develop a fresh weight estimation model that relies on phenotypic information.
Fig. 11.
Scatter plots between estimated and measured fruit volume. Frequency analysis in the y direction (A), frequency analysis in the x direction (B), and frequency analysis in both the x and y directions (C).
Fig. 12.
Relatively strong positive correlation illustrated by scatter plot between measured volume of fruit and measured wet weight of fruit (A) and scatter plot between measured and estimated wet weight of fruit using image processing (B).
