

Introduction
Materials and Methods
Plant Materials and Growth Conditions
Characteristics of Light Sources and Light Spectral Analysis
Measurements of Chlorophyll Fluorescence Parameters
Measurement of the Single-leaf CO2 Assimilation Rate and Stomatal Conductance
Measurement of Single-leaf Photosynthesis and Canopy Apparent Photosynthesis
Measurement of Light Transmission through the Leaves
Growth Measurements, Experimental Design, and Statistical Analysis
Results
Growth and Development of petunia
Single-leaf Chlorophyll Fluorescence Parameters
Single-leaf Gas Exchange Parameters
Comparison of Single-leaf and Canopy CO2 Assimilation Rates
Single-leaf Light Transmission
Discussion
Introduction
Light emitting diodes (LED) have become a favorable choice as an artificial light source in various types of controlled plant cultivation systems because of its energy efficiency, long lifetime, and low heat emission (Bourget, 2008; Watanabe, 2011; Fujiwara, 2016). Because blue and red light is more effectively absorbed by photosynthetic pigments than green light, various LED systems producing only red and blue light have been designed and widely used (Massa et al., 2008; Yamori, 2016). However, numerous studies have found that white light is either comparable to or more effective than red-blue (RB) LED light in promoting whole-plant growth (Massa et al., 2008).
Reports regarding the effect of RB and white lights on crop growth have shown conflicting results. In tomato and chrysanthemum, growth under white light, produced by dysprosium and fluorescent lamps, was comparable to growth under RB (1:1) LED light at the same light intensity (Xiaoying et al., 2012; Kim et al., 2004b). In lettuce, Lin et al. (2013) reported that fresh and dry weights of plants grown under RB LED light were not significantly different from those grown under white fluorescent light. Contrary to this, Watanabe et al. (2011) reported that lettuce grown under RB (9:1) LED light had more than twice the fresh weight of those grown under white fluorescent light at the same light intensity. In another study, radish and spinach grown under cool-white fluorescent lamps had higher total dry weight than those grown under red LED light mixed with blue fluorescent light (9:1), whereas the dry weight of lettuce grown under these light treatments was not significantly different (Yorio et al., 2001). Mints grown under RB (7:3) LED light exhibited higher fresh and dry weight than those grown under white LED light (Sabzalian et al., 2014). Evidently, these contradictory results could be explained by the differences in plant species, the spectrum of RB lights, and the proportion of red and blue light used in each experiment.
Studies on the effect of RB and white light on photosynthesis have also shown mixed results. In chrysanthemum, the net photosynthesis rate of plantlets measured under RB (1:1) LED light was higher than in plants measured under white fluorescent light (Kim et al., 2004b). In radish, spinach, and lettuce, single-leaf photosynthesis was not significantly different between plants grown under RB or cool white fluorescent light (Yorio et al., 2001; Kim et al., 2004a). In contrast, single-leaf net photosynthesis of cherry tomato plants measured under RB (1:1) LED light was higher than in plants measured under white light from dysprosium lamps when the light intensity exceeded 100 μmol·m-2·s-1 (Xiaoying et al., 2012). In the same study, no significant differences were observed in the maximum quantum efficiency of PSII (Fv/Fm), whereas the operating efficiency of PSII (ϕPSII) was higher in the plants grown under RB LED light. In Withania somnifera plantlets, single-leaf photosynthesis measured under RB LED light was higher than when measured under white light from fluorescent lamps (Lee et al., 2007), but no significant differences were observed in stomatal conductance, suggesting that differences in the photosynthetic rate were not due to a limitation of gas exchange through stomata. Mint plants grown under RB (7:3) LED light had higher single-leaf photosynthetic rates than those grown under white LED light (Sabzalian et al., 2014).
In many cases, the effects of RB and white LED light on single-leaf photosynthesis is not consistent with growth (Yorio et al., 2001; Kim et al., 2004b; Lee et al., 2007; Xiaoying et al., 2012), which may be explained by the notion that single-leaf photosynthesis may not represent photosynthesis at the whole-plant level (Yorio et al., 2001; Yamori, 2016).
Light quality affects flowering in various aspects. In Cyclamen persicum plants grown under RB LED light (10 h per day) or white fluorescent light (12 h per day) for 63 d had a similar number of flower buds, while those grown under RB LED light had a much longer blooming period (Heo et al., 2003). Far-red (FR) light stimulates flowering in Arabidopsis and petunia (Lee and Amasino, 1995; Haliapas et al., 2008). Moreover, a high ratio of red:far-red light delays flower initiation and inhibits flower development in some plants (Runkle and Heins, 2001). This is in accordance with a recent report showing that a reduction in the red:far-red light ratio promotes flowering of petunia ‘Madness Rose’ plants (Park et al., 2016).
Petunia (Petunia x hybrida Vilm.) is a popular ornamental plant worldwide and demands for petunia seeds and plants in the global market are high throughout the year. However, production of petunia plants is hindered by adverse environmental conditions, which are becoming more severe. Therefore, cultivation in a plant factory system, in which plants are grown under a controlled environment and artificial light (Kozai and Niu, 2016a), is needed in order to secure long-term productions of petunia seeds and plants. As the price of petunia seed is high and the environmental factors inside plant factories can be more readily controlled to facilitate flowering and pollination, it is practical to use plant factory for petunia seed production (Kozai and Niu, 2016b). Therefore, this study aimed to understand the effect of RB and white LED light on growth, development, and photosynthesis at both leaf and canopy levels of petunia plants. To the best of our knowledge, there are no reports comparing the effect of RB and white LED light on photosynthesis at the canopy level in petunia. Moreover, there are only a few reports comparing the effect of white and RB LED lights on plant growth. Results from this study provide useful information regarding artificial light sources for petunia cultivation and further insights into the relationship between photosynthesis and growth of plants under white and RB LED lights.
Materials and Methods
Plant Materials and Growth Conditions
Seeds of petunia ‘Purple’ were obtained from Ameriseed International Co., Ltd. (Sakhonwasee et al., 2017). Seeds were sown in a glass plate filled with peat moss for 7 d and then transferred to plug trays for 14 d. During this period, all seedlings were grown at 25°C under white LED light for 16 h per day (details in next section) with a photosynthetic photon flux density (PPFD) of 200 μmol·m-2∙s-1. Then, seedlings were transferred to 7.62 cm (diameter) plastic pots and grown under the same condition. One month after sowing, seedlings were transferred to 12.7 cm (diameter) plastic pots and grown under either RB or white LED light treatments with the same light intensity and photoperiod as above. The growth medium in the plug trays and the plastic pots consisted of peat moss, coarse sand, and coconut coir (1:1:2, v:v:v). Each plant was supplied with 200 mL of modified Hoagland’s solution (Epstein and Bloom, 2005) every other day.
Characteristics of Light Sources and Light Spectral Analysis
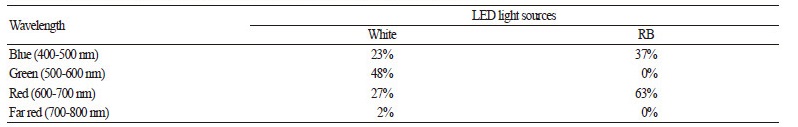
For the white light treatment, two types of T5 18 watt LED tubes, warm white (3,200 K) and day light (6,500 K) (Ledonhome Trading CO., Ltd., Bangkok, Thailand), were used at a 1:1 ratio. For the RB light treatment, a Shigyo T5 LED tube (Showa Denko K.K., Tokyo, Japan) containing both red and blue LED chips was used, which provided red light at a peak wavelength of approximately 660 nm (Fig. 1). The ratio of red and blue light intensity was approximately 2:1 (Table 1). The relative spectral irradiances of both LED treatments were analyzed by a spectroradiometer (CAS140CT EOP-146, Instrument Systems Co., Ltd., Germany) at the National Institute of Metrology, Thailand (NIMT) (Fig. 1). Photosynthetically active radiation (PAR) was measured using a PAR meter (101EG, Nippon Medical & Chemical Instruments Co., Ltd., Japan). The PAR meter was placed 10 cm under 2 LED light tubes of each treatment. The LED lights were placed 15 cm above the plants during cultivation.
Fig. 1.
Spectral details of the white and red-blue (RB) LEDs used in this study.
Measurements of Chlorophyll Fluorescence Parameters
Measurements of chlorophyll fluorescence parameters were taken once a week after the plants were exposed to light treatments for 26 d. There were 4 measurements taken at 56, 63, 70 and 77 days after sowing (DAS). The parameters were measured using a Fluorescence Monitoring System FMS2 (Hansatech Instruments Ltd., King’s Lynn, Norfolk, UK). Darkadapted parameters were measured after all plants had been kept in the dark for 30 min. The maximum quantum efficiency of PSII photochemistry [Fv/Fm or (Fm - Fo)/Fm] and PSII operating efficiency (F'm- F'/F'm orϕPSII ) were calculated according to Baker (2008).
Measurement of the Single-leaf CO2 Assimilation Rate and Stomatal Conductance
After exposure to each light treatment for 26 d, the single-leaf CO2 assimilation rate and stomatal conductance were measured weekly using an LCi-SD photosynthesis system (BioScientific Ltd., Hertfordshire, England). Three or four of the youngest fully-expanded leaves from 3 independently selected plants were selected for measurement in each light treatment. All measurements were carried out under a photosynthetic photon flux density of 200 μmol·m-2∙s-1. There were 4 measurements taken at 56, 63, 70 and 77 DAS. In each day, measurements were taken in the morning (9:00 am - 11:00 am) and afternoon (13:00 pm - 15:00 pm). Then, morning and afternoon CO2 assimilation rates were averaged to represent daily CO2 assimilation rate.
Measurement of Single-leaf Photosynthesis and Canopy Apparent Photosynthesis
In this experiment, petunia plants were grown continuously under white LED light at 200 μmol·m-2∙s-1 before measurements of single-leaf photosynthesis and canopy apparent photosynthesis (CAP) under either RB or white LED light. Measurements were taken 3 times at 40, 60 and 90 DAS. Single leaf photosynthesis was measured as single leaf CO2 assimilation rate using an LCi-SD as previously described. CAP was measured following the protocol of Liu et al. (2016). Petunia plants were placed in a glass chamber, 0.3 m × 0.4 m × 0.3 m (W × L × H), equipped with a small fan and sensors for measuring relative humidity and CO2. RB or white LED light was installed above the chamber. The PPFD at the top of the plant canopy was set at 150 μmol·m-2∙s-1 by adjusting the distance between the glass chamber and the LED light. When the lights were turned on, the CO2 concentration inside the chamber decreased linearly. The CO2 concentration data (μmol·m-3) was plotted against time (seconds) and the slope of a trend line was used to calculate CAP using the following equation:
CAP = slope × n/A
Where n is moles of air inside the chamber calculated using the formula n = PV/RT. P is pressure in kPa; V is volume of the chamber in m3; T is temperature in Kelvin; A is ground area of the chamber in m2. Four plants per treatment were used for measuring CAP. Measurements were taken in the morning (9:00 am - 11:00 am) and afternoon (13:00 pm - 15:00 pm) for 3 d. Morning and afternoon CAP values were averaged to represent daily CAP.
Measurement of Light Transmission through the Leaves
Petunia plants were grown continuously under white LED light for 2 months before the leaves were exposed to either white or RB LED light for measurement of light transmission by a PAR meter (101EG, Nippon Medical & Chemical Instruments Co., Ltd., Japan). RB or white LED light at 150 μmol·m-2∙s-1 was provided to the leaf and the PPFD value of blue (400-500 nm), green (500-600 nm), and red (600-700 nm) lights were recorded. The percentage of light transmission was calculated using the PPFD values of each light color measured at the leaf surface as 100%. Then, the sensor was placed underneath the youngest fullyexpanded leaf and the PPFD values of each color were recorded and used for calculating the percent of leaf light transmission. During all the measurements, a transparent acrylic plate was placed over the leaf to ensure that it was flat. Five leaves from 3 independent plants were used for the measurements; each leaf was measured twice under white and RB LED light.
Growth Measurements, Experimental Design, and Statistical Analysis
Shoot fresh weight, shoot dry weight (obtained after samples were incubated at 95°C for 3 d), canopy width, canopy height, and number of flowers were recorded after 2 months of light treatment. A completely randomized design was used for the experiment. One-, two-, and three-way ANOVA tests (p <0.05) were performed using SPSS 22.0 (SPSS Inc., Chicago, IL, USA). Data are reported as mean ± standard error (SE). Significant differences among means were determined by t-test and Tukey’s post hoc test (p < 0.05) in SPSS 22.0.
Results
Growth and Development of petunia
Petunia plants grown under white or RB LED light for 2 months had similar shoot fresh weights whereas the dry weights of the shoots were significantly higher in the plants grown under white LED light. The development of petunia plants was affected by the LED light quality as differences in canopy width and height were observed between the treatments; plants cultivated under white LED light exhibited an expanded and loose canopy, whereas those cultivated under RB LED light were more compact (Fig. 2 and Table 2). Petunia plants grown under white LED light flowered faster and had more flowers than those grown under RB LED light (Table 2).
Single-leaf Chlorophyll Fluorescence Parameters
The single-leaf PSII operating efficiency (ϕPSII) of petunia plants grown under white LED light was higher than in the plants grown under RB LED light (Fig. 3A). There were no significant differences in single-leaf maximum quantum efficiency (Fv/Fm) between the plants grown under white or RB LED light, except for at 77 DAS, where the Fv/Fm value of the plants grown under white LED light was significantly higher than in the plants grown under RB LED light (Fig. 3B). The Fv/Fmvalues exceeded 0.8 in all light treatments and time periods. The light source significantly affected both ϕPSII and Fv/Fm (Fig. 3A and B) and, in the case of ϕPSII, the effect of the light sources was not dependent on plant age.
Fig. 2.
Side (A) and top (B) views of representative petunia plants after growth under white or RB LED lights at 200 μmol·m2·s-1 for 3 months.
Table 2. Growth and development of petunia plants under white or red-blue (RB) LED lights at 200 μmol·m-2∙s-1 for 3 months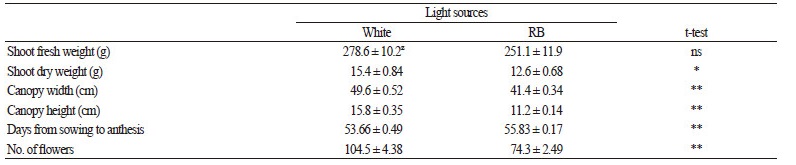 |
Fig. 3.
Single-leaf PSII operating efficiency (ϕPSII) (A) and maximum quantum efficiency of PSII (Fv/Fm) (B) of petunia plants after growth under white or red-blue (RB) LED light. Values are means ± SE (n = 15). Different letters indicate significant differences determined by Tukey’s post hoc test (p < 0.05). Results of one- and two-way ANOVA are shown.
Single-leaf Gas Exchange Parameters
Plant age significantly affected the single-leaf CO2 assimilation rate and stomatal conductance (gs), whereas the light source did not affect these values (Fig. 4A and B). Of the four time points of measurements, there was only one time point (at 63 DAS) in which the CO2 assimilation rate of the petunia plants grown under RB LED light was significantly higher than those grown under white LED light (Fig. 4A). There was no significant difference in the gs between the two light treatments during the entire experiment (Fig. 4B).
Fig. 4.
Single-leaf CO2 assimilation rate (A) and stomatal conductance (B) of petunia plants. Values are means ± SE (n = 12). Different letters indicate significant differences determined by Tukey’s post hoc test (p < 0.05). Results of one- and two-way ANOVA are shown.
Comparison of Single-leaf and Canopy CO2 Assimilation Rates
Sugar Accumulation in Leaf and Fruit
In this experiment, petunia plants were grown continuously under white LED light before measurements of single leaf CO2 assimilation rate and CAP under either RB or white LED light. At 40 DAS, the single-leaf CO2 assimilation rate measured under RB light was significantly higher than when measured under white LED light (Fig. 5A). At the other time points of measurement, the single-leaf CO2 assimilation rates measured under white and RB LED light were not significantly different. CAP measured under white LED light was significantly higher than when measured under RB light at 60 DAS, whereas there was no significant difference in CAP at the other time points (Fig. 5B). Plant age and light source significantly affected singleleaf CO2 assimilation and CAP (Fig. 5A and B). Moreover, the effect of the light source on CAP was dependent on plant age
Fig. 5.
Single-leaf CO2 assimilation rate (A) and canopy apparent photosynthesis (CAP) (B) of petunia plants at 40, 60 and 90 days after sowing. Plants were grown continuously under white LED light and exposed to either RB or white LED light only when the measurements were taken. Values are means ± SE (n = 6). NS = non-significant. Different letters indicate significant differences analyzed by Tukey’s post hoc test (p < 0.05). Results of one- and two-way ANOVA are shown.
Single-leaf Light Transmission
In the white LED light treatment, blue light had the lowest transmission through the leaf, whereas green light had the highest percentage of transmission (Fig. 6A and B). In the RB LED light treatment, green light was not transmitted through the leaves of 2- and 3-month-old plants. Red light from the white LED light had a significantly higher percentage of transmission than red light from the RB LED light in the leaves of plants at both ages. The percentage of light transmission through petunia leaves was significantly affected by plant age, the light source, and the spectrum of the lights (Fig. 6A).
Fig. 6.
of blue, green, and red light through a single leaf of 2-month-old (A) and 3-month-old (B) petunia plants. Results are expressed as mean ± SE (n = 5). Different letters indicate significant differences analyzed by Tukey’s post hoc test. Results of one-, two-, and three-way ANOVA are shown in panel (A).
Discussion
The effect of white and RB light on plant growth and physiology has been studied extensively, but there is no consensus on which light system is most suitable for plant cultivation. Each species responds differently to light systems. In this study, white or RB LED lights, were used for petunia cultivation. One obvious difference between these two light treatments was the proportion of green light. The white LED light contained 38% green light, whereas the RB light had only 2% green light (Table 1) and shoot growth of the petunia plants grown under white LED light was greater than in the plants grown under the RB light treatment (Table 2). This is consistent with a study in radish and spinach where plants grown under white fluorescent light had higher shoot dry weight than those grown under RB light (9:1, without green light) at the same light intensity (Yorio et al., 2001). Results from these studies may suggest the importance of green light in promoting growth in some plant species (Massa et al., 2008). Supplementation with green light in RB lighting systems can significantly improve the growth of lettuce (Kim et al., 2004a).
The morphology and flowering pattern of petunia plants was also different between the light treatments, with petunia plants grown under RB light exhibiting a tighter canopy (Table 2 and Fig. 2). This could be a consequence of a high proportion of red light, which can reduce petunia shoot elongation (Gautam et al., 2015). On the other hand, the white LED light treatment resulted in plants with a more open canopy and an appearance more similar to that of plants grown under natural light (Fig. 2). The RB LED light treatment also resulted in late flowering and significantly fewer flowers, which could be a disadvantage in terms of petunia plant production (Table 2). The ratio of red:far-red (R:FR) light influences flowering of horticultural plants (Heo et al., 2003; Lee and Amasino, 1995; Haliapas et al., 2008). In petunia, a high R:FR light ratio was found to delay flowering (Park et al.,2016). This is consistent with the results in this experiment where petunia plants grown under the RB light treatment, which had the highest R:FR light ratio, flowered later than the plants grown under white light.
Petunia plants grown continuously under RB LED light had higher single-leaf CO2 assimilation than the plants grown under white LED light at 1 out of the 4 time points measured, whereas the values of stomatal conductance were not significantly different between the treatments (Fig. 4A and B). Single-leaf ϕPSII and Fv/Fm values were significantly higher in the plants grown under white LED light (Fig. 3A and B). These results indicated that the improvement of net CO2 assimilation observed in the RB LED light treatment cannot be explained by an increase in the efficiency or capacity of light-dependent reactions. Overall, the single-leaf CO2 assimilation rate values declined continuously after the transition from the vegetative to the reproductive phase. This transition occurred later in the petunia plants grown under RB light as the number of days to first anthesis was significantly higher in those plants compared to the plants grown under white light (Table 2). This should explain why the CO2 assimilation rate of the plants grown under white light was significantly lower than in the plants grown under RB light at only one measurement period (63 DAS) (Fig. 4A).
To compare the effect of white and RB LED light on photosynthesis at both the single-leaf and canopy levels, another experiment was conducted using petunia plants grown continuously under white LED light and then transferred to white or RB LED light for the measurements. The single-leaf CO2 assimilation rate measured under RB light of 40-day-old petunia plants was significantly higher than in the plants measured under white LED light (Fig. 5A). The ANOVA results suggested that RB LED light is more effective than white light in driving photosynthesis at the single-leaf level (Fig. 5A), possibly because the higher proportion of red and blue light is more efficiently absorbed by photosynthetic pigments than green light (Table 1) (Yamori, 2016). The red light spectrum of the RB LED light treatment peaked at approximately 660 nm, close to the red light absorption peak of chlorophyll (Yamori, 2016). Therefore, it is likely that the red light of the RB light treatment was more efficiently absorbed by the petunia leaves for photosynthesis than the red light of the white LED light treatment. This is consistent with the results showing that the percentages of red light transmission through the leaves in the RB LED light treatment were lower than those in the white LED light treatment (Fig. 5).
The CAP value of 60-day-old petunia plants exposed to white LED light was higher than that of the plants exposed to RB LED light, whereas the values under both light treatments were not significantly different at 40 and 90 days old (Fig. 5B). Therefore, at some developmental stages, white LED light may be more effective than RB light in driving photosynthesis at the canopy level. The different effects of the light sources on single-leaf and canopy photosynthesis may be explained by the difference in the proportion of green light between the RB and white LED light treatments. Green light can also be absorbed by leaves and used for photosynthesis, although it is not as efficient as blue and red light (Johkan et al., 2012). Moreover, green light can penetrate the leaves better than red and blue light (Fig. 6A and B) (Terashima et al., 2009; Son and Oh, 2015). It is conceivable that white light could drive photosynthesis at the whole-canopy level better than RB light because of the higher proportion of green light that can effectively reach the leaves inside the canopy (Yamori, 2016). However, the benefit of green light could depend on the plant species as the addition of green light had no positive effect on the growth of lettuce (Kang et al., 2016).
It was intriguing why the CAP values were not significantly different under the light treatments in 40- and 90-day-old petunia plants. One possible reason was the change in canopy architecture. In this study, petunia plants started flowering at approximately 50 DAS. The phyllotaxis of petunia plants can change from opposite to alternate when transitioning from the vegetative stage to the reproductive stage (Sink, 1984). This change could reduce vertical overlapping of the leaves and facilitate better light penetration into the canopy; therefore, the difference in CAP under white and RB LED light in 60-day-old plants would become less significant at the 90-day stage. Similarly, 40-day-old petunia plants may have a less complex canopy structure, which resulted in better light penetration through the canopy. These assumptions are consistent with the two-way ANOVA result, which indicated that the effect of light sources on CAP was dependent on the growth stage (Fig. 5B).
The results of this study demonstrated that white LED light may be more effective than RB LED light for cultivating petunia plants. However, this should not discourage the application of RB light or other narrowed-wavelength LED light systems for plant cultivation. The use of LED light at certain wavelengths could benefit plant cultivation in many ways. For example, Catharanthus roseus cultivated under red light produced a high amount of precursor substances of anti-cancer drugs (Fukuyama et al., 2015). Moreover, alternating red and blue light during cultivation substantially accelerated the growth of lettuce plants (Shimokawa et al., 2014). However, research into the needs of individual species should be conducted before committing to a particular LED lighting system.
