

Introduction
Materials and Methods
Experimental Material
Growth Conditions
Experimental Device
Image Processing
Experimental Methods
Growth Analysis
Statistical Analysis
Results
Shoot Fresh Weight
Shoot Dry Weight
Leaf Area
SPAD Value
Discussion
Introduction
Lettuce is a typical leafy vegetable commonly used for wrapping, and known to have a great health effect due to its vitamins, minerals, and fiber. The domestic lettuce production in the Republic of Korea
is 101,745 ton in 2015 (KREI, 2017).
Recently, lettuce has been consumed as a main ingredient in salads and as a leafy vegetable. Lettuce is also known as a crop suitable for production in a closed-type plant factory, and is widely used as an experimental crop (Lee et al., 2010; Kim, 2013). Recently, there has been an increase in research on closed-type plant factories capable of stably producing high-quality agricultural products safe from abnormal weather and natural disasters (Kim et al., 2013a). Specifically, studies on light source, light quality, and LED photoperiod time using lettuce in a closed-type plant factory have been actively conducted (Park et al., 2012; Cha et al., 2013; Kim et al., 2014). Also, studies on light intensity using lettuce and Taraxacum platycarpum in a closed-type plant factory have been conducted (Cha et al., 2012; Hwang et al., 2016). However, studies on the light intensity of LED light sources using lettuce in a closed-type plant factory are still insufficient.
Meanwhile, consumers are increasing their demand for high-quality agricultural products with increasing income level and interest in health. The external quality of agricultural products can be classified as that which can be confirmed by visual and tactile properties such as size, color, weight, and shape (Kim, 2009; Park et al., 2012). Consumers oftein focus on external factors such as size, shape, and color when purchasing agricultural products. However, these external factors can be subjective because they are chosen by consumers’ intuition and evaluated by the naked eye. It is more desirable to purchase accurate and objective quality information, rather than selecting agricultural products depending on subjective judgment (Kim, 2009). For this reason, studies on nondestructive measurement for the selection and supply of high-quality agricultural products have been actively conducted by measuring the external quality of agricultural products. In particular, there has been considerable research in measuring the external quality of agricultural products using near-infrared and ultra-spectral measurements (Noh and Lu, 2009; Cho et al., 2011). Also, studies have been performed on the germination of seeds nondestructively in leafy plants using hyper-spectral data (Ahn et al., 2012a; Ahn et al., 2012b). In addition, lettuce growth analyses using a CCD camera in plant factories have been actively conducted (Kim et al., 2013b). However, further studies on nondestructive measurements of the external quality of lettuce are still needed. Therefore, the objective of this research was to measure the external quality of lettuce using a Multi-Spectral Image Sensor (MSIS). In addition, this study was conducted to examine the effect of light intensity from LED mixed light on the growth of lettuce in a closed-type plant factory.
Materials and Methods
Experimental Material
Lettuce (Lactuca sativa L. ‘Cheongchima’, Asia seed Co., Ltd., Korea) was used in this study. Each seed was sown on a rockwool sowing plate. The plate was placed on a closed-type plant factory with a fluorescent lamp [200±30 µmol·m-2·s-1, 16/8 h (light/dark) photoperiod] and the temperature was maintained at 20±2°C. The water supply was 2 L every two days. The sowing were transplanted in plastic beds after sowing for 14 d in a closed-type plant factory. Thirty five sowing of lettuce per bed were grown for 20 d in the plant factory.
Growth Conditions
The closed-type plant factory for lettuce growth is located at Chungbuk National University. The factory was maintained at a temperature of 20±2°C, relative humidity of 55± 5%, and carbon dioxide concentration of 1,000±200 µmol·mol-1. LED was used as the light source [Red:Blue=8:2, 16/8 h (light/dark) photoperiod], and the distance between LED and pot was 25 cm (Kang et al., 2016; Dlugosz-Grochowska et al., 2017). A nutrient film technique (NFT) culture system was applied for this cultivation.
The pH and EC of the nutrient solution were 6.0± 0.5 and 1.8±0.2 dS·m-1, respectively. The nutrient solution was circulated at a rate of 1.5 L·min-1 every 30 minutes during the experiment (Cha et al., 2013; Won, 2017).
Experimental Device
Fig. 1 shows a schematic diagram of the acquisition system used to obtain lettuce images. The Multi-Spectral Image Sensor (MS4100, Duncan Tech, USA) has 3 CCD sensing components centered at 550 nm (Green), 650 nm (Red), and 800 nm (Near-Infrared, NIR), with a bandwidth of 50 nm for each band. The spatial resolution of the Multi-Spectral Image Sensor (MSIS) is 1920 × 1080; the gain, offset, and exposure of each channel can be controlled individually through a serial RS 232 interface.
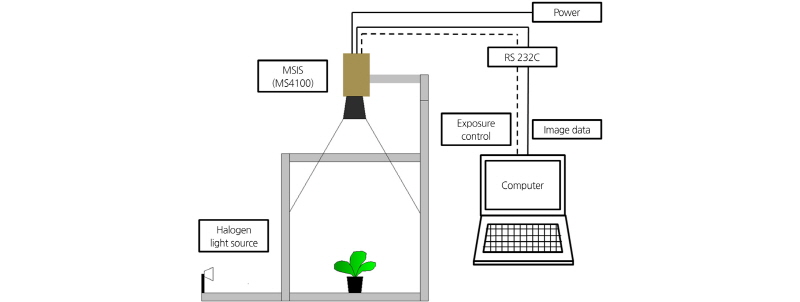
Radiation reflected on an object through each CCD is quantified into a digital number or the gray level. The digital numbers in the MSIS output are affected by the incident light intensity and the reflectance on an object. The intensity of an image is represented as a single matrix; the matrix can be of class 256 steps (unit8, unsigned char 8 bit), in which case the digital number data range is (0, 255). The components in the intensity matrix represent various intensities, or gray levels, where the intensities are 0 (black), and 255 (white).
The MSIS was fixed at 650 mm from the bottom. A halogen light source (7 W, 12 V) was irradiated during image acquisition to maintain the reflectance.
Image Processing
Fig. 2 shows a schematic diagram of the image pre-processing steps. The pre-processing of the multi-spectral images involved the separation of the lettuce leaf from the background. In the dynamic separation, each multi-spectral image was separated into channels of Green, Red, and NIR. Image spectrum analyses found that the lettuce reflectance in the NIR channel was much stronger than the background reflectance. Therefore, the image acquired from the NIR channel was used to separate the lettuce leaf from the background. After threshold process, the NIR channel image became in a masked image. In this masked image, the lettuce became black (gray level=0) and the background became white (gray level=255). All unmasked portions of the original image were treated as background and were removed from the original image via an OR operation. The OR operation is a logical operation; the boolean value is 1 when two operations take different boolean values. The OR operation was applied based on the gray level at point (x, y) in the masked image using the following equation (Noh, 2003).
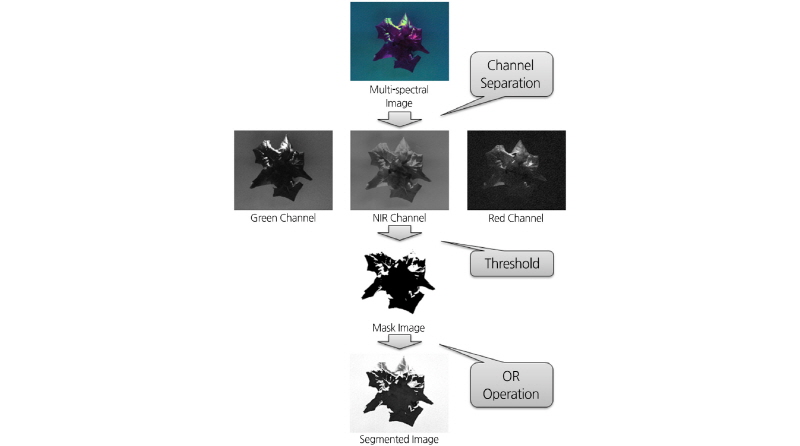
Where gi (x, y) is the segmented gray level at point (x, y) in the original image, gm (x, y) is the masked gray level, fi (x, y) is the original gray level, and i represents either the Green, Red, or NIR channel image.
This segmented image can be used to analyze the density of the pixel value in each channel of Green, Red, and NIR. The average gray value of a lettuce leaf in a multi-spectral image was calculated using the following equation (Noh, 2003):

Where Gi is the average gray value in the Green, Red, or NIR channel, gci is the gray value of the pixel representing the lettuce leaf, and nci is the total number of pixels representing the lettuce leaf in each channel.
Fig. 3 shows a flow chart of image analysis steps. The reflectance of the lettuce leaf is calculated using the pixel value acquired in the pre-processing, and the vegetation index is calculated using the reflectance. The pixel value is used to predict lettuce growth data (shoot fresh weight, shoot dry weight, leaf area), and the vegetation index is used to predict the SPAD value of the lettuce leaf. The prediction model for lettuce growth was developed by regression analysis.

Experimental Methods
Shoot fresh and dry weight, leaf area, and SPAD values of lettuce plants grown under three different light intensities (100, 150, 200 µmol·m-2·s-1) irradiated with red and blue LEDs were measured. The light conditions were set up in such a way that the SPAD values differed (Park and Lee, 1999; Suh and Kim, 2011; Kwak, 2015; Hwang et al., 2016). In addition, growth characteristics of lettuce plants were measured every 2 d from day 10 to day 20 after sowing. After taking 5 images of each condition, shoot fresh and dry weight, leaf area, and SPAD values were measured.
The models for prediction of lettuce growth data were developed using measured 54 growth traits sorted in ascending order. Then, 10 of the 54 traits were used for validation of the prediction models (traits number 5, 10, 15, 20, 25, 30, 35, 40, 45, and 50). The other 44 traits were used for calibration.
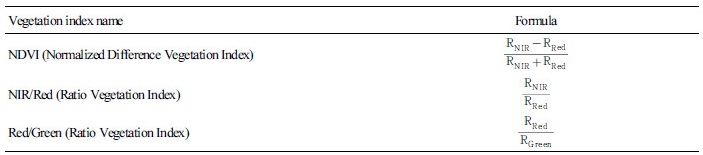
The vegetation index, which is the index of vegetation vitality and growth status, was used to predict the SPAD value. The vegetation indices were: NDVI (Normalized Difference Vegetation index) using RNIR and RRed, and GNDVI (Green NDVI) using RNIR and RGreen from acquired images. In addition, the RNIR and RRed ratio, the RNIR and RGreen ratio, and the RRed and RGreen ratio were used. These models were adopted based on experimental results. The equations that define each vegetation index are listed in Table 1.
Growth Analysis
The shoot fresh weight of lettuce leaves was measured by separating the leaves and roots of lettuce. The shoot fresh weight of 3 lettuce samples were measured using an electronic scale (HF-200GD, AND, Japan) and expressed as an average value. The shoot dry weight was measured from the same lettuce leaves used for measuring shoot fresh weight. Leaves were dried at 70°C for 72 h using a dry oven (0F-11E, Jeio Tech, Korea). Then, leaves were weighted 3 times using an electronic scale (HF-200GD, AND, Japan), and weight was expressed as an average value. Leaf area was measured by using all the leaves. The leaf area of each lettuce plant was measured 3 times using a leaf area meter (Li-3100C, LI-COR, USA), and area was expressed as an average value. The SPAD value of each lettuce plant was measured 3 times on the right upper of the third leaf from the growth point using a chlorophyll meter (SPAD-502Plus, KONICA MINOLTA, Japan), and expressed as an average value. Higher SPAD values indicate higher chlorophyll content in the leaves and vice-versa.
Statistical Analysis
Statistical analysis was conducted using one-way ANOVA in the SPSS statistical package (Version 12.0K, SPSS Inc., USA) for Windows. The significance level of the statistical analysis was set to 5%.
Results
Shoot Fresh Weight
Fig. 4 shows a comparison of lettuce shoot fresh weight under different light intensities from an RB light source. At a light intensity of 100 µmol·m-2·s-1, the lettuce shoot fresh weight was 0.26, 0.62, 1.25, 2.20, 4.99, and 13.02 g/plant on 10, 12, 14, 16, 18, and 20 d after sowing. At a light intensity of 150 µmol·m-2·s-1, the shoot fresh weight was 0.56, 1.24, 4.11, 9.44, 16.40, and 36.27 g/plant on 10, 12, 14, 16, 18, and 20 d after sowing. In addition, at a light intensity of 200 µmol·m-2·s-1 the shoot fresh weight was 0.59, 1.42, 4.03, 9.80, 17.29, and 49.94 g/plant on 10, 12, 14, 16, 18, and 20 d after sowing. Under 200 µmol·m-2·s-1, the shoot fresh weight increased by about 37.69-283.56% compared to 100 and 150 µmol·m-2·s-1 on 20 d after sowing. A prediction model for shoot fresh weight was developed using the correlation between shoot fresh weight and the number of pixels on the lettuce leaf images. Equation (3) shows the prediction model by regression analysis. The coefficient of determination (R2) and RMSE (Root Mean Square Error) of the prediction model were 0.947 and 3.255, respectively. Next, validation of this model was performed. The R2 and RMSE of the prediction model after validation were 0.939 and 4.227, respectively.

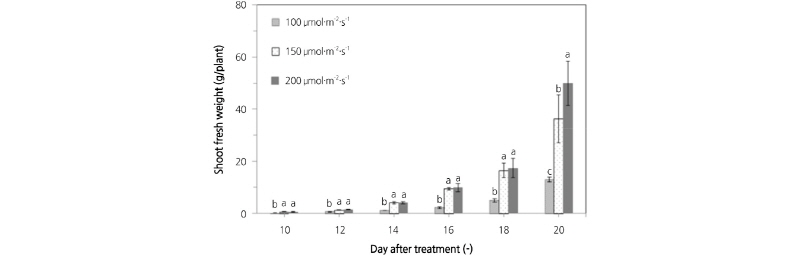
Fig. 4. Comparison of the shoot fresh weight of lettuce plants grown under different light intensities from an RB light source. (A) 100 µmol·m-2·s-1, (B) 150 µmol·m-2·s-1, (C) 200 µmol·m-2·s-1. Value are mean ± SD. Means with different letters (a-f) above the bars are significantly different based on a Duncan’s multiple range test (p ≤ 0.05).
Where X is the pixel value of the lettuce leaf image.
Shoot Dry Weight
Fig. 5 shows a comparison of shoot dry weight of lettuce plants grown under different light intensities using an RB light source. At a light intensity of 100 µmol·m-2·s-1, the shoot dry weight was 0.01, 0.04, 0.07, 0.13, 0.29, and 0.77 g/plant on 10, 12, 14, 16, 18, and 20 d after sowing. At a light intensity of 150 µmol·m-2·s-1, the shoot dry weight was 0.04, 0.08, 0.27, 0.60, 0.94, and 2.17 g/plant on 10, 12, 14, 16, 18, and 20 d after sowing. At a light intensity of 200 µmol·m-2·s-1, the shoot dry weight was 0.04, 0.09, 0.28, 0.65, 1.03, and 3.03 g/plant on 10, 12, 14, 16, 18, and 20 d after sowing. This result indicates that as the light intensity increases, the growth rate and shoot fresh weight of lettuce plants increases. Consequently, the shoot dry weight is increased (Cheon et al., 2003; Cheon et al., 2004; Han et al., 2011; Jeon, 2014). A prediction model for shoot dry weight was developed using the correlation between shoot dry weight and the number of pixels on the lettuce leaf images. Equation (4) shows the prediction model by regression analysis. The R2 and RMSE of the prediction model were 0.910 and 0.258, respectively. Next, validation of this model was performed. The R2 and RMSE of the prediction model after validation were 0.925 and 0.178, respectively.
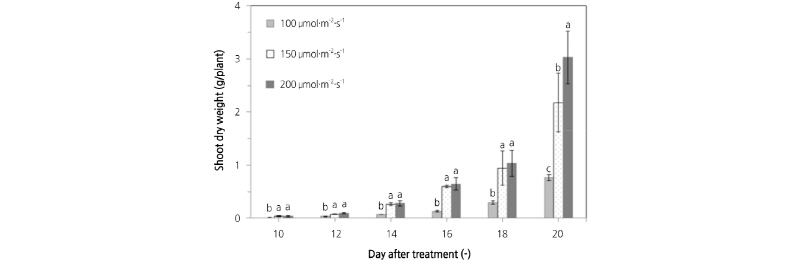
Fig. 5.
Comparison of the shoot dry weight of lettuce plants grown under different light intensities from an RB light source. (A) 100 µmol·m-2·s-1, (B) 150 µmol·m-2·s-1, (C) 200 µmol·m-2·s-1. Value are mean ± SD. Means with different letters (a-g) above the bars are significantly different based on a Duncan’s multiple range test (p ≤ 0.05).

Where X is the pixel value of the lettuce leaf image.
Leaf Area
Fig. 6 shows a comparison of the leaf area of lettuce plants grown under different light intensities using an RB light source. At a light intensity of 100 µmol·m-2·s-1, the leaf area of lettuce plants was 11.53, 28.83, 57.03, 96.88, 191.95, and 428.41 cm2/plant on 10, 12, 14, 16, 18, and 20 d after sowing. At a light intensity of 150 µmol·m-2·s-1, the leaf area was 19.90, 44.84, 129.59, 265.59, 456.66, and 840.17 cm2/plant on 10, 12, 14, 16, 18, and 20 d after sowing. At a light intensity of 200 µmol·m-2·s-1, the leaf area was 19.57, 52.10, 126.77, 263.39, 448.42, and 902.30 cm2/plant on 10, 12, 14, 16, 18, and 20 d after sowing. A prediction model for leaf area was developed using the correlation between leaf area and the number of pixels on the lettuce leaf images. Equation (5) shows the prediction model by regression analysis. R2 and RMSE of the prediction model were 0.972 and 46.148, respectively. Next, validation of this model was performed. The R2 and RMSE of the prediction model after validation were 0.992 and 28.572, respectively.
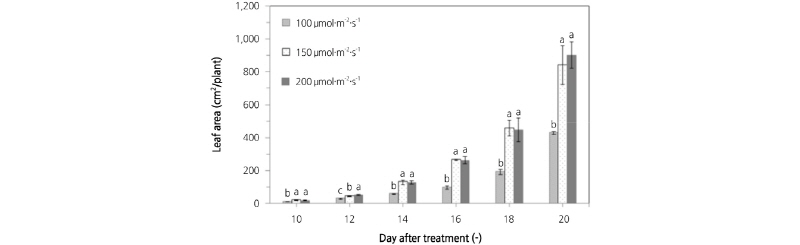
Fig. 6.
Comparison of the leaf area of lettuce plants grown under different light intensities from an RB light source. (A) 100 µmol·m-2·s-1, (B) 150 µmol·m-2·s-1, (C) 200 µmol·m-2·s-1. Value are mean ± SD. Means with different letters (a-g) above the bars are significantly different based on a Duncan’s multiple range test (p ≤ 0.05) .

Where X the is pixel value of the lettuce leaf image.
SPAD Value
Fig. 7 displays a comparison of SPAD values of lettuce plants grown under different light intensities using an RB light source. At a light intensity of 100 µmol·m-2·s-1, the SPAD value was 21.07, 24.40, 24.90, 25.13, 25.00, and 25.53 on 10, 12, 14, 16, 18, and 20 d after sowing. At a light intensity of 150 µmol·m-2·s-1, the SPAD value was 25.57, 28.97, 28.93, 29.93, 28.93, and 28.13 on 10, 12, 14, 16, 18, and 20 d after sowing. At a light intensity of 200 µmol·m2·s-1, the SPAD value was 27.63, 30.63, 31.20, 31.17, 30.00, and 30.07 on 10, 12, 14, 16, 18, and 20 d after sowing. At a light intensity of 200 µmol·m-2·s-1, SPAD values were 3.56-23.76% higher than at 100 and 150 µmol·m2·s-1. Prediction models for SPAD values were developed using the correlation between SPAD values and the reflectance extracted from the acquired multi-spectral images. Equations (6) to (8) show the prediction models by regression analysis. R2 and RMSE of the prediction model using NDVI were 0.769 and 3.163, respectively. R2 and RMSE of the prediction model using the RNIR/RRed ratio were 0.787 and 1.338, respectively. R2 and RMSE of the prediction model using the RRed/RGreen ratio was 0.560 and 1.920, respectively.


Fig. 7.
Comparison of SPAD values of lettuce leaves according to light intensities of an RB light source. (A) 100 µmol·m-2·s-1, (B) 150 µmol·m-2·s-1, (C) 200 µmol·m-2·s-1. Value are mean ± SD. Means with different letters (a-g) above the bars are significantly different based on a Duncan’s multiple range test (p ≤ 0.05).
Discussion
The shoot fresh weight of lettuce plants showed a tendency to increase under higher light intensity. This result is in agreement with those of Park and Lee (1999) showing that shoot fresh weight under a light intensity of 200 µmol·m-2·s-1 increased about 2 fold when compared to 100 µmol·m-2·s-1. Cha et al. (2012) reported that shoot fresh weight of plants grown under fluorescent light with an intensity of 180 µmol·m-2·s-1 increased about 2 fold when compared to 120 µmol·m-2·s-1. In addition, Kwak (2015) showed that shoot fresh weight of plants grown under LED lights with intensity of 200 µmol·m-2·s-1 increased about 1.3 to 2.6 times when compared to 80 µmol·m-2·s-1. On the other hand, in this study, shoot fresh weight of plants grown under 150 and 200 µmol·m-2·s-1 increased about 2.8 to 3.8 fold when compared to 100 µmol·m-2·s-1. It has been shown that environmental factors (nutrient level, nursery media, photoperiod, LEDs Irradiation, etc.) other than light intensity also affect the growth of lettuce (Park and Lee, 1999; Choi et al., 2011; Cha et al., 2012; Park et al., 2012; Shin et al., 2012; Kwack et al., 2015). Shoot dry weight showed a similar tendency, with plants grown under 200 µmol·m-2·s-1 showing dry weight about 39.63-293.51% higher than those grown at 100 and 150 µmol·m-2·s-1 on 20 d after sowing. This result is in agreement with those of Park and Lee (1999), who showed that shoot dry weight increased at a higher light intensity. At 200 µmol·m-2·s-1, the leaf area tended to increase by 7.40-110.62% on 20 d after sowing compared to 100 and 150 µmol·m-2·s-1. This result is in agreement with previous studies (Kwak, 2015; Yeo et al., 2017). More specifically, Yeo et al. (2017) reported the leaf area of lettuce plants grown under 200 µmol·m-2·s-1 light intensity increased about 1.2 to 1.7 fold when compared to plants grown under 100 µmol·m-2·s-1. This correlation between leaf and light intensity is likely due to the fact that as the weight of lettuce increases, the utilization efficiency of light also increases, leading to wider leaves (Han et al, 2011). The SPAD value increased until the 2nd week after sowing and decreased from the 3rd week after sowing, similarly to what was reported by Jeon (2014) and Kwak (2015). The SPAD value tended to increase as the light intensity increased, and this result is in agreement with the results of Hwang et al. (2016) and Yeo et al. (2017. In addition, Park and Lee (1999) reported that the chlorophyll content of the lettuce variety ‘Grand Rapids’ was higher under a light intensity of 200 µmol·m-2·s-1 when compared to 100 µmol·m-2·s-1.
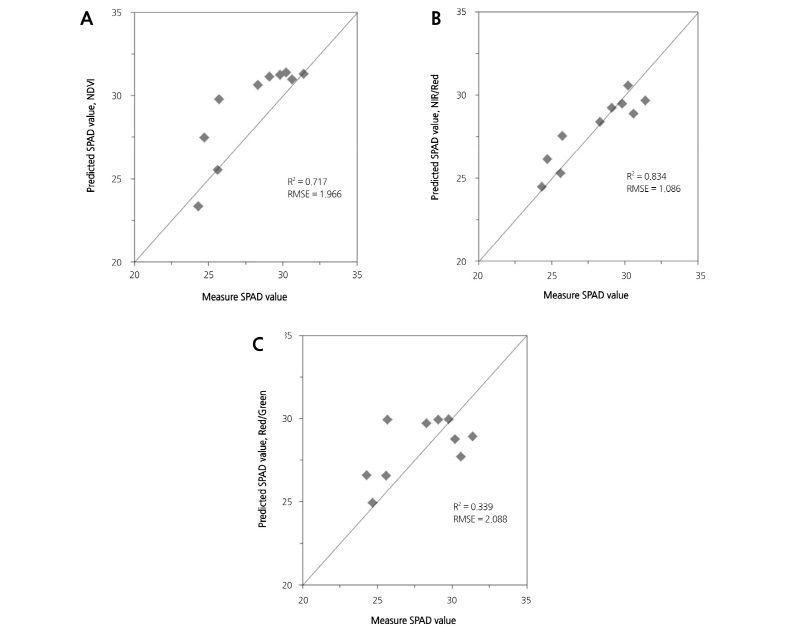
Fig. 8 displays the validation of the model for prediction of SPAD values. The model for prediction of SPAD values was developed using the reflectance of the lettuce leaf acquired via image analysis. Also, the reflectance of the lettuce leaf was calculated using the pixel value acquired via pre-processing. Fig. 8 A to C are the prediction model by using NDVI, RNIR/RRed ratio, and RRed/RGreen ratio, respectively. As shown in Fig. 8A, when the SPAD value of the lettuce leaf is predicted using the prediction model based on NDVI, the R2 and RMSE were 0.717 and 1.966, respectively. As shown in Fig 8B, when the SPAD value of the lettuce leaf was predicted using the prediction model based on the RNIR/RRed ratio, the R2 and RMSE were 0.834 and 1.086, respectively, showing a higher precision than the prediction model using NDVI. In addition, when the SPAD value was predicted using the prediction model based on the RRed/RGreen ratio, the R2 and RMSE were 0.339 and 2.088, respectively (Fig. 8C). Thus, we conclude that SPAD value prediction is possible with relatively high accuracy when using prediction models based on NDVI and RNIR/RRed ratio. In addition, SPAD value prediction is affected by the reflectance of NIR because as the leaf density for transmission increases, the reflectance of NIR also increases (Yoder and Pettigrew-Crosby, 1995; Kim et al., 2005). However, in the case of corn leaves, the SPAD value was affected by RNIR and RGreen in acquired multi-spectral images (Noh, 2003). The SPAD value of potato leaves was also affected by RNIR and RGreen in acquired multi-spectral images (Kang and Noguchi, 2011). In this study, the SPAD value was affected by RNIR and RRed, and this difference is probably related to differences between the crops.
In conclusion, using developed prediction models for growth data (shoot fresh weight, shoot dry weight, leaf area, and SPAD value), the prediction of growth data was possible at high precision. In addition, the developed image acquisition system is able to measure reflectance of images acquired using a halogen light source for indoor measurement. Therefore, the reflectance of multi-spectral images needs to be calibrated for outdoor measurement. If the reflectance of multi-spectral image is calibrated, it is likely that this trait can be measured outdoors in real time.
