

Introduction
Materials and Methods
Plant Materials
DNA Extraction and PCR
Marker Genotyping for Fruit - Related Traits
Conversion to KASPar Marker
SSR Genotyping and Analysis of Genetic Relatedness
Results and Discussion
Marker - Trait Association
Conversion to KASPar
Genetic Relatedness
Introduction
Watermelon (Citrullus lanatus [Thunb.] Matsum.& Nakai var.lanatus) is an important crop cultivated worldwide and is a member of the third-most globally cultivated vegetable family in the Cucurbitaceae (Guner et al., 2004). Modern watermelon cultivars possess diverse fruit traits, including flesh color,fruit shape, rind pattern (stripe and color), seed coat, sugar content, and rind thickness. Depending on differing cultivation traditions or consumer preference, specific fruit traits can be selected through breeding for fruit production.
The genetic inheritance of many watermelon fruit traits has been studied. For fruit shape, three loci (o, Ob, and El ) have been proposed. Elongated fruit shape (OO, ElEl ) was incompletely dominant to oblong fruit shape (oo, elel ), and the heterozygote (Oo, Elel ) was intermediately oblong shaped (Weetman,1937). Intermediate oblong shape was also found to be controlled by another locus, Ob, which is epistatic to o (Lou, 2009). Fruit rind pattern is a complex trait that can be divided into a striped and non - striped (i.e. solid color) pattern. The stripe pattern conspicuously differs between Crimson - type (CT) and Jubilee - type (JT) cultivars (Kim et al., 2015). Typical CT cultivars have medium or wide dark - green stripes, while JT cultivars have narrow black stripes. Three alleles at the g locus have been identified for the solid dark green (G), striped (gs), and gray (g) rind patterns (Porter, 1937); Allelism tests revealed that G was dominant to both gs and g, and that gs was dominant to g (G > gs > g) (Porter, 1937). Subsequently, further allelic series (gM, gN) at the g locus were proposed for fruit rind, and a new locus, ns, was found to control the inheritance of rind stripe along with the g locus (Lou, 2009). For fruit flesh color, three alleles at the y locus have been reported to be responsible for coral red (Y), orange (yo), and salmon yellow (y) flesh (Y > yo > y) (Henderson, 1989; Henderson et al., 1998). In addition, YSCR and yCtrl alleles were also identified for scarlet red and coral red, respectively, and YSCR was dominant to all other alleles (YSCR >Y > yCtrl > yo > y) (Lou, 2009). For canary yellow flesh, the locus C was identified and found to be dominant to red flesh (c) (Henderson et al., 1998).
Breeding efficiency for fruit traits can be improved by using molecular markers that are tightly linked or developed from genes controlling fruit traits of interest (Rhee et al., 2015; Kim et al., 2013a). In watermelon, the number of publicly available markers for marker - assisted selection (MAS) is limited. Based on bulked segregant analysis (BSA), Kim et al. (2015b) demonstrated that a sequence characterized amplified region (SCAR) marker (wsb6 - 11) is tightly linked to the stripe pattern observed in the JT cultivar, which is useful for discriminating this cultivar from CT and non - striped rind types. By constructing an intraspecific genetic map and performing quantitative trait locus (QTL) analysis, Kim et al. (2015c) identified two cleaved amplified polymorphic sequence (CAPS) markers, SUN - Cla011257 and wsb3 - 24, for fruit shape. For fruit flesh color, Bang et al. (2007) developed a CAPS (Lcyb) and a SCAR (Clcyb.600) marker from the Lycopene β - cyclase (Lcyb)gene, distinguishing red and canary yellow - fleshed fruit. However, for use in domestic MAS programs, these markers must be validated for marker - phenotype association in diverse breeding materials of commercially available Korean watermelons. Furthermore, for large scale MAS, gel - based markers need to be converted to an automated genotyping system such as the Kompetitive Allele Specific PCR Genotyping (KASPar) assay (Batley and Jacqueline, 2015).
Genetic relatedness among diverse breeding lines provides information to assess population structure, pedigree records, cultivar identification, and parental lines. In particular, genome - wide association studies (GWAS) require preliminary tests to determine the genetic structure of relatively large populations (core collections) as the source material for genome - wide resequencing. For initial population genotyping, simple sequence repeat (SSR) markers can be used due to their codominant and multi - allelic nature.
In the present study, we evaluated marker - phenotype associations for fruit - related traits using an array of watermelon breeding accessions to validate using the markers described above for MAS. In addition, genetic relationships between accessions were evaluated based on SSR markers.
Materials and Methods
Plant Materials
A total of 85 inbred lines, including wild - type species, were used as an array of germplasm accessions. This array represents diverse phenotypic characteristics that are related to fruit shape, rind pattern, and flesh color. The seeds for all accessions were provided by Jeollabuk - do Agricultural Research & Extension Services (JARES). Description of fruit - related traits for representative accessions is presented in Fig. 1.
Fig. 1.
Diverse fruit traits of the representative watermelon accessions used in this study. O, I, and E indicate round, intermediate, and elongated fruit shapes, respectively. CG, JB, JG, JY, NG, and NY indicate Crimson-type stripe and green rind pattern, Jubilee-type stripe and black rind pattern, Jubilee-type stripe and green rind pattern, Jubilee-type stripe and yellow rind pattern, and no stripe and yellow rind pattern, respectively. ID number of the watermelon accession is shown in parenthesis (refer to Table 3).
DNA Extraction and PCR
Three seedlings per accession were grown and the first true leaves were collected for DNA extraction. Total genomic DNA was extracted as described by Kim et al. (2015a). All PCR was performed in a total volume of 10 μL containing 10 ng of genomic DNA, 0.5 μL each of forward and reverse primers (10 pmol·μL-1), 1 μL 10 × PCR buffer, 0.2 μL dNTPs (10 mM), and 0.1 μLTaq polymerase (5 units·μL-1) (SolGent, Daejeon, Korea).
Marker Genotyping for Fruit - Related Traits
For fruit shape, two CAPS markers SUN - Cla011257 and wsb3 - 24 reported by Kim et al. (2015c) were examined (Table 1). The SUN - Cla011257 was amplified using a general PCR program and the wsb3 - 24 marker was amplified using a touch- down PCR program. General PCR was conducted as follows:1 cycle at 95°C for 5 min; 35 cycles at 94°C for 30 s, annealing temperature for 30 s, and 72°C for 1 min; and 1 cycle at 72°C for 7 min. Touch - down PCR was performed as follows: 1 cycle at 95°C for 2 min; 10 cycles at 94°C for 15 s, 60 - 55°C for 30 s (decreasing by 0.5°C per cycle), and 72°C for 1 min; 35 cycles at 94°C for 15 s, 55°C for 30 s, and 72°C for 1 min; and ending at 72°C for 3 min. For fruit stripe pattern, a SCAR marker wsb6 - 11 reported by Kim et al. (2015b), was examined (Table 1). PCR amplification of the wsb6 - 11 marker was performed using a touch - down PCR program, as described above. For fruit flesh color, a SCAR Clcyb.600 and a CAPS marker Lcyb reported by Bang et al. (2007 and 2014) were evaluated (Table 1). PCR amplification was performed using the general PCR program described above.

Restriction enzyme digestion of all CAPS markers was conducted in a total volume of 15 μL containing 10 μL PCR product, 1.5 μL 10 × buffer, and 0.3 μL of each enzyme (10,000 U·mL-1, New England BioLabs® Inc., Ipswich, MA, USA), followed by incubation at 37°C for 1 h. All PCR products were separated by gel electrophoresis using 1% general agarose gel (PhileKorea, Seoul, Korea) for wsb3 - 24 Lcyb and Clcyb.600 or 3.5% for wsb6 - 11, SUN - Cla011257 and Lcyb, and visualized under UV light after staining with ethidium bromide. Information on annealing temperatures, PCR primer sequences for each markers, and restriction enzymes is provided in Table 1.
Conversion to KASPar Marker
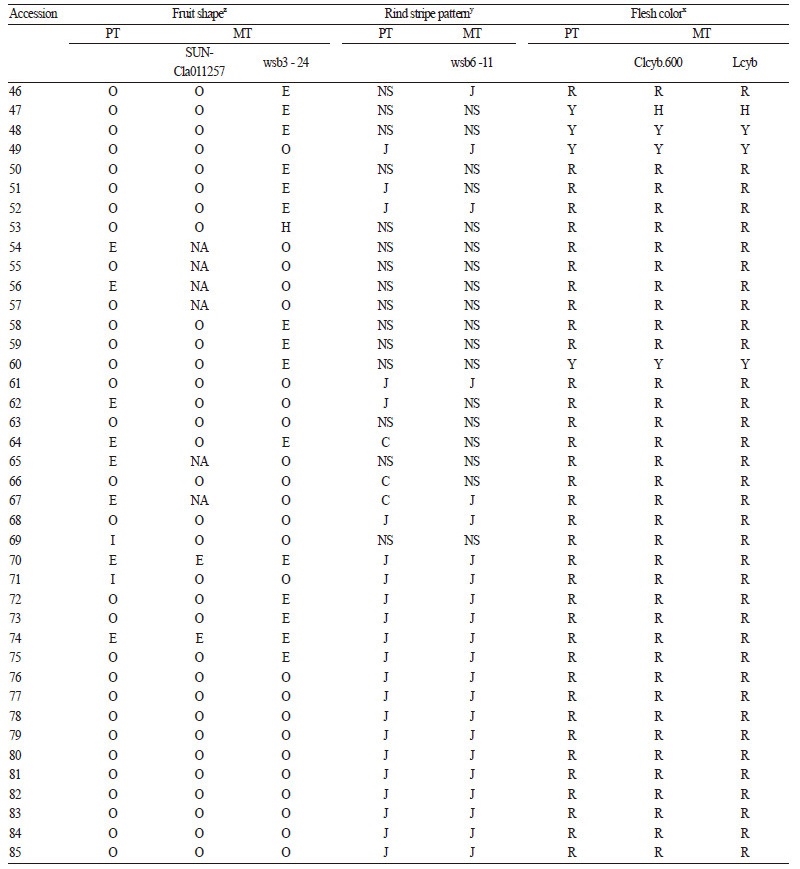
For automated genotyping, agarose gel - based wsb6 - 11 and Lcyb markers were converted to KASPar (Table 2). PCR primer pairs and probe sequences were designed based on the single nucleotide polymorphism (SNP) or insertion/deletion (InDel) information for each gel - based marker by the Laboratory of the Government Chemist (LGC) (Middlesex, England). PCR for KASPar was conducted in a total volume of 5 μL containing 5 - 50 ng of genomic DNA, 0.07 μL of primer mix (10 pm·μL-1), and 2.5 μL of master mix (LGC, Middlesex, England). PCR amplifications were performed using the touch - down PCR program: 1 cycle at 94°C for 15 min; 10 cycles at 94°C for 20 s, 61 - 55°C for 60 s (decreasing by 0.6°C per cycle); 26 cycles at 94°C for 20 s, 55°C for 60 s; and ending at 37°C for 1 min using the LC480 Real time PCR cycler (Roche, Berlin, German). Genotyping was carried out using the allele detection software LightCycle® 480 SW 1.5 (Roche, Berlin, Germany).
SSR Genotyping and Analysis of Genetic Relatedness
Out of 85 accessions, 48 (Accessions 1 - 48 in Table3) representing diverse fruit traits were selected for SSR genotyping. SSR primers (Table 4) were selected from the primer list provided by Kwon et al. (2015). PCR was conducted by a touch - down program as described in the ‘Marker genotyping for fruit - related traits’ section. PCR products were electrophoresed using Fragment Analyzer (Advanced Analytical, Australia). The polymorphic information content (PIC) value of each SSR primer set was calculated by the following formula:
where Pij is the frequency for the j - th allele of the marker i among a total of n alleles (Botstein et al., 1980).
The Nei - Li similarity index was used to construct a pairwise similarity matrix (Li et al., 2011) and the similarity was calculated by the following formula:
Similarity = 2Nab /(Na + Nb)
where Nab is the number of fragments that appeared in two genotypes mutually. Na and Nb is the number of total of fragments that appeared in each genotype.
Cluster analysis was conducted with the unweighted pair group method on arithmetic averages (UPGMA) based on the Nei - Li similarity value. All statistical analyses were performed with NTSYS - PC version 2.02k (Rohlf, 2002).
Results and Discussion
Marker - Trait Association
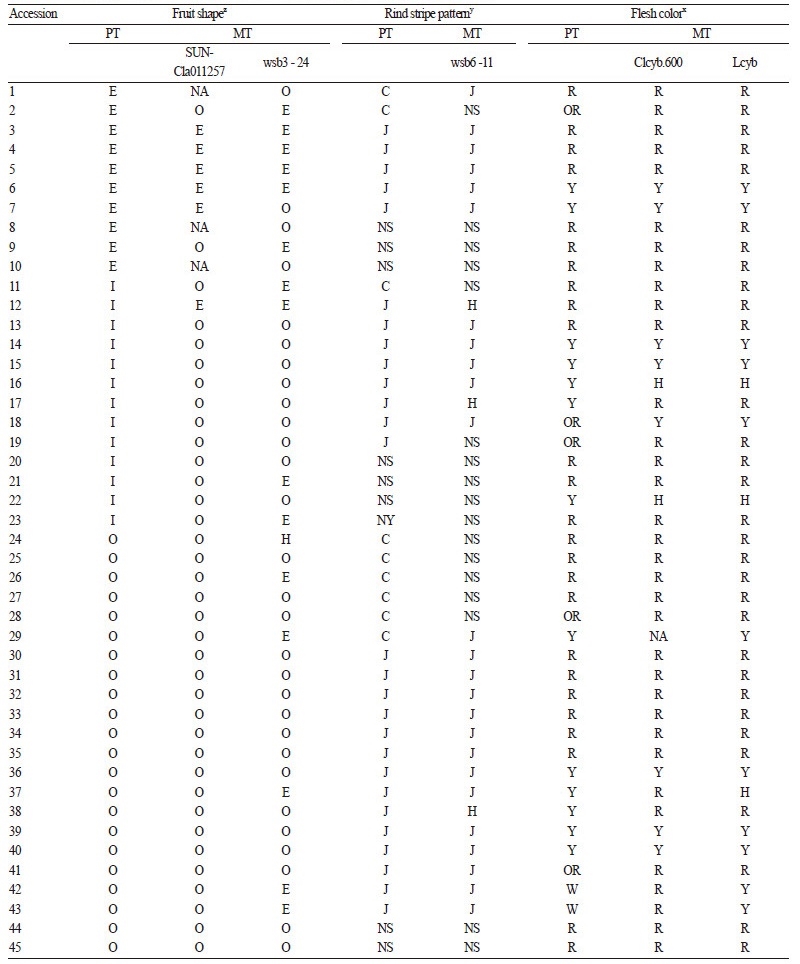
Fruit shape. Marker - trait association for fruit shape was evaluated using the SUN - Cla011257 and wsb3 - 24 markers (Table 3 and Fig. 2). Kim et al. (2015) mapped these markers using an F2 population derived from ‘Arka Manik’ (AM, round fruit) × ‘TS34’ (TS, elongated fruit). These markers mapped on chromosome 3 and tightly linked to a major QTL that explained 79.7% of the phenotypic variation for fruit shape index (FSI). For the SUN - Cla011257, marker - trait matching between the watermelon accessions with elongated or round fruit shape was 81%, whereas four elongated - fruit accessions (19 - 3, 23 - 4, 37 - 4, and 40 - 7; Table3) carried the marker genotype for AM(round). With the exception of one accession (99 - 3), which carried a marker genotype for TS (elongated), all other accessions with intermediate fruit shape carried the markergenotype for AM. However, the marker - trait association for wbs3 - 24 was low (69%). We conclude that SUN - Cla011257 is a better marker for selecting elongated or round fruit shape than wsb3 - 24, but that neither marker is applicable for selecting intermediate fruit shape. Intermediate fruit shape can be controlled by other loci (possibly including Ob) different from the locus (possibly O) linked to these markers.
Rind stripe pattern. Marker - trait association for rind stripe pattern was evaluated using wsb6 - 11(Table 3 and Fig. 2). This marker was developed by BSA of F2 progeny derived from AM [Crimson - type stripe pattern (CSP)] × TS [Jubilee - type stripe pattern (JSP)], and was reported to be effective in selecting the Jubilee - type stripe pattern (Kim et al., 2015b). In our experiment, all JSP accessions, except for three (8 - 3, 19 - 3, 54 - 6; Table 3), showed a marker genotype for TS. Conversely, all non - JSP accessions, including CSP or non - striped (solid rind) accessions, except for four (23 - 4, 42 - 2, 56 - 1, 59 - 3; Table 3) showed a marker genotype for AM. These results indicate that wsb6 - 11 is tightly linked to JSP and is suitable for selecting JSP from other rind patterns. Several cases of marker - trait mismatches (8 - 3, 19 - 3, 54 - 6, 23 - 4, 42 - 2, 56 - 1, and 59 - 3; Table 3) may be due to chromosomal recombination between gene and marker, since wsb6 - 11 was not developed based on the gene responsible for JS.
Fruit flesh color. Clcyb.600 and Lcyb markers derived from mutations in the β - cyclase gene (Lcyb) were evaluated for fruit flesh color (Table 3 and Fig. 2). The SCAR marker Clcyb.600 was developed based on an In / Del mutation in apromoter region of the Lcyb gene (Bang et al., 2014), while the CAPS Lcyb was based on a SNP in an exon causing a premature stop codon (Bang et al., 2007). The mutant alleles result in the accumulation of lycopene leading to scarlet or coral red flesh, whereas the wild - type allele synthesizes other carotenoids from lycopene, resulting in canary yellow flesh (Bang, 2005). In our experiment, most canary yellow flesh accessions carried a homozygous Clcyb.600 and Lcyb marker genotype for the wild - type allele. Furthermore, all scarlet or coral red accessions carried marker genotypes that were homozygous for the mutant allele. However, two yellow accessions (17 - 4 and 19 - 4 in Table 3) were genotyped as homozygous for mutant allele with both markers. Since these markers are based on sequence variation of the gene, linkage - break by a recombination event cannot explain the marker - trait mismatch. Instead, it is possible that the flesh color of these accessions is salmon yellow that is similar to canary yellow, but controlled by different gene (s) in the carotenoid pathway (Jeffery et al., 2012). Salmon yellow can result from the loss of Carotenoid isomerase (CRTISO) gene function causing subsequent accumulation of prolycopene (Isaacson et al., 2002) .
For orange - flesh color accessions, the marker genotype was either yellow or red. Orange color is due to the accumulation of prolycopene or β - carotene (Tomes and Johnson, 1965; Watanabe et al., 1987), and the mutant allele of the Lcyb gene is not involved in this coloration. Several candidate genes for orange color are CRTISO, CHYB (β - carotene hydroxylase), and ZEP (zeaxanthin epoxidase), which encode enzymes involved in the watermelon carotenoid pathway (Lv et al., 2015). Taken together, the results of our study confirmed that Lcyb - based SCAR and CAPS markers can be useful for selecting canary yellow and red flesh color in watermelon.
Conversion to KASPar
The SCAR wsb6 - 11 marker for rind stripe pattern and the CAPS Lcyb marker for flesh color were converted to a KASPar marker type (Table 2 and Fig. 3,4). PCR using KASPar markers designed in this study (Table 2) resulted in marker genotypes consistent with the agarose gel - based genotyping results (Table 3). However, the KASPar method is more time and labor efficient than the gel - based assay because alleles are automatically detected in the same PCR tube immediately after PCR amplification (Mesci et al., 2016).
Genetic Relatedness
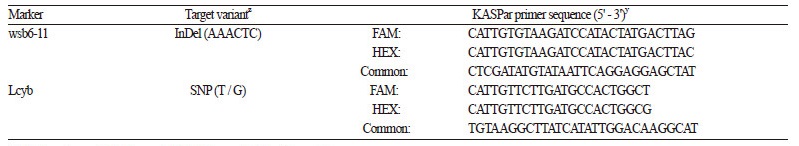
A subset (48 accessions) of the reference array accessions was amplified using 16 SSR primer sets (Table 4). In total, 89 alleles were observed and on average, each primer set had 5.56 alleles. The highest allelic variation was detected by the SSR markers BVWS00433 and BVWS01897, which amplified nine polymorphic PCR bands. Conversely, BVWS00441, BVWS01734, and BVWS01843 detected three polymorphic alleles, the lowest number of the markers. PIC values for the SSR markers ranged from 0.61 to 0.22. Pairwise similarity (Nei - Li) of the 48 accessions was calculated. The range of similarity was 0.00 - 0.94. The highest similarity of 0.94 was observed between the accession 30 and 31, while the lowest similarity of 0.00 was observed between accession 43, which was a white - flesh wild subspecies (C. lanatusvar. citrodes), and 20 other accessions.
Table 4. Simple sequence repeat (SSR) primers used for assessing the genetic relatedness between 85 watermelon accessions.
 | |
zPIC, polymorphic information content. | |
A phenetic tree was constructed using the pairwise similarity matrix based on UPGMA (Fig. 5). In general, at a coefficient of 0.11, 48 accessions were grouped into two major clades (Clade I and Clade II). All accessions with colored flesh were classified into Clade I, whereas white - fleshed accessions were classified into Clade II. Clade I could be further divided into two subclades (Clade I - 1 and Clade I - 2) at a coefficient of 0.39. There was a major difference between Clade I - 1 and I - 2 for rind pattern and fruit color; a majority (8/10) accessions with the CT rind stripe were grouped together in Clade I - 1, while most accessions in Clade 1 - 2 had a JT rind stripe. Significant differentiation in flesh color was also observed. Although red - and pink - flesh color accessions were scattered in different clades, yellow - flesh color accessions tended to group together in Clade I - 2. This may be because the yellow - flesh color accessions collected in this study had the same JT rind pattern.
Fig. 5.
A phenetic tree showing the genetic relationships among 48 watermelon accessions assessed using 16 simple sequence repeat (SSR) markers. O, I, and E indicate round, intermediate, elongate fruit shape, respectively. CG, JB, JG, JY, NG, and NY indicate Crimson - type stripe and green rind pattern, Jubilee - type stripe and black rind pattern, Jubilee - type stripe and green rind pattern, Jubilee - type stripe and yellow rind pattern, and no stripe and yellow rind pattern, respectively.
In summary, genetic relatedness assessed by SSR markers implied that watermelon accessions of the reference array possessed a distinguishable genetic structure based on the striped rind pattern (CT vs JT). However, no significant groupingpattern based on other fruit - related traits was evident in this study. Crimson - type (CT) watermelons are popular in Europe and America and normally have a broader and lighter - green stripe pattern. In contrast, JT watermelons have dark and sharp stripes and are cultivated in Asian countries, including Korea, Japan, and China. Different geographical origins and breeding histories may explain why Crimson - and Jubilee - type watermelon cultivars have genetically different backgrounds, as demonstrated by the SSR assay. However, within the Crimson - and Jubilee - type watermelon groups, no distinctive subgrouping patterns were observed by other fruit - related genetic markers. This implies that breeding has been performed through active hybridization resulting in the mixing of genetic backgrounds among breeding materials with different fruit shape, rind color, and flesh color.
