

Introduction
Materials and Methods
Plant preparation
Pathogen inoculation and disease development
Disease evaluation and image data acquisition
Development of the symptom image classification model
Results and Discussion
Phenotypic evaluation following pathogen inoculation
Performance evaluation of the symptom classification model
Application of the image classification system
Conclusion
Introduction
Bacterial wilt is a major vascular disease of tomato and other solanaceous crops, and its importance is expected to increase under environmental conditions that favor pathogen survival and disease development. The disease is caused by the soil-borne bacterium Ralstonia pseudosolanacearum, which infects plants through the root system, colonizes xylem vessels, impairs water transport, and ultimately induces progressive wilting and plant death (Rivera-Zuluaga et al. 2023; Wu et al. 2023). Because R. pseudosolanacearum has a broad host range and can persist in soil and water-associated environments, bacterial wilt is difficult to manage once it becomes established in production fields. Disease outbreaks are particularly severe under warm and humid conditions, resulting in substantial losses in tomato production (Allen et al. 2005). As chemical and biological control strategies generally provide limited and inconsistent control efficacy, host resistance, crop rotation, and accurate disease monitoring remain central components of bacterial wilt management (Wu et al. 2023). Previous work in tomato bacterial wilt has emphasized the importance of optimizing plant growth and inoculation conditions for reproducible disease evaluation, particularly when using resistant tomato materials such as the ‘Hawaii7996’ cultivar (Kim et al. 2023).
Reliable evaluations of bacterial wilt symptoms are essential for tomato pathology studies and for resistance-oriented breeding programs. However, conventional disease assessments are usually based on visual scoring of wilting and leaf collapse, which can vary depending on evaluator experience, the inoculation method used, the disease-development stage, and the environmental conditions (Hayward 1991; Bock et al. 2022). This limitation is especially relevant for bacterial wilt because symptom progression is continuous rather than discrete: plants may gradually shift from asymptomatic or weakly wilted states to severe whole-plant wilting. As a result, intermediate disease stages are often difficult to distinguish consistently, and inconsistent scoring can reduce the comparability of phenotypic data across experiments (Leite et al. 2024). Therefore, a standardized image-based approach that classifies symptom severity under controlled conditions could complement the conventional visual assessment method and improve the reproducibility of bacterial wilt phenotyping.
Artificial intelligence (AI)-based image analysis has increasingly been applied to plant disease detection, symptom classification, and high-throughput phenotyping (Jafar et al. 2024; Jelali 2024). In plant pathology, image-based AI methods are particularly useful when disease symptoms are visually recognizable but difficult to score consistently by human observations alone. Machine learning and deep learning approaches have been used for automated disease diagnosis, crop monitoring, growth assessment, and decision-support systems in agricultural production (Jelali 2024; Mahmood ur Rehman et al. 2024). However, model performance can be strongly influenced by the dataset size, image acquisition conditions, background variation, symptom heterogeneity, and the biological definition of the target classes. Therefore, disease-specific model development and careful interpretation are required, particularly when image classes represent symptom severity rather than genetically defined resistance categories.
Among deep learning approaches, convolutional neural networks (CNNs) have been widely used for image classification because they can learn hierarchical spatial features directly from image data (LeCun et al. 2015; Vásconez et al. 2024). Unlike manual feature extraction, CNN-based models can identify visual patterns associated with leaf wilting, canopy collapse, and other symptom-related traits without requiring predefined image descriptors. This capability makes CNNs suitable for classifying whole-plant disease phenotypes such as bacterial wilt. Despite its usefulness, CNN-based classification should be evaluated using independent test data, and its outputs should be interpreted within the biological and experimental limits of the dataset used for model development. With regard to bacterial wilt phenotyping, this is particularly important because adjacent symptom classes may share overlapping visual features during disease progression.
In this study, we developed a CNN-based image classification model to evaluate tomato bacterial wilt symptom severity using standardized multi-view images. Four tomato cultivars were inoculated with R. pseudosolanacearum strain SL341 to generate a broad range of wilt symptoms under controlled conditions. A total of 1,500 images were assigned to three image-level symptom-severity classes and used to train, validate, and test the model. The objective of this study was not to define stable genetic resistance categories but to determine whether CNN-based image analysis could distinguish low-severity, intermediate-severity, and severe-wilt symptoms in tomato. This controlled-condition framework provides a basis for objective symptom assessments and may be developed further for larger-scale digital phenotyping after validation across diverse tomato germplasm, pathogen isolates, and imaging environments.
Materials and Methods
Plant preparation
Four susceptible tomato cultivars, Solanum lycopersicum cv. ‘Money Maker’, ‘Heinz1706’, ‘M82 sp+’, and ‘BWS-3’, were used in this study. A sheet of tissue paper was placed in a Petri dish and moistened with 5 mL of triple-distilled water (TDW). Surface-sterilized seeds were then placed on the tissue paper, with 30 seeds per cultivar. The seeds were germinated in an incubator at 28°C in the dark for four days. The germinated seedlings were transplanted into pots and grown in a controlled growth chamber under a 16 h light/8 h dark photoperiod at 23–25°C. Plants were cultivated for approximately three weeks until the 7th–8th true leaves had developed and were subsequently used for bacterial wilt inoculation experiments. This procedure was performed to generate the symptom image datasets for model development.
Pathogen inoculation and disease development
Ralstonia pseudosolanacearum strain SL341 was used for inoculation. The bacterial strain was streaked onto TZC agar medium (1 g casamino acid, 10 g peptone, 5 g glucose, 17 g agar, and 5 mL of 1% 2,3,5-triphenyl tetrazolium chloride per liter of distilled water) and incubated at 28°C in the dark for 48 h. To increase bacterial activity, the culturing process was repeated once. A single colony was then transferred to CPG liquid medium (1 g casamino acid, 10 g peptone, and 5 g glucose per liter of distilled water) and incubated at 28°C with shaking for 24 h. This liquid culture step was also repeated once. The bacterial suspension was centrifuged at 12,000 rpm for 2 min, and the supernatant was discarded. The pellet was washed with sterile distilled water and resuspended. The optical density at 600 nm (OD600) was measured using a spectrophotometer and adjusted to 0.3, corresponding to approximately 108 CFU mL-1. The suspension was subsequently diluted to the desired concentration for inoculation.
Inoculation was performed 21 days after transplanting when plants had developed 7–8 true leaves. Two inoculation methods were employed: drench inoculation and petiole inoculation. For drench inoculation, the bacterial suspension adjusted to 106 CFU mL-1 was applied directly to the rhizosphere. For petiole inoculation, 5 µL of the bacterial suspension adjusted to 103 CFU mL-1 was applied to the cut surface of the petiole. Both methods were used to obtain a wide range of symptom phenotypes. Following inoculation, plants were maintained at 28°C under a 16 h light/8 h dark photoperiod, and disease development was monitored for 20 days.
Disease evaluation and image data acquisition
Disease symptoms were evaluated daily for 20 days after inoculation under controlled conditions (28°C, 16 h light/8 h dark). Disease severity was evaluated for each individual plant using the following disease index (DI) scale ranging from 0 to 4 based on the proportion of the plant exhibiting wilting and/or leaf abscission: 0, no visible symptoms; 1, 1–25%; 2, 26–50%; 3, 51–75%; and 4, 76–100% wilting and/or leaf abscission. For CNN-based symptom classification, plants with DI scores of 0–1 were classified as low-severity (asymptomatic to weak wilt), those with DI scores of 2–3 as intermediate-severity, and those with a DI score of 4 as severe-wilt (Gao et al. 2023; Ueyama et al. 2026).
Images were captured when disease symptoms had stabilized. To ensure consistency during the image acquisition step, all photographs were taken against a black background under standardized conditions (shutter speed, 1/100 s; aperture, F7.1; ISO 3200). Each plant was photographed from up to three angles (front, left, and right sides) to capture symptom characteristics on the leaves and stems clearly. In total, 1,500 images were collected, consisting of 500 images each for low-severity, intermediate-severity, and severe-wilt phenotypes.
Development of the symptom image classification model
A convolutional neural network (CNN)-based deep learning model was developed to classify tomato bacterial wilt symptom severity from plant images. The complete dataset consisted of 1,500 images obtained from 776 individual tomato plants, each photographed from up to three viewing angles (front, left, and right). To prevent data leakage and ensure an independent evaluation, the dataset was partitioned at the plant individual level, based on plant identifiers recorded in the image metadata, rather than by random image shuffling; images originating from the same plant were confirmed to never be split across the training, validation, and test sets. The 776 plants were assigned to training (497 plants, 960 images), validation (124 plants, 240 images), and held-out test sets (155 plants, 300 images) at a ratio of 64:16:20, maintaining an equal distribution across the three symptom-severity classes (Baek et al. 2023; Lee et al. 2024).
Following dataset partitioning, all images were resized to 256 × 256 pixels with three RGB channels and retained at their native 0–255 pixel intensity range, as pixel normalization was handled internally by the classification model. To mitigate overfitting given the limited number of plant individuals, training images were augmented on-the-fly with random rotation (±25°), horizontal and vertical translation (±10%), zoom (±15%), brightness adjustments (0.8–1.2×), and horizontal/vertical flipping, with no augmentation applied to validation or test images. The three symptom-severity classes were represented using one-hot encoded labels for multi-class classification, and class weights were computed from the training set to correct for any residual class imbalance.
The classification model was built using transfer learning with EfficientNetB0 (Tan and Le 2019) pretrained on ImageNet as the convolutional feature extractor. The convolutional base was followed by a global average pooling layer, a fully connected layer of 120 neurons with Swish activation, a dropout layer (rate = 0.4), and an output layer of three neurons with softmax activation corresponding to the three symptom-severity classes.
Model training was conducted in two stages. In the first stage, the EfficientNetB0 base was frozen and only the newly added classification head was trained using the Adam optimizer (learning rate = 1 × 10⁻⁴) for a maximum of 1,000 epochs with a batch size of 8. In the second stage, the entire network, including the EfficientNetB0 base, was unfrozen and fine-tuned for up to 30 additional epochs using a reduced learning rate (1 × 10⁻⁵) to refine feature representations specific to the tomato symptom dataset. Categorical cross-entropy was used as the loss function, and accuracy was used as the evaluation metric throughout training. To reduce overfitting, early stopping was applied independently at each stage by monitoring validation loss with patience of 15 epochs, restoring the model weights corresponding to the lowest validation loss; model checkpointing was likewise applied independently at each stage. Model learning was monitored using the training and validation accuracy and loss curves.
The final classification performance was evaluated using the independent, plant-level held-out test set. For each test image, the trained model generated predicted probabilities for the three symptom-severity classes, and the class with the highest predicted probability was assigned as the predicted class (Lee et al. 2026). Classification performance was evaluated by comparing predicted and true class labels using a confusion matrix. In addition to overall accuracy, class-wise precision, recall, and F1-scores were calculated, and receiver operating characteristic (ROC) and precision–recall curves with the corresponding area under the curve (AUC) were generated for each class using a one-vs-rest approach. Gradient-weighted class activation mapping (Grad-CAM) (Selvaraju et al. 2017) was also applied to visualize the image regions contributing most to each classification decision.
Results and Discussion
Phenotypic evaluation following pathogen inoculation
To generate image-level symptom-severity classes of tomato bacterial wilt, rather than to define stable genotype-level resistance categories, tomato plants were inoculated with Ralstonia pseudosolanacearum strain SL341 using drench and petiole inoculation methods. The bacterial suspension was applied at concentrations of 106 CFU mL-1 for drench inoculation and 103 CFU mL-1 for petiole inoculation, and disease progression was monitored for 20 days. Disease severity was assessed using a disease index (DI) scale (Fig. 1).
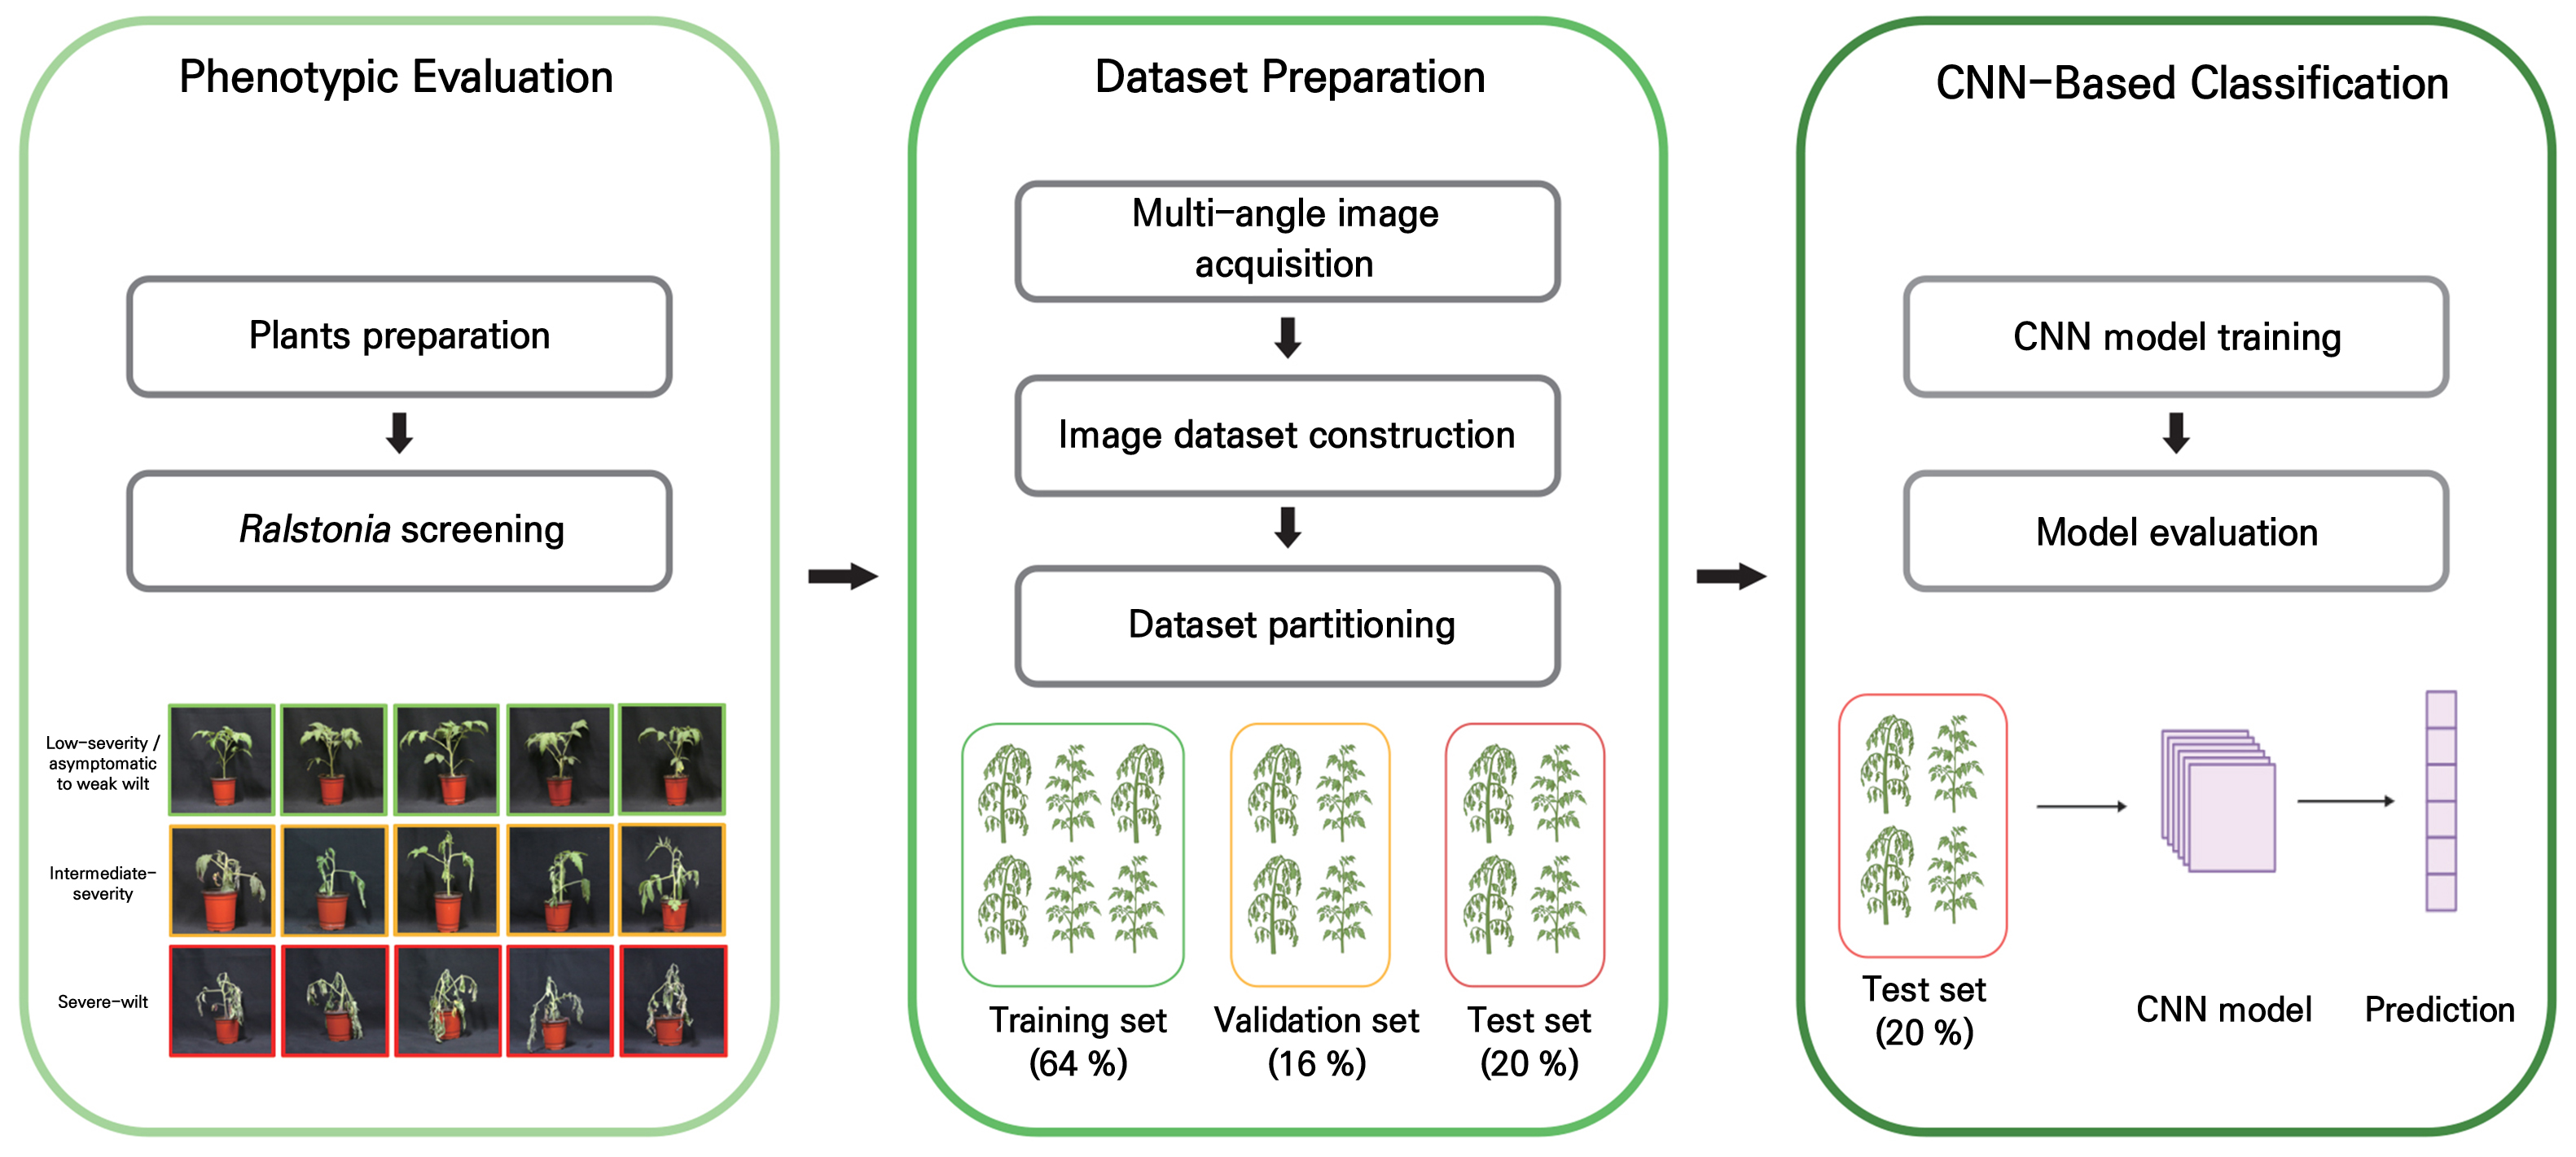
Fig. 1.
Workflow of tomato bacterial wilt phenotyping and CNN-based image classification. Tomato plants were inoculated with Ralstonia pseudosolanacearum and classified as low-severity, intermediate-severity, or severe-wilt based on disease severity. Images were acquired from multiple viewing angles to generate a dataset of symptom phenotypes. The dataset was divided into training (64%; 497 plants, 960 images), validation (16%; 124 plants, 240 images), and test (20%; 155 plants, 300 images) sets and used to train, validate, and evaluate a CNN model for the automated classification of tomato bacterial wilt symptom severity levels.
The two inoculation methods produced distinct temporal patterns of wilt development. For the samples subjected to the drench inoculation treatment, disease symptoms became clearly distinguishable approximately 20 days after inoculation. This relatively slow progression is consistent with the root-based infection route, in which the pathogen must enter through the rhizosphere and subsequently colonize vascular tissues before visible wilting develops. During the early phase of disease development, most images corresponded to asymptomatic or low-severity wilt states, whereas intermediate wilt symptoms became more apparent as the disease progressed. Severe wilting was observed mainly during the later stage of disease development.
In contrast, petiole inoculation resulted in faster symptom appearance because the pathogen was introduced directly into the plant tissue. A similar leaf-to-whole plant spread concept has been used in pepper bacterial wilt bioassays, supporting the utility of direct tissue inoculation for generating synchronized wilt symptoms under controlled conditions (Kwon et al. 2021). This direct inoculation method shortened the time required for visible symptom expression and produced intermediate and severe wilt images within a narrower time window. Low-severity images were mainly obtained during the earliest stage after inoculation, whereas intermediate and severe wilt symptoms appeared rapidly as the disease progressed. These results indicate that the inoculation route substantially affects the speed of symptom development and can be used experimentally to generate a broad range of bacterial wilt symptom images.
Importantly, the symptom classes used in this study should be interpreted as image-level severity categories and not as definitive genetic resistance classes. Based on disease severity, a total of 1,500 images were collected, consisting of 500 low-severity, 500 intermediate-severity, and 500 severe-wilt images. These image classes represented visually distinguishable stages of wilt progression and were subsequently used for CNN model development (Fig. 2). This classification strategy was suitable for evaluating whether deep-learning-based image analysis could distinguish bacterial wilt symptom severity under controlled inoculation and imaging conditions.
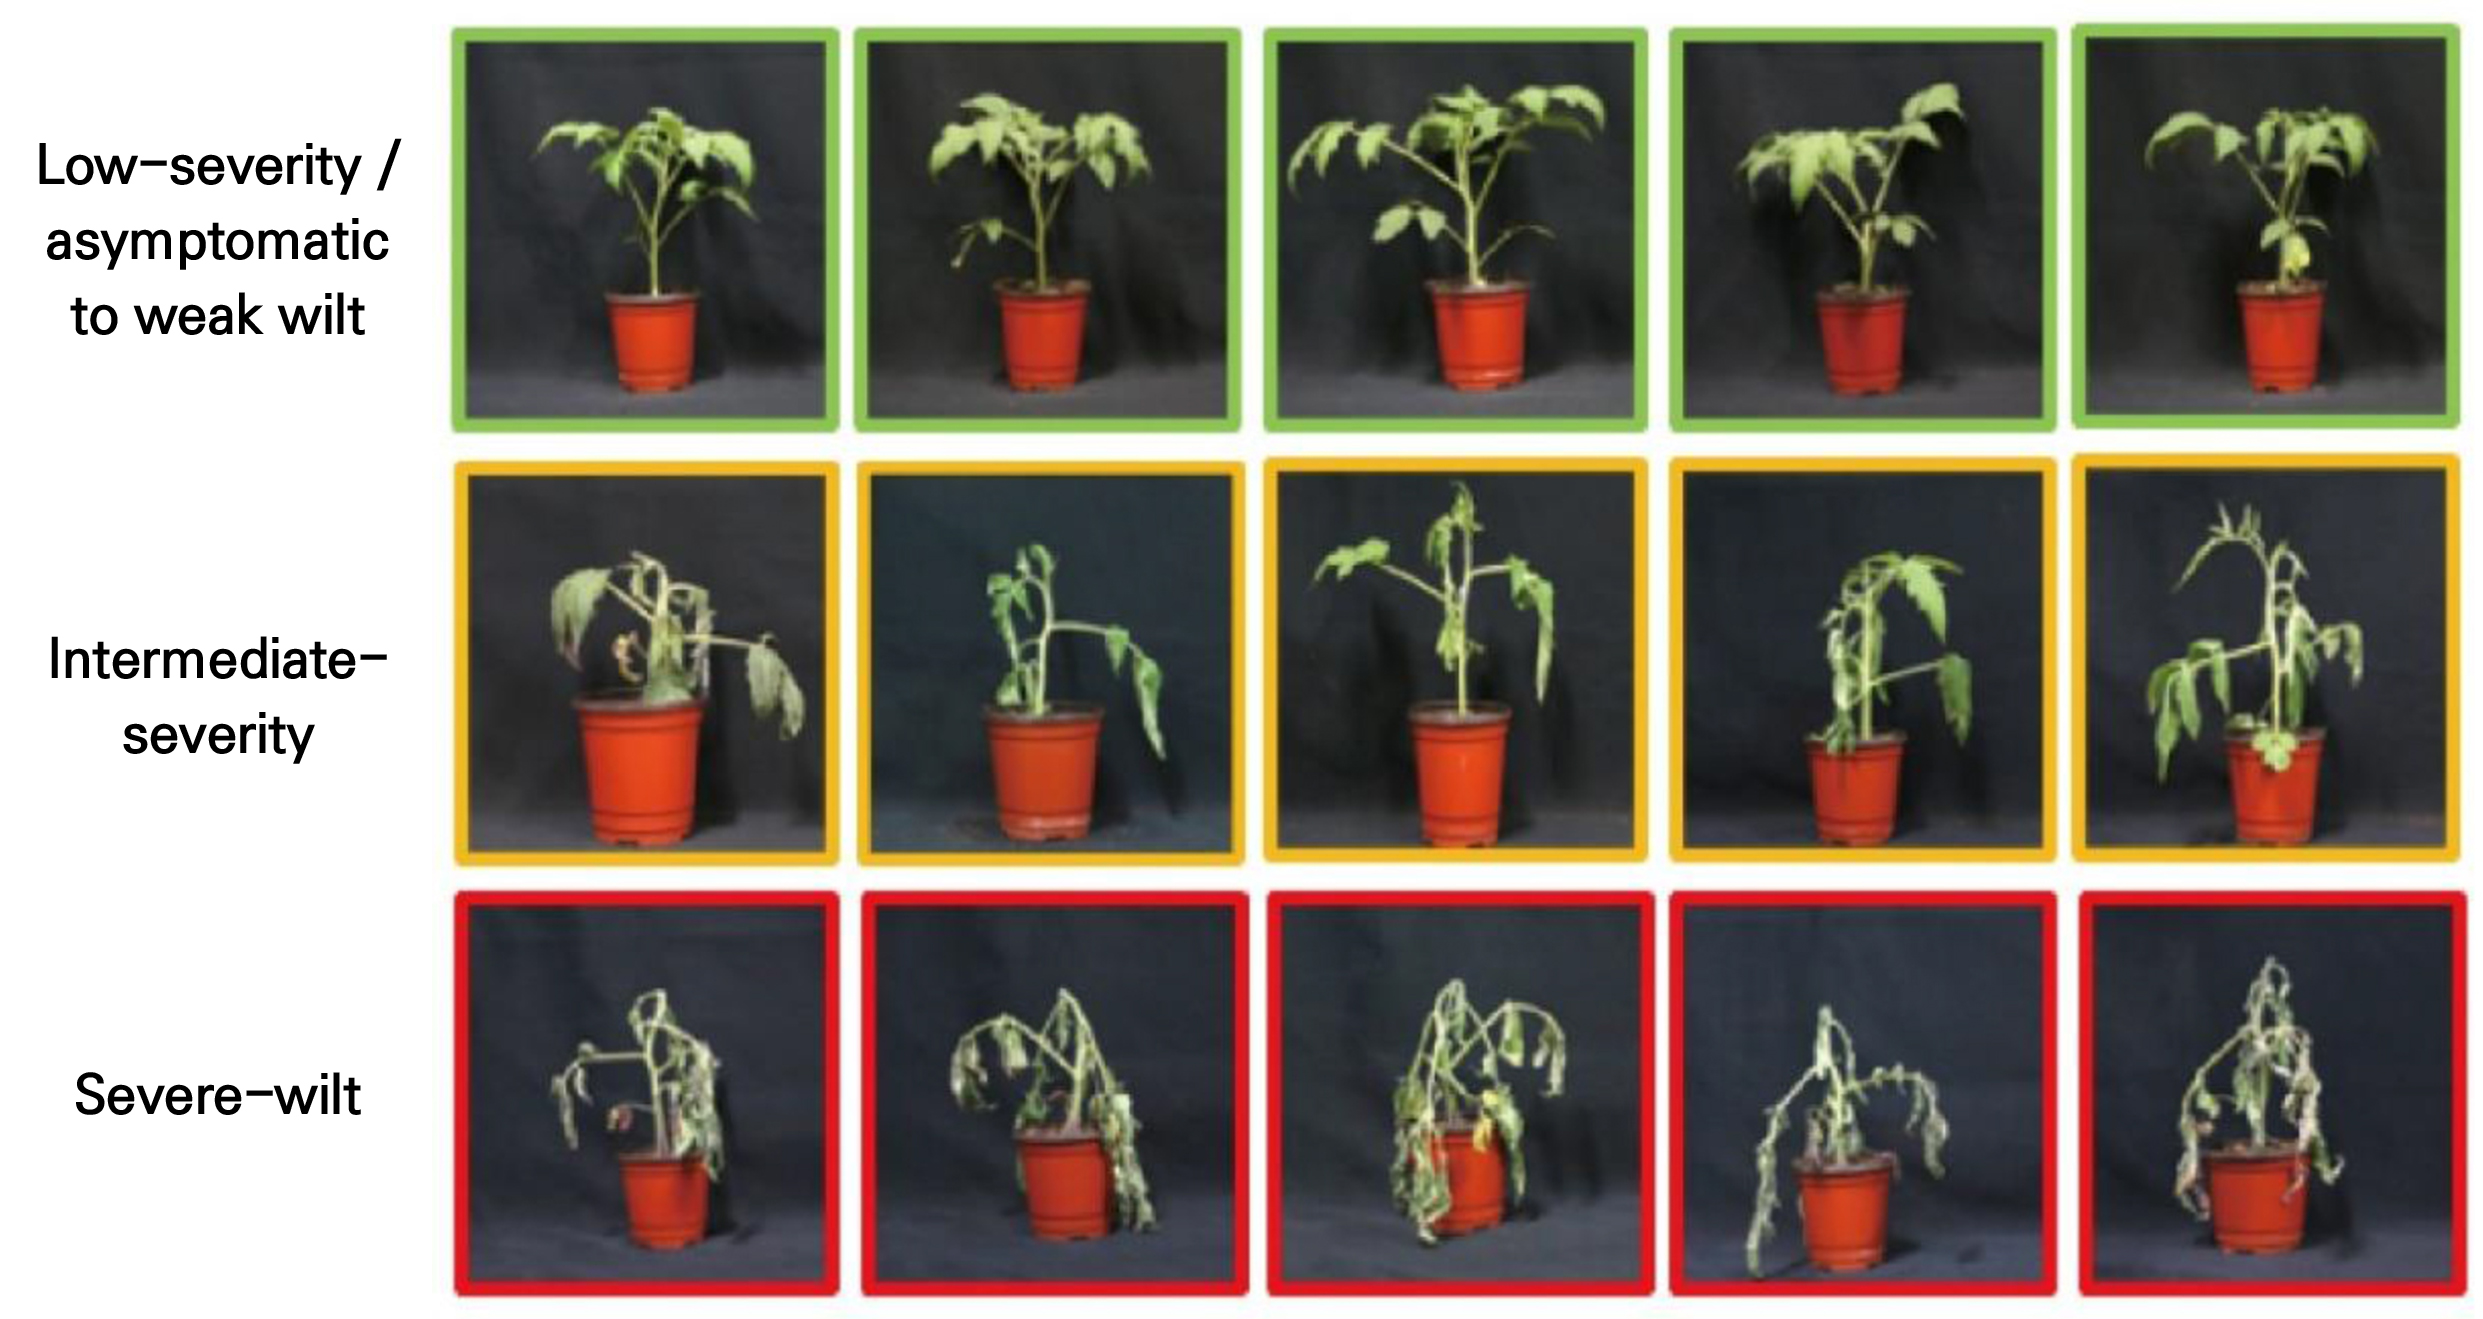
Fig. 2.
Representative symptom phenotypes of tomato bacterial wilt caused by Ralstonia pseudosolanacearum. Disease severity was evaluated using the following disease index (DI) scale: 0, no symptoms; 1, 1–25% wilting and leaf abscission; 2, 26–50% wilting and leaf abscission; 3, 51–75% wilting and leaf abscission; and 4, 76–100% wilting and leaf abscission. Plants with DI scores of 0–1 were classified as low-severity, those with DI scores of 2–3 as intermediate-severity, and those with a DI score of 4 as severe-wilt. Images were captured at symptom-stabilized timepoints following inoculation, which varied depending on the inoculation method and level of disease severity (shutter speed, 1/100 s; aperture, F7.1; ISO 3200).
Performance evaluation of the symptom classification model
The performance of the CNN model was evaluated by monitoring changes in accuracy and loss during training using the training and validation datasets (Fig. 3). Both training and validation loss decreased consistently throughout training and converged to comparably low values, without divergence between the two curves. Training and validation accuracy likewise increased in parallel, stabilizing at a high level after approximately 20 epochs. This close correspondence between training and validation performance indicates that the model generalized well to unseen validation images and did not exhibit substantial overfitting, despite the moderate size of the dataset.
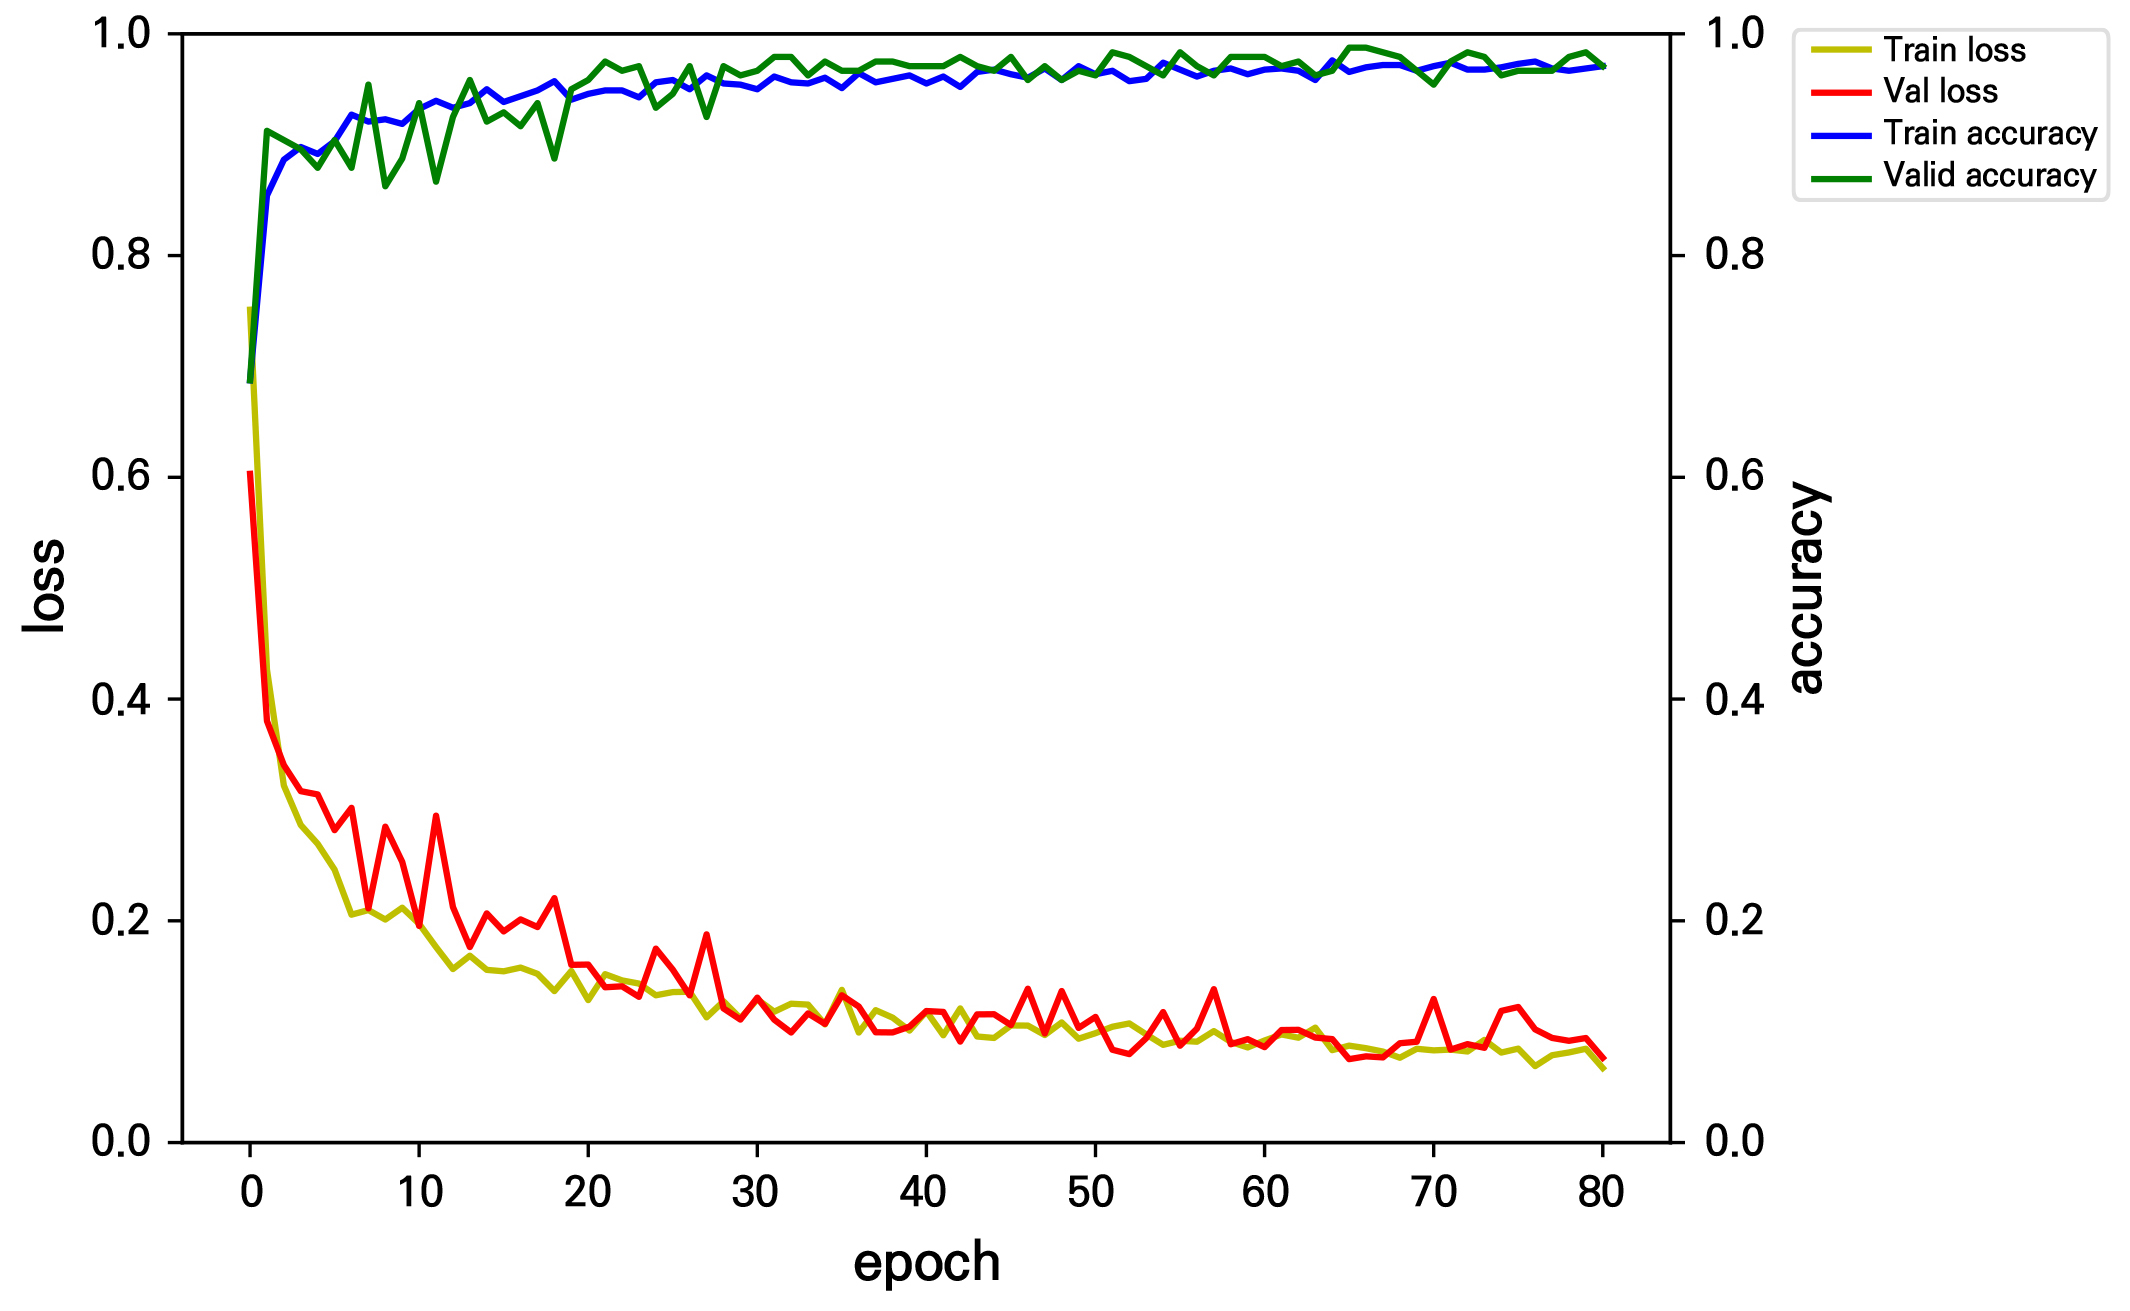
Fig. 3.
Training and validation performance curves of the CNN-based classification model. Loss (left axis) and accuracy (right axis) for the training and validation sets across training epochs. Both training and validation loss decreased consistently and converged to comparably low values (final loss ≈ 0.07–0.08) without divergence between the two curves, indicating that the model was not overfit to the training data. Training and validation accuracy likewise increased in parallel and stabilized near 0.97–0.98 after approximately epoch 20, with early stopping applied based on validation loss to retain the best-performing model.
This outcome can be attributed to two aspects of the model development strategy. First, on-the-fly data augmentation (random rotation, translation, zoom, brightness adjustment, and flipping) was applied to the training images, effectively increasing the diversity of visual features presented to the model during training and reducing its tendency to memorize individual training images. Second, a transfer learning approach using EfficientNetB0 pretrained on ImageNet was employed rather than training a CNN from randomly initialized weights; this allowed the model to leverage generalized visual features learned from a large external image corpus, which is particularly advantageous when the number of available plant individuals is limited. Together, these strategies contributed to stable convergence and reduced the training–validation performance gap commonly observed when CNNs are trained from scratch on comparatively small, domain-specific datasets (Abade et al. 2021; Ramanjot et al. 2023).
Application of the image classification system
The final classification performance of the CNN model was evaluated using a held-out test dataset that was not used during model training or validation. Among the 300 test images, 288 were correctly classified, resulting in an overall classification accuracy rate of 96.0% (Fig. 4). Specifically, the model correctly classified 97 of 100 low-severity images, 91 of 100 intermediate-severity images, and 100 of 100 severe-wilt images. In addition to overall accuracy, class-specific performance was evaluated using precision, recall, and F1-scores (Table 1). The CNN model achieved macro-averaged precision, recall, and F1-score values of 0.96, 0.96, and 0.96, respectively. The severe-wilt class showed the highest performance across all metrics (precision = 0.98, recall = 1.00, F1-score = 0.99), whereas the intermediate-severity class showed the lowest recall and F1-score outcomes (recall = 0.91, F1-score = 0.94) despite a comparatively high precision value (0.97), indicating that although most intermediate-severity predictions made by the model were correct, images forming a subset of true intermediate-severity images were misclassified as other severity levels.
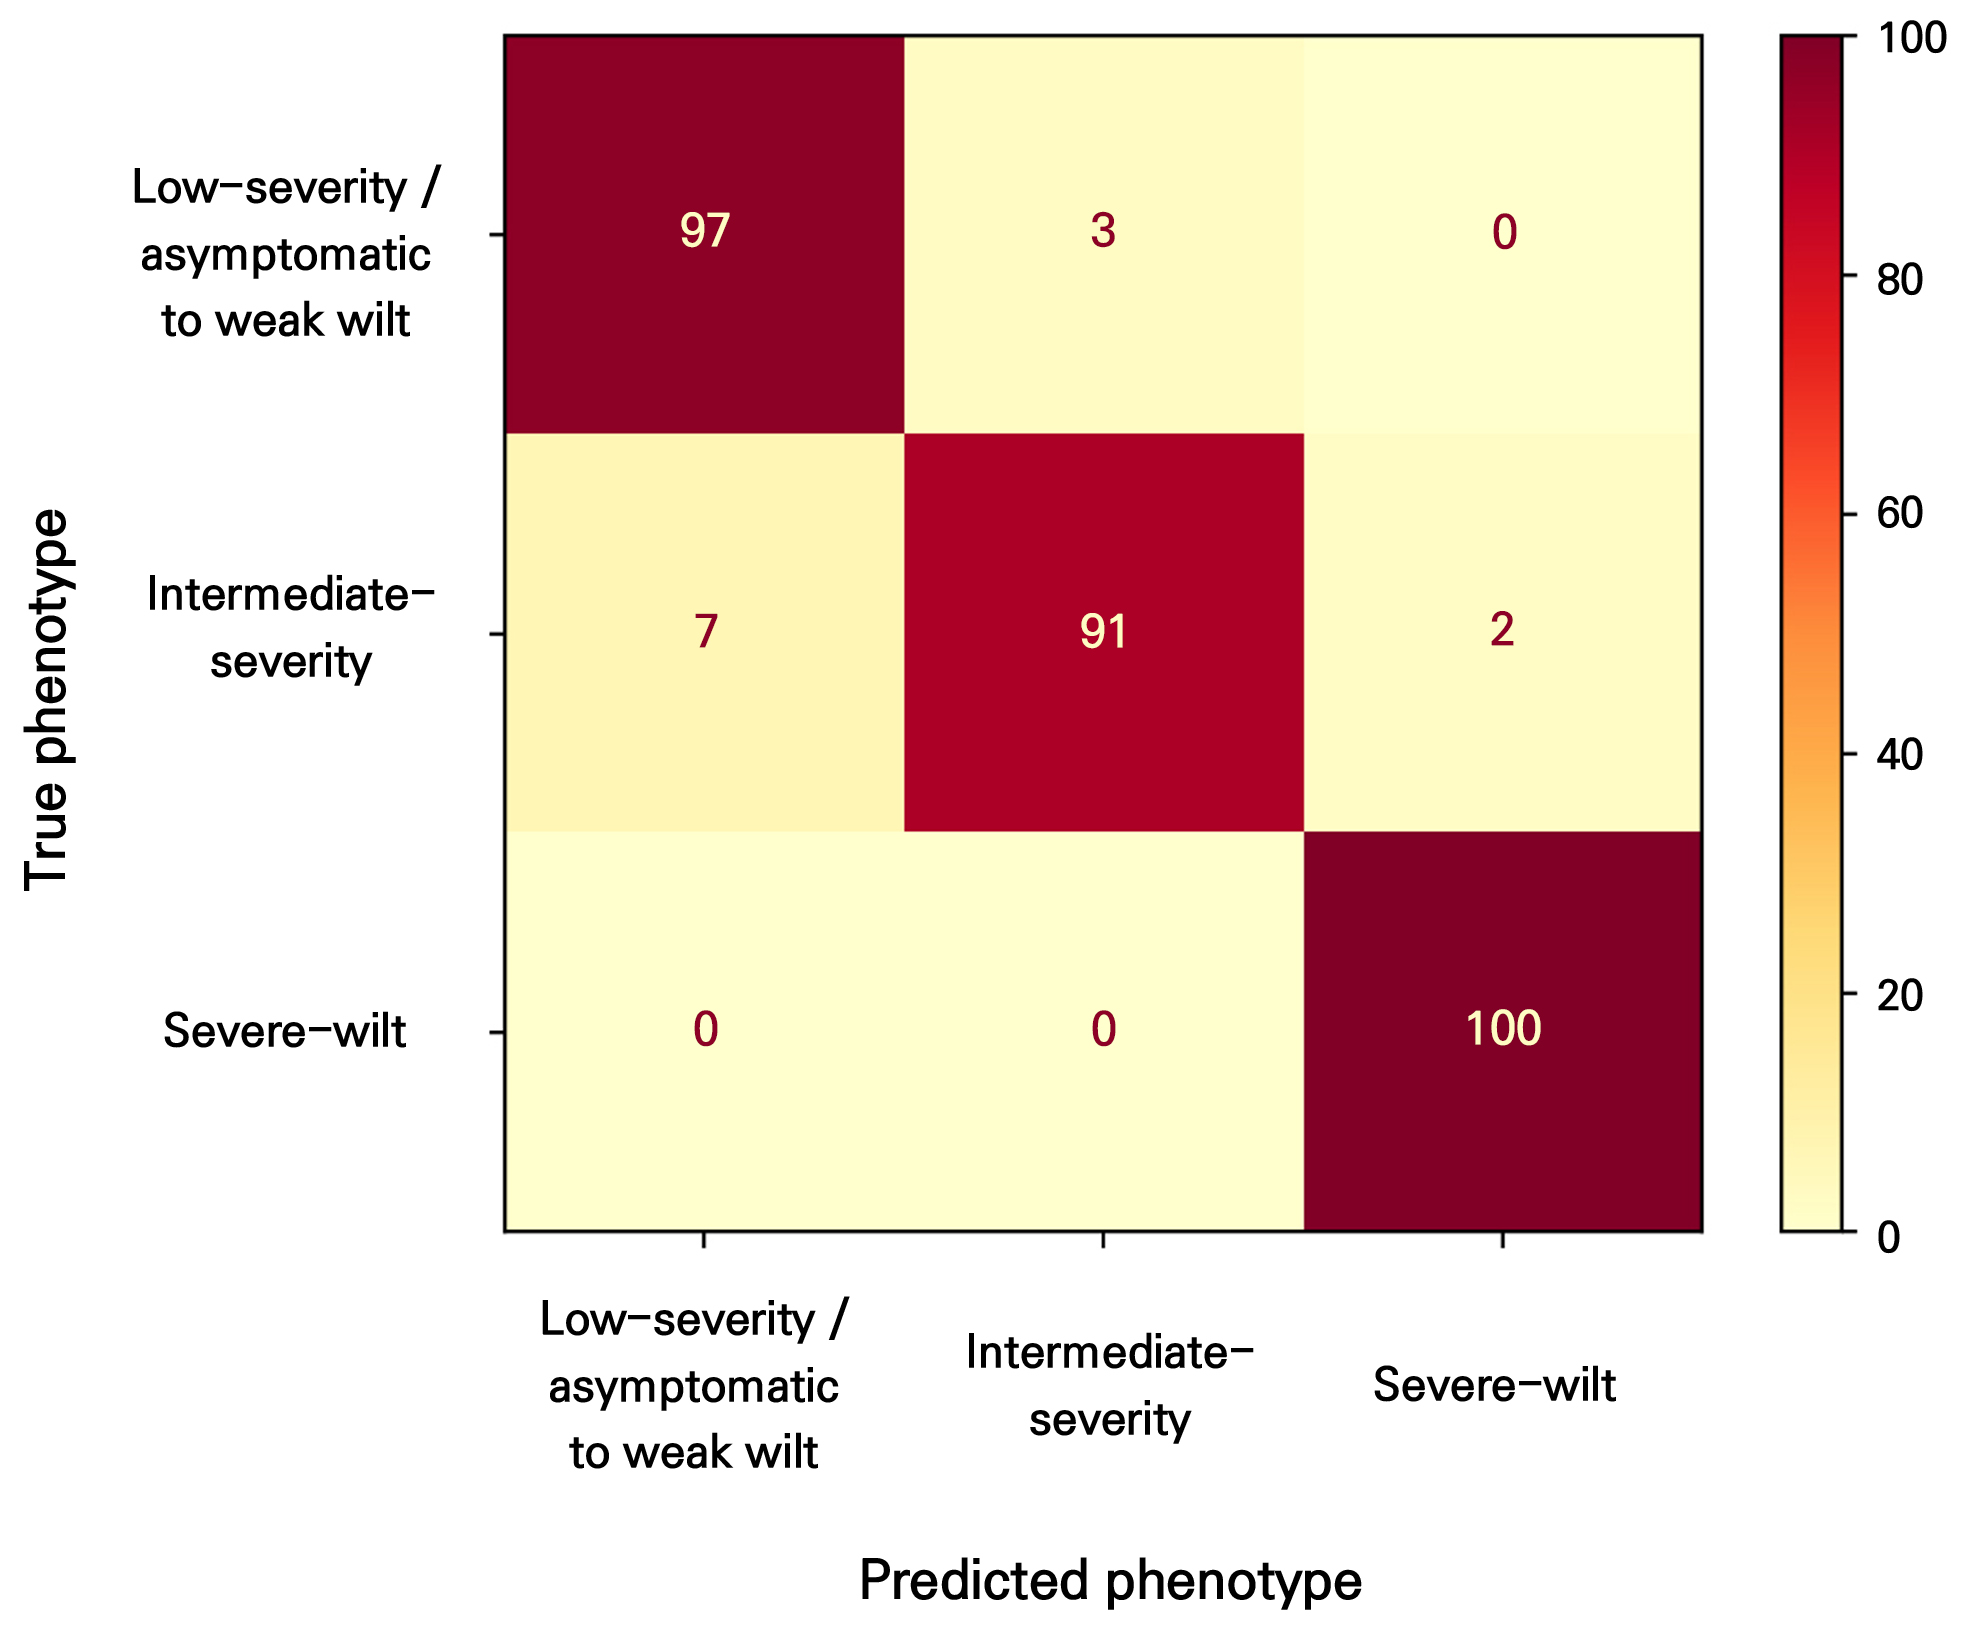
Fig. 4.
Confusion matrix of the CNN-based classification model on the independent test dataset. Performance evaluation of the CNN-based image classification model using an independent test dataset. Confusion matrix showing the classification results for the low-severity, intermediate-severity, and severe-wilt phenotypes. Among 100 images in each class, 97 low-severity, 91 intermediate-severity, and 100 severe-wilt images were correctly classified. Overall, 288 of 300 test images were correctly classified, corresponding to an accuracy rate of 96.0%.
Table 1.
Performance metrics of the CNN model on the held-out test dataset
Receiver operating characteristic (ROC) and precision–recall analyses further demonstrated strong discriminative performance across all three symptom-severity classes (Fig. 5). The area under the ROC curve (AUC) was 0.99 for both the low-severity and intermediate-severity classes and 1.00 for the severe-wilt class. Although the ROC performance was similarly high across the classes, the precision–recall curve for the intermediate-severity class showed a greater decline in precision at high recall, consistent with the relatively lower recall and F1-score observed for this transitional symptom category. Together, these results demonstrate that the CNN model was able to distinguish tomato bacterial wilt symptom severity from standardized images with high accuracy under controlled experimental conditions.
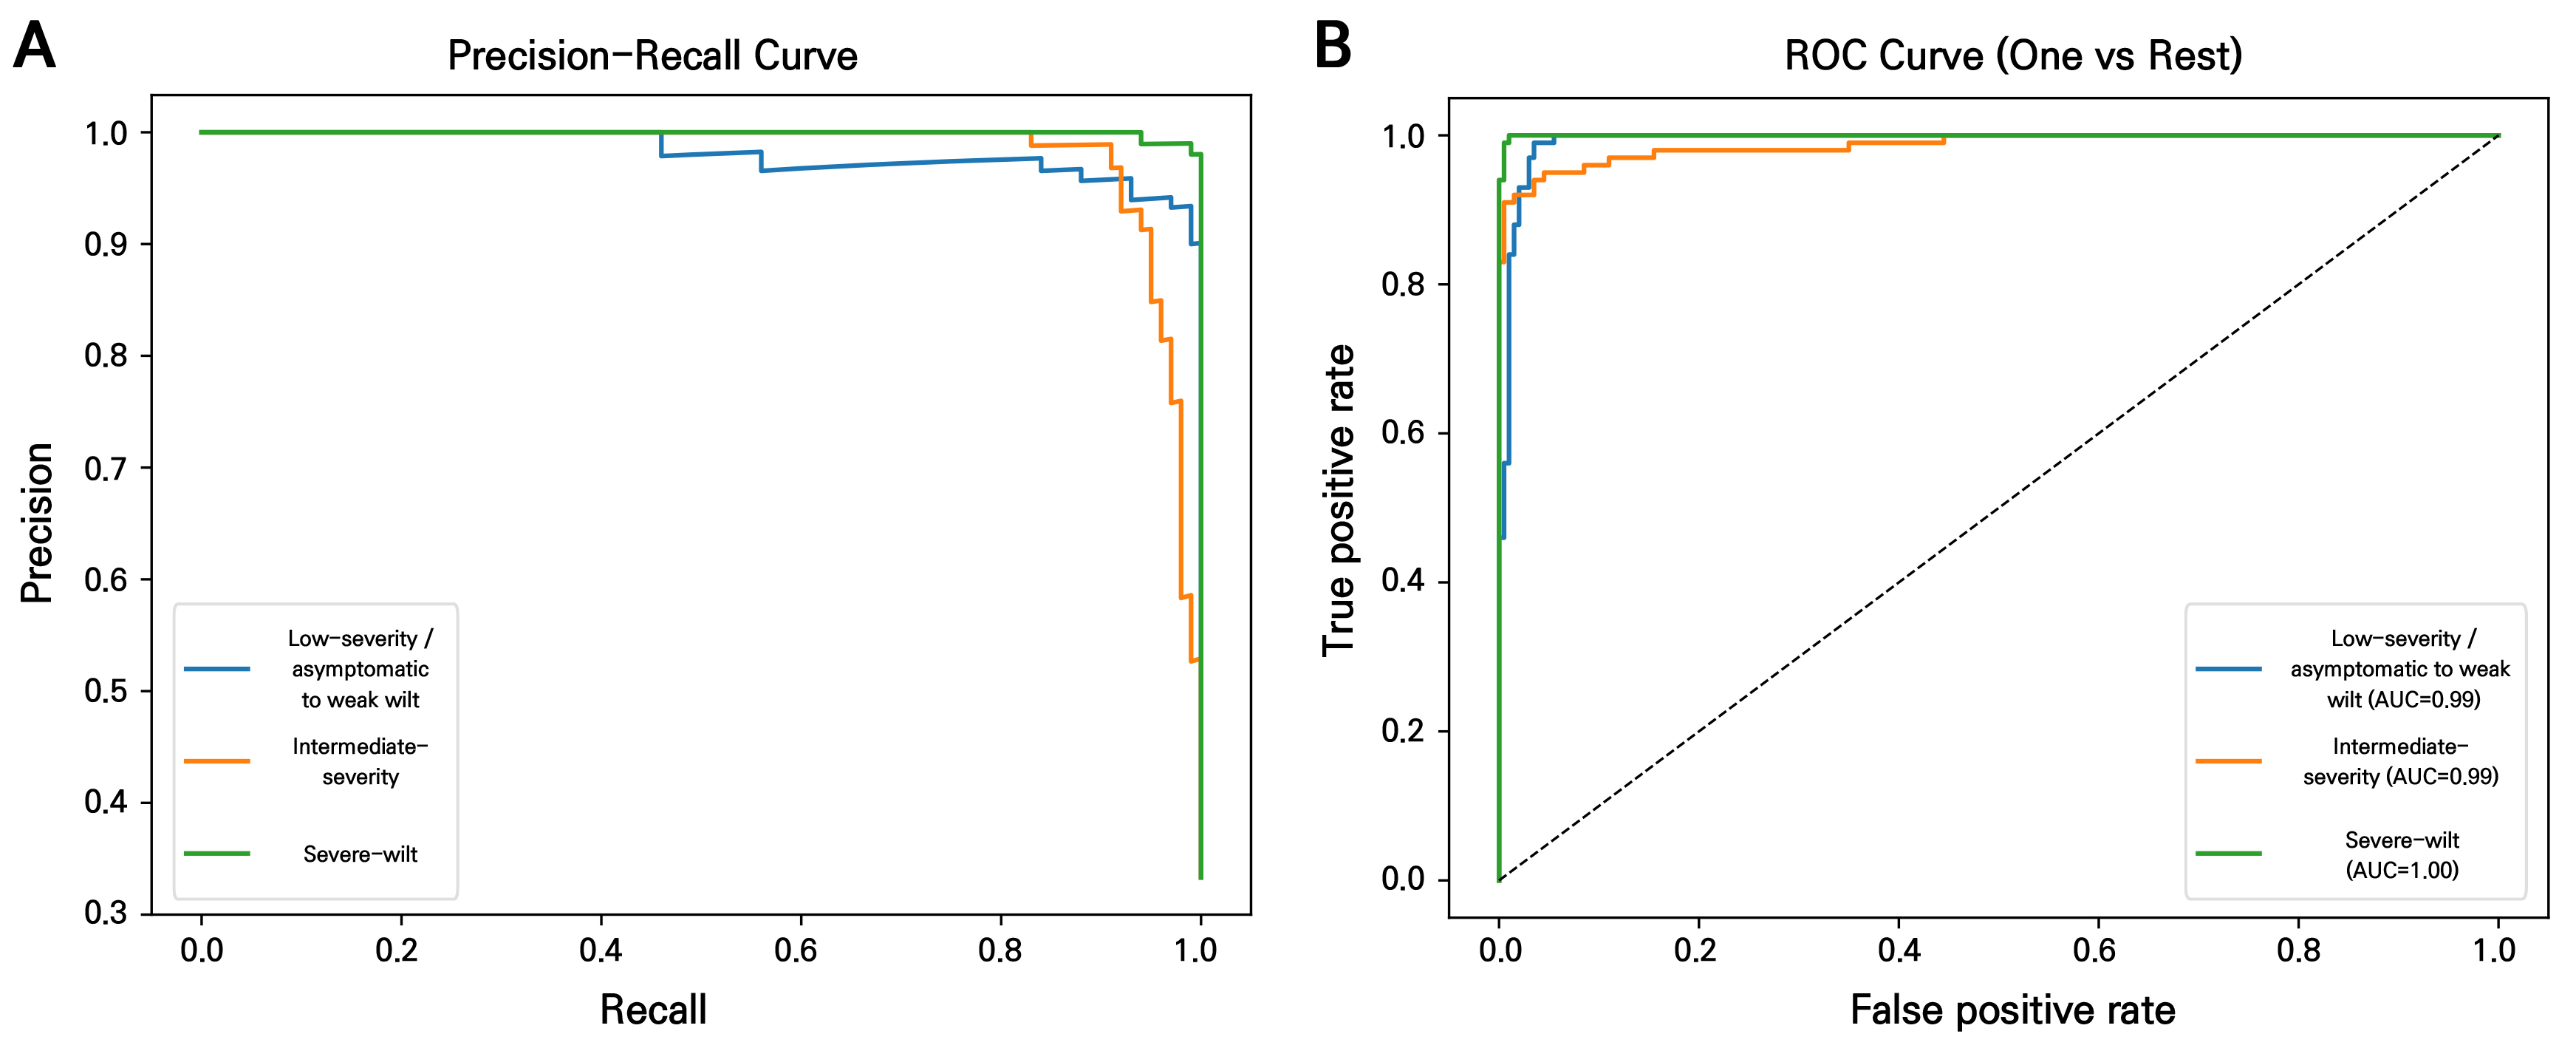
Fig. 5.
Performance evaluation of the CNN-based image classification model using an independent test dataset: (a) Precision-recall curves and (b) receiver operating characteristic (ROC) curves for the three symptom-severity classes—low-severity, intermediate-severity, and severe-wilt—evaluated using a one-vs-rest approach. The area under the curve (AUC) was 0.99 for the low-severity class, 0.99 for the intermediate-severity class, and 1.00 for the severe-wilt class, indicating strong discriminative performance across all three severity levels. While the ROC curves showed comparably high performance for all classes, the precision-recall curves revealed a more pronounced decline in precision at high recall for the intermediate-severity class, reflecting greater classification difficulty for this phenotypically intermediate category.
Class-wise performance differed among the severity categories. The severe-wilt class achieved the highest classification performance, including perfect recall, whereas the intermediate-severity class showed the lowest recall and F1-score. This result is biologically plausible because bacterial wilt develops as a systemic vascular disease with gradual symptom progression, and intermediate symptoms often share visual features with both low-severity and severe-wilt states. In contrast, severe wilt symptoms are visually more distinct because they involve extensive leaf collapse and whole-plant wilting. Analyzing the confusion matrix further showed that all misclassifications of intermediate-severity images were confined to the immediately adjacent severity classes, with a greater proportion assigned to the low-severity class (7 of 100) than to the severe-wilt class (2 of 100). Therefore, the main classification challenge was not the recognition of clearly diseased plants but the discrimination of transitional symptom stages, with a tendency to underestimate symptom severity in borderline cases.
From a phytopathological perspective, the lower rate of classification recall observed for the intermediate-severity class (0.91) is consistent with the systemic infection dynamics of R. pseudosolanacearum. Unlike foliar fungal or bacterial spot pathogens that generate discrete, localized lesions, bacterial wilt involves progressive vascular colonization, impaired water transport, and xylem dysfunction, resulting in whole-plant wilting along a continuous biological gradient. Consequently, plants at transitional boundaries, such as between DI 1 and 2 or between DI 3 and 4 can exhibit overlapping architectural phenotypes, including partial leaf flaccidity, incomplete canopy collapse, and early wilting of certain shoots. These visually ambiguous features may complicate categorical assignment by both conventional visual scoring and image-based classification. Thus, the observed misclassification pattern should be interpreted not simply as a model limitation but as evidence that transitional wilt stages require more standardized and objective decision thresholds for consistent symptom scoring during large-scale phenotyping and resistance-screening workflows.
This error pattern suggests that bacterial wilt symptom classification may be better represented as an ordinal or continuous severity-estimation problem rather than as the creation of a set of completely independent categorical classes (Wang et al. 2017). Future models could therefore be improved by applying ordinal classification, regression-based disease severity estimation, or time-series image analysis, which may better capture the progressive nature of bacterial wilt development, the ordered relationship among disease index classes, and the asymmetric misclassification pattern observed in this study.
To evaluate whether the model's classification decisions were based on biologically meaningful image regions, Grad-CAM was applied to the trained model (Fig. 6). Across all three severity classes, the model consistently attended to the plant foliage and stem structure rather than the background, pot, or measuring scale, indicating that classification decisions were driven by plant-specific morphological features rather than confounding artifacts of the imaging setup. This finding supports the biological validity of the model's predictions and suggests that the classification errors observed for the intermediate-severity class arose from genuine visual ambiguity in transitional wilt symptoms rather than from reliance on irrelevant image features.

Fig. 6.
Grad-CAM visualization of model attention across symptom-severity classes. Gradient-weighted class activation mapping (Grad-CAM) visualization of the trained model for two representative test images from each symptom-severity class, i.e., low-severity (top row), intermediate-severity (middle row), and severe-wilt (bottom row). For each pair, the original image (left) is shown alongside its corresponding Grad-CAM heatmap (right), where warmer colors (red/yellow) indicate image regions that contributed most strongly to the model's classification decision. Across all three classes, the model consistently attended to the plant foliage and stem structure rather than the background, pot, or measuring scale, indicating that classification decisions were driven by plant-specific morphological features rather than confounding artifacts in the imaging setup.
Overall, the present study demonstrates the feasibility of applying the CNN-based image analysis methodology to the task of tomato bacterial wilt symptom assessment. The proposed system can complement conventional visual scoring by applying consistent image-based decision rules and reducing evaluator-dependent variations (Furbank and Tester 2011). However, its current application should be interpreted as a controlled-condition symptom classification framework as opposed to a fully generalized field diagnostic system or a validated resistance-screening platform. Because the present dataset was generated from a limited set of tomato cultivars and a single R. pseudosolanacearum strain, broader validation across diverse tomato germplasm, resistant control lines, pathogen isolates, plant developmental stages, and imaging environments will be required before applying this method to a large-scale breeding program. Such expanded phenotyping datasets would be particularly valuable when combined with genomic and transcriptomic resources, as previous studies in pepper have shown that bacterial wilt resistance can be associated with sequence variations in candidate resistance genes and stress-responsive transcript isoforms (Kim et al. 2024; Kwon et al. 2024a).
Despite these limitations, the 96.0% accuracy rate obtained from the held-out test dataset indicates that CNN-based image classification, supported by transfer learning and image augmentation, can capture meaningful visual features associated with bacterial wilt symptom progression in tomato, while the Grad-CAM analysis further confirmed that this performance was grounded in biologically relevant plant regions rather than confounding image artifacts. With additional dataset expansion and external validation efforts, this approach could provide a useful digital phenotyping tool for standardized disease assessments and may support future resistance-screening workflows in tomato breeding programs. In future studies, standardized image-based phenotyping could be integrated with genome resequencing, transcriptomic profiling, and host–pathogen interaction analyses to connect symptom-level variations with resistance-associated genetic and molecular factors, as demonstrated in recent pepper bacterial wilt and plant–bacterial interaction studies (Kang et al. 2022; Kwon et al. 2024b; Shilpha et al. 2024; Shilpha and Kang 2025).
Conclusion
This study demonstrated the feasibility of using a convolutional neural network (CNN) to establish an objective, standardized classification framework for tomato bacterial wilt symptom severity to support resistance screening under controlled conditions. Using standardized multi-view images collected from two inoculation methods, the proposed model, developed via transfer learning with EfficientNetB0 and trained with image augmentation, achieved 96.0% accuracy on an independent, plant-level held-out test dataset and effectively distinguished low-severity, intermediate-severity, and severe-wilt symptoms. Although classification of intermediate symptoms remained comparatively more challenging owing to the continuous nature of disease progression, a Grad-CAM analysis confirmed that the model's predictions were based on biologically relevant plant regions rather than background artifacts. With further validation using diverse tomato germplasm, pathogen isolates, and imaging environments, this approach has the potential to support high-throughput digital phenotyping and standardized symptom assessments for future tomato resistance-screening workflows.
