

Introduction
Materials and Methods
Plant Material and N Treatments
Plant Appearance and Leaf N Concentration Measurements
Chlorophyll Fluorescence (ChlF)
Determination of Chlorophyll Content
Normalized Difference Vegetation Index (NDVI)
Statistical Analysis
Results
Morphological and Physiological Parameters of P. lanceolata during N Treatments
Relationships between Leaf N Concentration and Both Above-ground DW and Physiological Parameters
Discussion
Introduction
Nitrogen (N) is an essential nutrient representing the key growth factor for plants, as N levels determine leaf dry weight (DW), leaf area, leaf size, chlorophyll (Chl) content, and overall plant quality (Wang et al., 2012). Optimizing the fertilization strategy is critical for meeting the temporal and spatial N requirements of crops while protecting the environment and maintaining farm profitability. When a plant encounters N deficiency, symptoms such as upper leaf stunting and chlorosis, slow stem growth and short plant size, lower leaf red-spotting, slow growth, and short stem length are observed (Locke et al., 2011). Conversely, when the N level exceeds a plant’s requirements, consequent symptoms can include vein growth, large node intervals, excessive branching, and dark green leaves (Taiz and Zeiger, 2006). The efficient and responsible use of N fertilizers in sustainable agriculture is important for maintaining high crop yields and quality.
Total N diagnoses were the earliest and are still the most reliable methods for diagnosing N levels in plants. Total N concentration adequately reflects the N nutrient status of a plant and correlates well to crop yield within an acceptable range and therefore is an important diagnostic measure. Total N analysis is primarily performed using Kjeldahl steam distillation and colorimetric cards (Alam et al., 2005), but these methods are time-consuming or destructive. Since soil-plant analysis development (SPAD) linearly relates to Chl content, meter-read values represent N concentrations in leaves (Du et al., 2009). Therefore, SPAD is a useful tool for rapidly and non-destructively measuring leaf Chl content to evaluate fertilization efficiency (Boussadia et al., 2010). This technique has been extensively employed to evaluate the N demand of many crops, such as corn and wheat (Chen et al., 2010), rice (Yang et al., 2014), potato (Zeng et al., 2015), and geranium (Wang et al., 2012). Measuring chlorophyll fluorescence (ChlF), the initial sensitive value that represents the maximum quantum yield, is a simple, rapid, and accurate method that can be performed with portable equipment, during which no materials are consumed (Molina-Bravo et al., 2011). When a plant is grown under suitable conditions, its Fv/Fm value is appro-ximately 0.83 ± 0.04. When exposed to stress, the electron transfer chain is suppressed and consequently, the Fv/Fm value decreases drastically. The functioning of photosystem II (PSII) is related to foliar nutrition. Therefore, variable ChlF parameters are highly sensitive indicators representing the physiological status of stressed plants, providing a quick means to identifying plant physiological conditions (Ambrosio et al., 2006; Hirotsu et al., 2005; Souza et al., 2004; Špunda et al., 2005). Various reflectance spectra from leaves have been employed to calculate a series of vegetation indices used to monitor plant growth. Vegetation indices are combinations of surface reflectance values at two or more wavelengths designed to highlight a particular property of vegetation. Different theoretical models based on leaf reflectance can be used to predict leaf Chl content, water content, and other variables associated with vegetative structure (Devitt et al., 2005; Strachan et al., 2002). Nor-malized differentiation vegetation index (NDVI) is a sensitive indicator of canopy structure, green biomass, green leaf area index, Chl content, and foliar N concentration (Bajwa et al., 2010). However, non-destructive spectral detection techniques using these indices have mainly been used in botanical studies involving extensive monitoring of field crops by satellites to rapidly assess nutrient status and to predict yield. Few such studies have focused on landscape plants or bedding/ornamental plants grown in greenhouses, such as Pentas lanceolata.
Measurements of plant quality can be classified into three categories: morphological, physiological, and performance (Ritchie et al., 2010). Some of these qualities are not commonly measured, as measuring their performance can be time-consuming and labor/space-intensive. Therefore, relatively simple, precise, non-destructive methods are needed to characterize and predict N application needs using morphological and physiological measurements that are correlated with subsequent growth. N fertilization within the proper concentration range not only increases the yield of a crop and reduces costs, but it also minimizes environ-mental pollution. In fact, only a very small proportion of applied N is absorbed and utilized by the plant; the N use efficiency of global crops is merely 33%, with even lower percentages found in developing countries (Raun and Johnson, 1999). In addition, 70% of the N in leaves is contained in Chl (Madakadze et al., 1999), resulting in a high correlation between Chl content and N concentration. The objective of this study was to detect the timing of demand for N fertilizer application for P. lanceolata through non-destructive measurements of ChlF, SPAD, and NDVI. Conventional methods were also employed to co-determine leaf N con-centration. Correlations between parameters obtained via destructive and non-destructive methods were established, and individual non-destructive methods were shown to be useful for determining optimum N fertilization rates. To the best of our knowledge, this is the first report examining the use of non-destructive techniques to determine the proper timing for N-solution irrigation for a single species.
Materials and Methods
Plant Material and N Treatments
Star cluster (Pentas lanceolata), an evergreen bedding plant, is one of the few ornamental plants that grow well in the high temperatures and humidity of Taiwan summers and is commonly used in flower beds. This species is sensitive to changes in N content and has a rapid phenotypic response to N level. Therefore, it was used as a model for developing non-destructive monitoring and optimal N management techniques for other plants. Star cluster plants were purchased from local gardens in Taipei, Taiwan, for our experiments. Plants 25-30 cm in height were trans-planted into 5-inch plastic pots containing a commercial potting soil mixture consisting of peat moss and perlite at a ratio of 4:1 (v/v) and placed in a controlled-environment greenhouse under a 13 h photoperiod with an irradiance of 400 μmol・m-2・s-1 at 28/22°C day/night temperatures and relative humidity of 70%. The plants were evenly spaced to encourage similar growth rates and sizes. Plants were watered three times a week, and an optimal amount of a compound fertilizer solution (20N-8.7P-16.6K water- soluble fertilizer at 0.5 g・L-1) was applied once a week and maintained for 30 d. Plants of similar height and stem diameter were then selected and randomly separated into five groups for the 30 d experiments. Nutrient solutions (500 mL) prepared from osmotic water at five different N concentrations (0, 4, 8, 16, and 24 mM) were applied to each pot weekly during the experiments. N fertilizer solutions contained 1 mM MgSO4・7H2O, 2 mM CaCl2・2H2O, 3 mM K2SO4,1 mM Ca (H2PO4), and 1 mM CaSO4, with the major-element composition modified from Johnson’s solution (Johnson et al., 1957). Six replicates each of the five N treatments were randomly placed within the green-house, and after 30 d of treatment, leaves and other tissues from each plant were measured for morphological and physiological indices at 1200 to 1500 hrs. A leaf from each plant was also measured to create leaf N concentration calibration curves as a reference for plotting against other morphological and physiological parameters. The experiment was performed twice independently using a randomized design of growth environment, sampling day, and morpho-logical and physiological analyses.
Plant Appearance and Leaf N Concentration Measurements
Plant height (cm) was measured with a ruler from the soil surface to the tallest apical bud. Root collar diameter (mm) was measured at 1 cm under the soil surface using a Vernier caliper. Sturdiness quotient (SQ) was calculated by dividing plant height by root collar diameter. Shoot/root (S/R) ratio was measured as shoot dry weight (g) divided by root dry weight (g). Dickson quality index (DQI) was measured as plant total dry weight (numerator) divided by the summation of SQ and S/R ratio (denominator): DQI = total dry weight / (SQ + S/R) (Dickson et al., 1960). Samples were dried in an oven at 70°C for 4 d to obtain dry weights. The total number of leaves on each plant was counted. Flowering rate (%) was quantified as the ratio of the total number of flowers to the leaf canopy area.
For N concentration analysis, 3 mg of a milled leaf sample was packaged into a 30 mm tin cup and analyzed using a Nitrogen and Carbon Analyzer (Flash EA 1112) coupled to a Delta Plus XP isotope ratio mass spectrometer (Finnigan Conflo III control unit; Thermo Fisher Scientific Corporation, Milan, Italy). Combustion and reduction temperatures were set to 900°C and 680°C, respectively (Nieuwenhuize et al., 1994). Atropine (C17H23NO3, ≥ 99%; TLC, Sigma, USA) was used as the standard for calibrations and system checks for determining N concentration (Coplen, 1995).
Chlorophyll Fluorescence (ChlF)
ChlF parameters were measured at ambient temperature in dark-adapted plants for 30 min with a portable modulated fluorometer (Monitoring-Pam Multi-Channel Chl Fluorometer, Heinz Walz GmbH, Inc., Effeltrich, Germany). The middle portions of mature, healthy, fully expanded third leaves of plants were targeted for measurements. The minimal chlorophyll fluorescence (Fo) and maximal chlorophyll fluorescence (Fm) of dark-adapted samples were determined using modulated irradiation of a weak blue LED beam (measuring light) and saturating pulse, respectively. The maximum photochemical quantum yield (Fv/Fm) was then calculated, where Fv is the yield of variable fluorescence calculated as Fm - Fo. When measuring Fv/Fm, it is important that the samples are well acclimated to dark conditions so that all reaction centers are in the open state and non- photochemical dissipation of excitation energy is minimal. Each sample was continuously irradiated with actinic light for 6 min. An actinic light intensity of 1500 μmol・m-2・s-1 was selected, which is equivalent to the intensity of the actual growth light. During the light-adapted state, the F’ was detected, which is the value shortly before a saturating pulse is applied. A saturating pulse at 4,000 μmol・m-2・s-1 was subsequently imposed to determine the maximum fluorescence level (Fm’). The Fm’ is the maximum chlorophyll fluorescence level in the light. The effective photochemical quantum yield of PSII (△F/Fm’) in the light-adapted state was calculated as ∆F / Fm’ = (Fm’ - F’) / Fm’ in which ∆F is the variation in chlorophyll fluorescence levels between Fm’ and F’. The quantum yield of electron transfer at PSII is a measurement of the overall efficiency of the PSII reaction centers. qP = (Fm’ - F’)/(Fm’ - Fo’), where Fo’ is the minimal fluorescence level of an illuminated sample that is lower than Fo. The Fo’ level is determined during a dark interval following the saturating pulse (Kitao et al., 2006; Porcar- Castell et al., 2008). Measurements were recorded using WinControl-3 software (Heinz Walz, Effeltrich, Germany).
Determination of Chlorophyll Content
Leaf chlorophyll content was measured using a chlorophyll meter (SPAD-502; Minolta Camera Co., Japan). Measurements were collected from three mature leaves from the middle to upper portion of each plant and averaged (Bonneville and Fyles, 2006). Leaf veins were avoided during measure-ment.
Normalized Difference Vegetation Index (NDVI)
Leaf reflectance spectroscopy was performed using mature, healthy, fully expanded third leaves at wavelengths of 305-2150 nm at 1 nm intervals using a Handy Spec Field 2.2 Tec5 spectrophotometer (Oberursel, Germany). Various spectra were used to calculate the vegetation index and to obtain useful information related to leaf N concentration, such as NDVI, which is calculated as (R750 - R705)/(R750 + R705 - 2 × R445) (Sims and Gamon, 2002).
Statistical Analysis
Measurements of morphological and physiological para-meters were analyzed by a completely randomized analysis of variance (ANOVA) that compared the different concent-rations of N application for each parameter. For significant values, means were separated by the least significant difference (LSD) test at p ≤ 0.05 using Costat 6.29 (CoHort Software, Berkeley, CA, USA). To investigate whether vege-tation indices were sensitive to leaf N concentration, the coefficients of R2 between the indices and leaf N concentration were examined by regression analyses. Leaf N concentration corresponding to the best morphological parameter was calculated according to the best growth quality of a plant, and the calibration curve was used to determine the corresponding physiological parameter. Model datasets were developed based on 30 leaves per N treatment group, and leaf N concentration was calculated using physiological data from model validation datasets. Several models were tested, with the nonlinear regression model was selected as the best interpretation of the relationship between the vegetative index and leaf N concentration. All models were evaluated for goodness of fit by graphical analysis of residuals, computing R2. Leaf N concentration and the best vegetative index were further used as indicators of N- fertilization requirements.
Results
Morphological and Physiological Parameters of P. lanceolata during N Treatments
Leaf N concentration (%) significantly increased with increasing N-fertilizer concentration (mM). For example, N8 treatment, which involved application of an 8 mM N-fertilizer solution to plants, resulted in a leaf N concent-ration of 4.00 ± 0.02%. Therefore, N irrigation concentrations at 0, 4, 8, 16, and 24 mM corresponded to average leaf N concentrations of 2.62, 3.48, 4.00, 4.23, and 4.69%, respectively (Table 1). Among the eight morphological and five physiological parameters examined, the trends and rates of DQI, above-ground dry weight (DW), total DW, flower rate, △F/Fm’ ratio, and qP progressively increased from N0 to a peak at N8 and decreased thereafter. These six indices were significantly different only when using the 8 mM treatment. For example, plants in the 8 mM group had a significantly higher DQI level (0.35) compared to the other four treatments, ranging from 0.23 (N24) to 0.32 (N16). Plants subjected to 0 mM N had the lowest above-ground DW (2.10 g); however, above-ground DW (2.79 and 2.14 g, respectively) and total DW were reduced under 16 and 24 mM N treatment, suggesting that such high N concentrations inhibited growth. SQ values gradually and slightly decreased from N0 (8.55) to N24 (6.73). S/R ratios were significantly higher from N16 and N24 than from N0 and N4. Leaf numbers remained high from N0 (32.01) to N16 (40.00) and then significantly dropped to the lowest number (26.67) at the highest N concentration (N24). In addition, there were no significant differences in root collar diameter among plants irrigated with 0-16 mM N (4.40-4.27 mm), but plants irrigated with 24 mM N had the smallest average root collar diameter (3.93 mm), suggesting that excessive amounts of N reduce root collar diameter in P. lanceolata. Flowering rate increased with increasing N application and reached a peak (71%) at N8, followed by a drop to the lowest level (40%) at N24. △F/Fm’ also increased with increasing N application, reached a peak (0.137) at N8 and then dropping to the lowest level (0.09) at N24. Interestingly, Fv/Fm values were not signifi-cantly different among N treatments. The qP increased with increasing N level, peaked (0.244) at N8 and dropped to the lowest level (0.175) at N24. By contrast, increases in SPAD and NDVI values were noted in all plants with increasing N application level, and plants irrigated with 16 and 24 mM N had significantly higher SPAD and NDVI values than those of the other treatments. Overall, P. lanceolata had different responses to different N concent-rations based on morphological and physiological parameters.
Relationships between Leaf N Concentration and Both Above-ground DW and Physiological Parameters
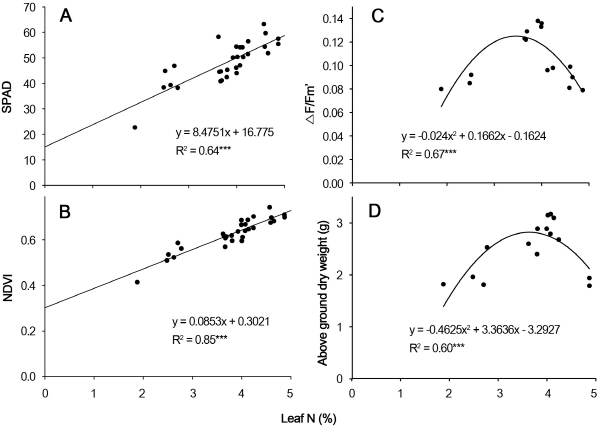
We determined the optimal timing of N fertilizer appli-cation based on leaf N concentration, as revealed by mor-phological and physiological parameters. We used a Monitoring-PAM device, spectrophotometer, and Chl-meter reading device to measure leaf Chl fluorescence ratio, NDVI, and SPAD, respectively, providing useful information about leaf N concentration. The calibration curves of leaf N concentration (%) and the corresponding morphological and physiological parameters reveal information about SPAD, NDVI, △F/Fm’, and above-ground DW and serve as a reference for predicting the N-demand time for P. lanceolata. The relationships among leaf N concentration, SPAD, and NDVI were linear (Fig. 1A and B) but between F/Fm’ and above-ground DW, they were nonlinear (Fig. 1C and D). Regression analysis showed that SPAD, NDVI, △F/Fm’, and above-ground DW were significantly correlated with leaf N concentration, with R2 = 0.64, 0.85, 0.60, and 0.67 (p < 0.001), respectively, suggesting that leaf N concentration measured by NDVI is the best index for predicting N concentration in P. lanceolata. While NDVI is useful for determining N level, it does not reveal whether N has reached the saturation threshold. Above-ground DW increased with increasing leaf N from 0 to 4.00%, but beyond this level, the above- ground DW started to decline. The curves for above-ground DW and △F/Fm’ showed similar trends, i.e., their values increased when N levels were below 4% and started to decline with further increases in N. These results indicate that optimal growth and quality were obtained using 8 mM N fertilizer, as measured using both destructive and non-destructive methods.
Discussion
DQI incorporates three parameters (total DW, SQ, and S/R ratio) and serves as a useful indicator of seedling survival rate, growth performance, and plant quality, especially during seedling selection (Dickson et al., 1960). A higher DQI value indicates a more desirable phenotype: the greater the DQI value, the better the plant quality, as high DQI values indicate robustness and balance in the distribution of biomass in shoots (Scalon et al., 2014). In this study, plants fertilized with 8 mM N possessed the highest DQI values (Table 1), probably because total DW was heavily weighted in the DQI equation and under this N concentration, the plants gained the largest above-ground DW. The DQI values obtained in this study suggest that N8 and N16 treatments are acceptable for P. lanceolata, based on our observations that some leaves looked epinastic with N24 treatment whereas most leaves and flowers appeared healthier throughout the N8 and N16 treatments (photos not shown). DQI also rose as N concentrations increased up to 16 mM, followed by a drop to its lowest value at 24 mM N, perhaps due to N toxicity (Bayala et al., 2009). DQI provides an objective rating of plant quality by integrating morphological parameters that contribute to the perceived quality of a plant, and it also serves as a predictor for soil fertility. Furthermore, plants irrigated with 8 mM N had the highest total DW and above-ground DW compared to other concentrations, suggesting that dry matter accumulation in plants is mainly controlled by a balance between sources and sinks, leading to a larger net gain in photosynthesis, higher growth potential, and better quality (Manas et al., 2009). The accumulation of plant mass is mainly controlled by the source and sink tissues of photosynthesis and has a direct impact on plant appearance, e.g., the number of leaves in a plant. Among the different N application levels, the 8 mM group had increased vegetative growth and retained more photoassimilates in above-ground tissues, leading to greater leaf and flower numbers. This might be attributed to the highest above-ground DW and best performance of ChlF parameters observed in this group, reflecting optimal photosynthetic capacity. However, 24 mM N fertilizer was too concentrated to enable effective rooting, resulting in inhibited growth and reduced flowering rate and leaf number. Thus, the phenotypes of the same plant species responded differently to different N application rates.
In addition, plants treated with 0 mM N had the largest SQ values and root collar diameters, while those irrigated with 24 mM N had the lowest values, indicating that applying N to P. lanceolata reduced SQ due to reduced plant height but increased branch number, resulting in plants that were more compact and dwarfed (photos not shown). In addition, the S/R ratios of plants treated with 0 and 4 mM N fertilizers were significantly smaller than those treated with 16 and 24 mM N fertilizers, implying that excessive N can inhibit root growth and may have a negative effect on overall plant quality (Wilson and Jacobs, 2012).
Under natural conditions, photosynthesis is regulated biochemically in response to environmental changes to maintain a balance between the rates of component processes and metabolite concentrations. Photosynthesis is sensitive to environmental changes. Photoinhibition of photosynthesis is characterized by a reduction in the quantum yield of photochemistry and reduced ChlF, which entails both inhibition of PSII and increased thermal de- excitation of excited Chl (Demmig-Adams et al., 1996). The △F/Fm’ ratio reflects the actual photochemical capacity of PSII under bright conditions, which correlates linearly with the efficiency of CO2 fixation. This index reflects photosynthetic potential as well as the potential for photo-chemical dissipation, and it reveals the percentage of PSII that is open and its effectiveness in capturing photo energy from light-harvesting complexes and subsequent transfer of quanta. When the light energy absorbed by plants is not completely quenched, the excessive energy inhibits activity of the photosynthesis system, causing the termination of the PSII reaction due to its partially reduced state (Fracheboud and Leipner, 2003). In the current study, when plants were subjected to 8 mM N, the △F/Fm’ started to change, and its value revealed the saturation point for leaf N concentration, which also matched the largest above- ground DW (Table 1, Fig. 1C and D). However, after this saturation point was reached, above-ground DW did not increase but instead exhibited a downturn as leaf N con-centration increased due to the presence of extra N. Hence, △F/Fm’ might replace the use of above-ground DW for determining the negative inflection points for corresponding SPAD and NDVI values, which would allow for rapid and non-destructive determination of optimum N concentrations for different plant species. When plants were subjected to N16 and N24 treatments, PSII function was damaged by photoinhibition resulting from stomatal factors; therefore, declining △F/Fm’ and qP values suggest that PSII is impaired or damaged (Gulías et al., 2002). △F/Fm’ and qP values declined to a greater degree after N24 treatment versus N8 treatment, which may be due to greater photoinhibition in plants with fewer leaves (Table 1). Having fewer leaves increases the likelihood of photoinhibition, as characterized by a decline in leaf ChlF, and photoinhibition generally occurs more slowly in plants with more leaves. The functions of Chl in the thylakoid membrane are highly sensitive to various morphological parameters, which directly or indirectly affect the functioning of PSII.
NDVI is used to assess Chl content and as an index of soil fertility (Whitehead et al., 2005). In addition, NDVI is also used to assess N utilization efficiency and to predict crop yields, and N fertilizer requirements can be obtained via the N fertilization optimization algorithm (Bajwa et al., 2010). Indices involving these spectral bands can be used to estimate Chl levels in the leaves of various plant species (Huang et al., 2012). Inoue et al. (1998) examined the relationship between N fertilizer applications and reflec-tance spectra in field corn and found that vegetation indices of R1100 and R660 had the highest correlations with N application, where NDVI is calculated as (R1100 - R660)/ (R1100 + R660). Furthermore, Xue et al. (2004) determined that the reflectance ratio of 810 nm to 560 nm (R810/R560) is linearly related to leaf N concentration. In the current study, reflectance indices were useful to measure leaf N concentration in P. lanceolata when developing indices for non-destructive Chl estimation, and NDVI was used to assess Chl content and photosynthetic capacity. Because leaves from the N24 treatment group were ‘‘greener’’ than N0- treated leaves, both SPAD and NDVI values were typically lower for the latter (Table 1). The higher SPAD and NDVI values of N24-treated leaves compared to N0 leaves indicate that N0-treated leaves had lower Chl contents, which is consistent with visual observations (photos not shown). Moreover, these vegetation indices were significantly and highly correlated with leaf N concentration (Fig. 1 A and B).
We expect that the new index can be comprehensively used to estimate which plant contains the index and leaf N concentration with the highest R2 and to determine optimal N-fertilizer application timing and rates. N application levels (mM) were reflected in leaf N concentration (%), and above-ground DW was significantly correlated (R2 = 0.60) with leaf N concentration (%), which was also highly correlated with SPAD, NDVI, and △F/Fm’ (Fig. 1 A-C), demonstrating the applicability of these non-destructive estimators for measuring leaf N concentration in P. lanceolata. The highest △F/Fm’ and above-ground DW occurred at an optimal N application rate of 8 mM N (Table 1). Dry weight decreased after peaking at 4.00% of leaf N con-centration (or equivalent) under 8 mM N fertilization, and SPAD, NDVI, and △F/Fm’ values under N8 treatment were 50.68, 0.64, and 0.137, respectively. Fig. 1D clearly suggests that a 4.00% leaf N concentration and △F/Fm’ value of 0.137 are critical turning points and that N-solution irrigation should be performed when the plant ChlF index is ≤ 0.137. Although plant visual appearance remained unchanged at this point, physiological changes had already begun. When △F/Fm’ and above-ground DW decreased 15% from the highest saturation point value, leaf N concentration was reduced from 4.00% to 3.29% and the values of SPAD, NDVI, and △F/Fm’ were reduced from 50.68 to 44.66, 0.64 to 0.58, and 0.137 to 0.125, respectively, indicating that these plants needed to be irrigated with N-solution fertilizer. Therefore, we suggest that when the vegetation index reaches values of 44.66-50.68 for SPAD, 0.58-0.64 for NVDI, or 0.125-0.137 for △F/Fm’, it is time to irrigate P. lanceolata plants using 8 mM N-fertilizer solution.
