

Introduction
Materials and Methods
Growth Circumstances and Plant Material
Growth Circumstances and Plant Material
HPLC Analysis
Total RNA Isolation, cDNA Synthesis, PCR
Quantitative Real-Time PCR
Statistical Analysis
Results
RAS Gene Identification
Changes of RAS Expression during Ontogenesis
Changes of RAS Expression Levels and RA Contents due to Environmental Factors
Discussion
Introduction
Garden thyme is a perennial shrub (Ch, i.e., chamaephyte) that originated in the Mediterranean region. This species prefers calcareous soils with good water permeability, while it poorly tolerates high soil water levels (Bernáth and Németh, 2007). Garden thyme provides Thymi herba (essential oil content exceeding 12 ml·kg-1) and Thymi aetheroleum (essential oil of Thymus vulgaris and T. zygis) drugs (Pharmacopoeia Hungarica VIII, 2004), which are included in the European Pharmacopoeia as well. The main active compound is the essential oil (1.5–2.5%), which contains thymol, carvacrol and cymol among several other compounds. In addition to the essential oil, Thymi herba contains flavonoids (apigenin, luteolin, thymonin, cirsilineol, 8-methoxy-cirsilineol, etc.), caffeic acid, rosmarinic acid (RA) and saponins (ESCOP, 2003).
RA is a common secondary metabolite in the Lamiaceae family (Pedersen, 2000) that also occurs in the Boraginaceae family (Litvinenko et al., 1975). It has various biological activities, such as anti-inflammatory, antioxidant, astringent, antibacterial, antiviral and antimutagenic effects. Its biosynthesis starts with L-phenylalanine and L-tyrosine amino acids. After several enzymatic steps, 4-coumaric-CoA and 4-hydroxyphenyllactic acid are synthesized, which are the two direct precursors of RA. These precursors are connected by an ester linkage between the carboxyl group of 4-coumaric acid and the hydroxyl group of 4-hydroxyphenyllactate. This reaction is catalyzed by hydroxycinnamoyl-CoA:hydroxyphenyllactate hydroxycinnamoyltransferase, i.e.. rosmarinic acid synthase (RAS; E.C.2.3.1.140) (Scarpati and Oriente, 1958; Petersen et al., 1993; Trócsányi et al., 2020).
Aromatic plants and herbs accumulate high levels of important secondary metabolites as a means of coping with environmental stressors, such as drought (Selmar and Kleinwächter, 2013; Kleinwächter and Selmar, 2015). Several studies have presented the effects of environmental factors on the production of secondary metabolites (Bettaieb et al., 2011; Manukyan, 2011; Gharibi et al., 2019). The water supply may influence the accumulation of polyphenols, including that of RA, and the effect is species-specific (Németh-Zámbori et al., 2017). Temperature also greatly affects the production of secondary metabolites. Secondary metabolites are known to stimulate heat stress tolerance and contribute to cellular homeostasis (Ramakrishna and Ravishankar, 2011). Alhaithloul et al. (2019) undertook a comprehensive examination of the effects of heat and drought stress on secondary metabolites in Mentha piperita L. and Catharanthus roseus L., finding that the contents of total phenols, flavonoids and saponins decreased, whereas the contents of tannins, alkaloids, terpenoids and soluble sugars increased. They concluded that increased levels of sugars and some secondary metabolites contribute to the maintenance of growth under stress conditions by improving the plant water potential and increasing ROS scavenging, thereby preventing the damaging effects of drought and heat stress (Alhaithloul et al., 2019).
Although the accumulation potential of secondary metabolites is basically defined by the genome, phenology and seasonal changes of environmental factors during the vegetation period can lead to the alteration of the metabolome through gene expression changes (Gosztola et al., 2010; Kindlovits et al., 2014; Stafiniak et al., 2021). The effects of abiotic and biotic factors on the accumulation of RA were demonstrated in in vitro systems (Hippolyte et al., 1992; Yan et al., 2006; Kim et al., 2013). In the current study, our goal was to study whether the transcriptional regulation of RA biosynthesis could be proven. We also aimed to document seasonal changes of the RAS gene expression levels and RA contents in garden thyme considering the effects of the water supply and temperature on these values.
Materials and Methods
Growth Circumstances and Plant Material
The effects of phenological phases on the Thymus vulgaris variety ‘Pannon timol’ were studied in an open-field experiment in 2015 and 2019. ‘Pannon timol’ is a local Hungarian cultivar bred by colleagues from our university. Several years old individuals were available from the experimental field of the university and were used for our observations. The experimental field of the Hungarian University of Agriculture and Life Sciences lies in a suburb of Budapest, (47°54’N, 19°14’E) at 86 m above sea level. Temperature and precipitation data for both years were measured by the local meteorological station of the university, as shown in Fig. 1, while the main soil parameters of the experimental site are summarized in Table 1.
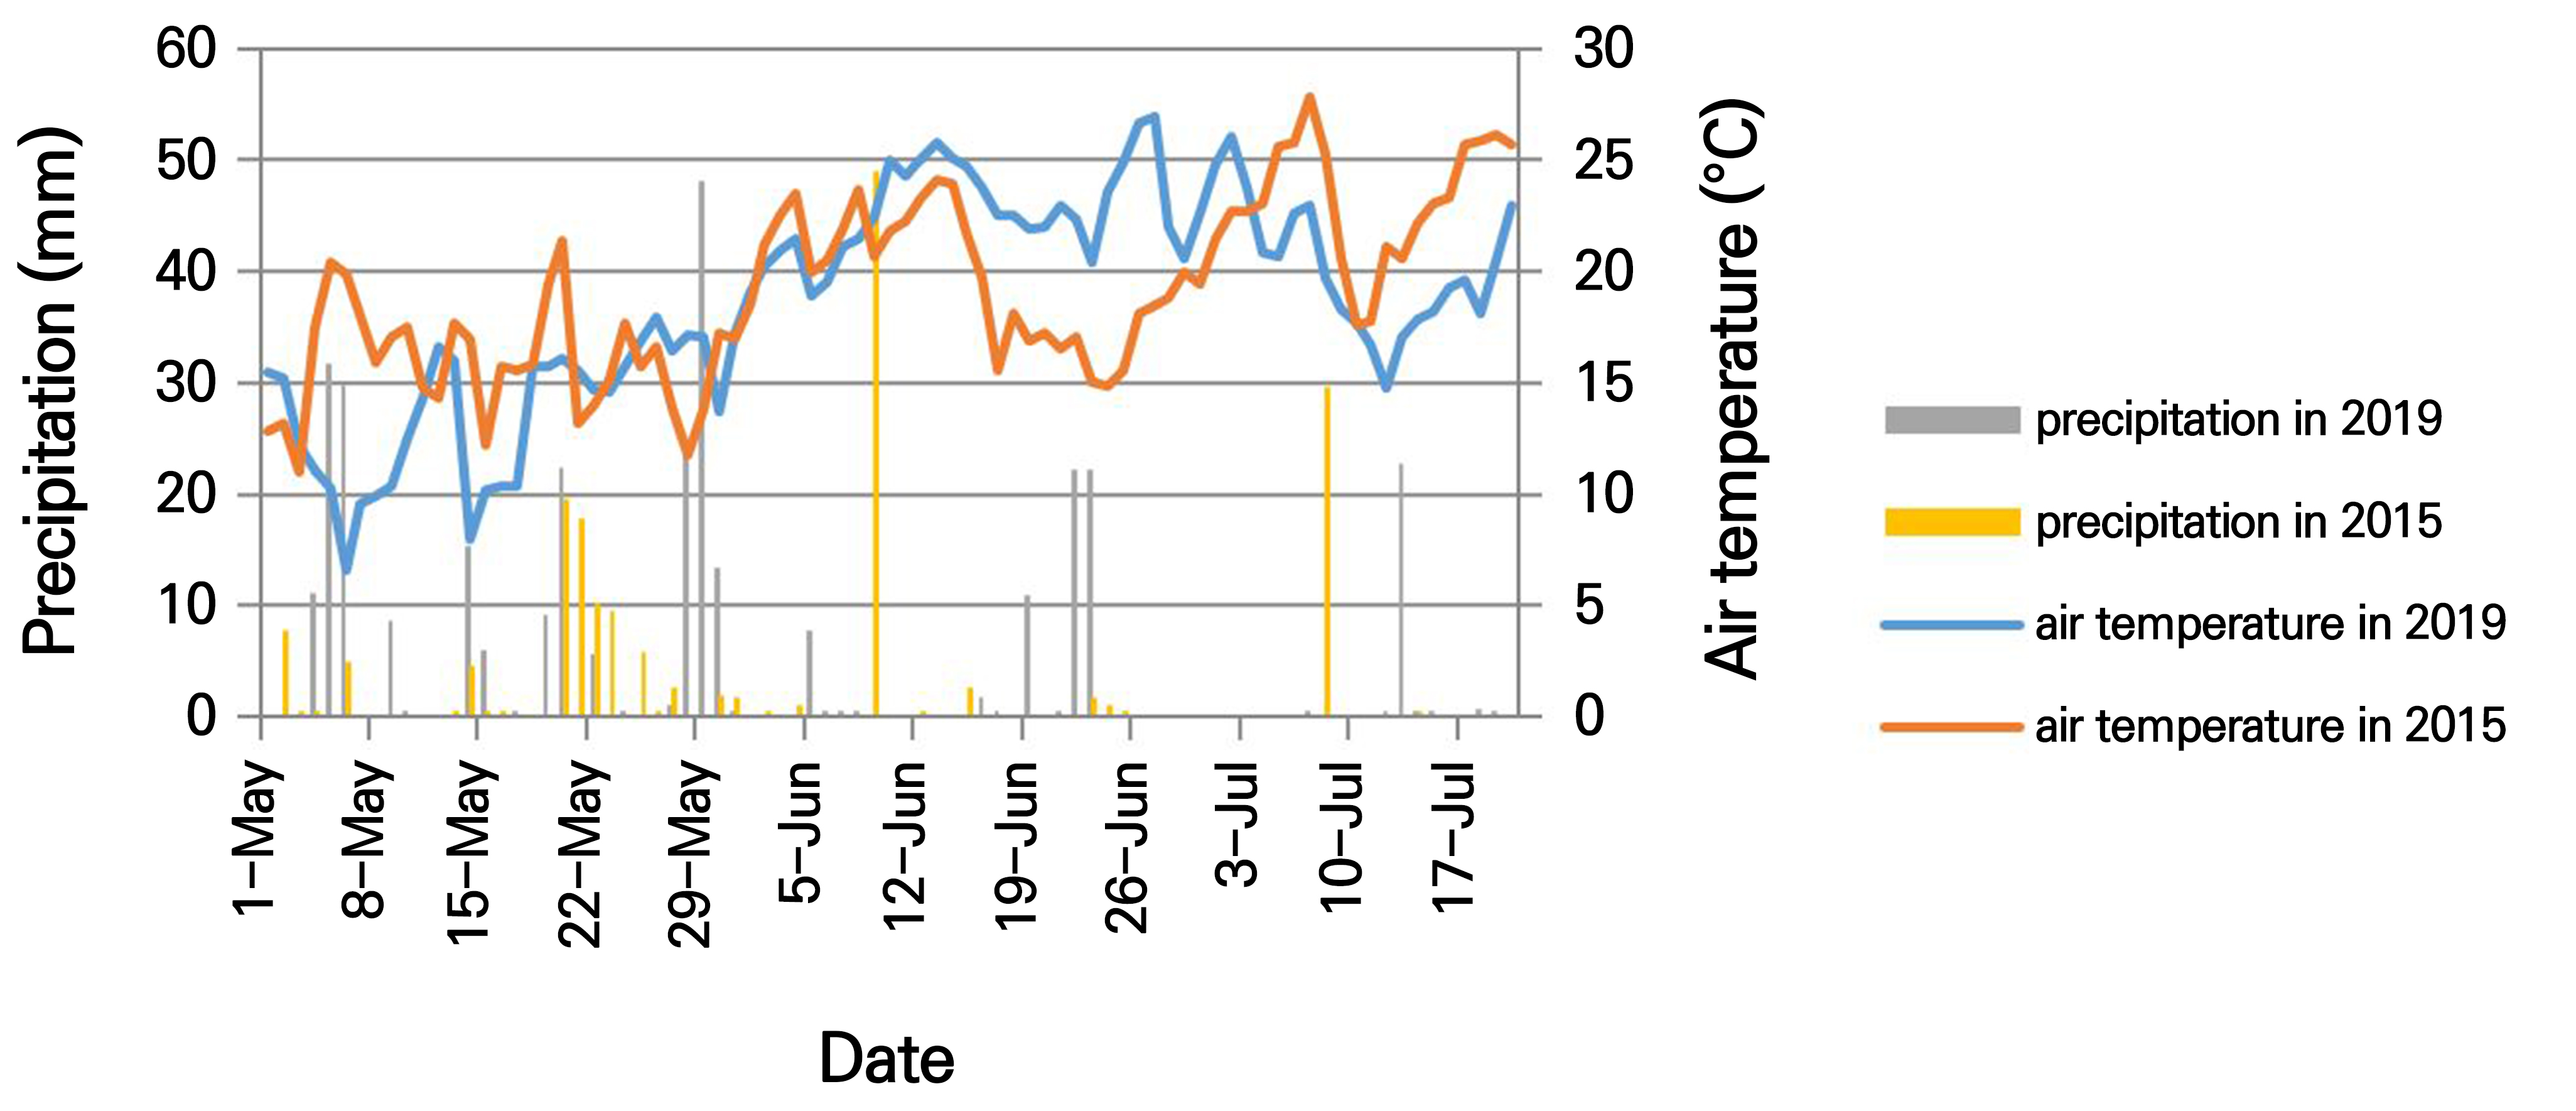
Table 1.
Main soil characteristics at the experimental filed
| Soil characteristic | Value at experimental field |
| pH | 6.91 |
| Humus % | 0.87 |
| NO3-N (mg·kg-1) | 7.73 |
| P2O5 (mg·kg-1) | 583 |
| K2O (mg·kg-1) | 189 |
| Ca% | 0.51 |
| Mg (mg·kg-1) | 32.1 |
The effects of the temperature and water supply were studied under controlled conditions. Two experiments were set up, one in 2016 and the other in 2019. The T. vulgaris ‘Varico 3’ variety (Mediseed, Switzerland) was chosen, as it is an internationally known and popular cultivar and was available in a local nursery. In 2016, eight-month old plants were used, while in 2019 three-year-old individuals were used. The conditions of the trial are shown in Table 2. The experiments were conducted in a Weiss-Gallenkamp SGC-120 climatic chamber. The relative humidity was 50% through the experiment. Illumination was adjusted to 15000 lux and a 12-hour light period was applied during a two-week acclimatization period. Subsequently, 20000 lux illumination and the same 12-hour light period were maintained. In the first year, the plants were planted in 7.5 l pots filled with the FlorascaBio “B” medium (10% sand, 65% peat, 25% cattle manure), while in 2019 the plants were potted with the original sandy soil of the experimental field (Table 1). An additional nutrient supply was not applied. Shoots with flower buds were removed.
After acclimatization, the soil water regimes of the pots were established. For the control plants, a 70% SWC (soil water capacity) was used, and for the treated plants, 40% SWC (Table 2) was applied. An additional regeneration phase at 70% SWC was included as the last phase of the experiment (Table 2). The soil water capacity was determined by the Reynolds (1970) gravimetric method, and the plants were irrigated three times a week by filling up the pots to a predetermined weight. As a second treatment, different temperature settings were applied, as indicated in Table 3.
Table 2.
The irrigation methods in the climatic chambers and the sampling times in 2016 and 2019
Table 3.
The temperature settings in the climatic chambers in 2016 and 2019
| Temperature [°C] (day/night) | Duration | |
| ‘cold’ chamber | ‘warm’ chamber | |
| 20/15 | 20/15 | 2 weeks |
| 20/15 | 20/15 22/16 24/17 25/18 | 4 weeks |
| 20/15 | 25/18 | 4 weeks |
| 20/15 | 25/18 | 4 weeks |
| 20/15 | 25/18 | 4 weeks |
Table 4.
Sampling times for the field experiments
Growth Circumstances and Plant Material
During the course of the field experiment, three individuals were sampled consecutively in five phenological stages (Table 4). In the climatic chambers, 3–5-cm-long vegetative shoots were collected every four weeks (Table 2). Half of the samples were dried at room temperature for determination of the RA content, with the remaining half frozen in liquid nitrogen and stored at ‒80°C until RNA isolation. In 2016, mass samples were collected to avoid stress due to sampling, as the plants were smaller, but in 2019, fully grown plants were sampled individually in three replicates.
HPLC Analysis
The RA standard compound was purchased from Sigma-Aldrich (St Louis, MO, USA). High-performance liquid chromatography (HPLC) grade methanol and acetonitrile were purchased from Fischer Scientific Co. (Fair Lawn, NJ, USA); LiChropur formic acid and acetic acid were obtained from Merck (Darmstadt, Germany). Purified water was prepared using a Millipore Direct-Q system (Millipore Corp., Bedford, MA, USA).
The samples for the chemical analysis were dried in air at a temperature of 24°C for ten days. The dried aerial parts were ground with a pestle and mortar and the dry weight was recorded. The ground plant material was suspended in 45 ml of methanol (50%) and extracted in an ultrasonic water bath for 30 min. After filtration, the solution was completed to 50 ml. Quantitative measurements were executed on a Waters Acquity UPLC system (sample manager, binary solvent manager, PDA detector) (Waters Corporation, Milford, MA, USA). The samples were analyzed using a Waters Acquity UPLC BEH C18 column (100 × 2.1 mm i.d; 1.7 µm; Waters Corporation, Milford, MA). The mobile phase consisted of 0.1% v/v formic acid (A) and acetonitrile (B). The gradient program was as follows: 0 min 20% B, 5 min 50% B, 6 min 100% B, 7 min 100% B, and 8 min 20% B with a 0.4 ml·min-1 flow rate and 5 µL injected volume and with the column temperature set to 25°C.
A stock solution of RA was made by dissolving the standard substance in methanol to gain a 1 mg·ml-1 concentration. Calibration standards were prepared by diluting the stock solution. A seven-point calibration curve was prepared using the following: 100 µg·ml-1, 50 µg·ml-1, 10 µg·ml-1, 5 µg·ml-1, 1 µg·ml-1, 0.5 µg·ml-1 and 0.1 µg·ml-1 concentration levels. Calibration was based on a triplicate analysis of each working solution. The peaks of RA were integrated at their absorption maxima (330 nm). The calibration curves were plotted using a 1/x-weighted linear model for the regression of the peak area vs. the analyte concentration. The correlation coefficient was 0.998 (after weighing). The limit of quantitation was determined as 0.15 µg·ml-1 and the limit of detection was 0.47 µg·ml-1.
Total RNA Isolation, cDNA Synthesis, PCR
RNA was isolated with a CTAB-based method from previously frozen samples (Jaakola et al., 2001). The RNA concentration was measured spectrophotometrically (NanoDrop ND-1000, Bio-Science, Hungary) and the quality levels of the samples were checked on 1% TBE agarose gel. RNA samples were treated with DNase (DNase I, Rnase-free, Thermo Scientific) and the concentration was equalized before cDNA were synthetized (SensiFAST™ cDNA Synthesis Kit, Bioline). Forward and reverse primers were designed based on the Melissa officinalis RAS sequence (Accession number: FR670523, NCBI GenBank, (Weitzel and Petersen, 2011)). The sequence of the forward primer was 5’-TGCCCTAATTTGTGGGTGAT-3’ and the sequence of the reverse primer was 5’-AAACAAGCTGCCGTCGTTAT-3’. The PCR mix contained the following components: 10×reaction buffer (Fermentas), 2.5 mM MgCl2, 0.2 mM dNTP, 0.3 µM from each primer and 0.5 U DreamTaq DNA-polymerase (Fermentas). The PCR temperature profile was as follows: initial denaturation at 95°C for 2 min followed by 35 cycles of denaturation at 95°C for 30 sec, annealing at 55°C for 30 sec and extension at 72°C for 1 min and a final extension at 72°C for 5 min. PCR was conducted using a Peltier thermal cycler PTC-200 (MJ Research, USA). The amplified fragments were run on 1% TBE gel and cut out and purified on an EZ-10 Spin Column DNA gel extraction kit (Bio Basic). The purified sequence was cloned in the pTZ57R/T vector (CloneJet PCR cloning kit, Thermo Scientific) and transformed to competent DH5α E. coli cells for propagation. The isolated plasmid DNA was sequenced at the Baygen Institute (Szeged, Hungary). The sequence was blasted in NCBI.
Quantitative Real-Time PCR
For the RT-qPCR relative evaluation, the EF1α housekeeping gene was chosen based on previous experiments. The applied EF1α forward primer’s sequence was 5’-AATTGGAAACGGATATGCTCCA-’3 and the reverse primer’s sequence was 5’-TCCTTACCTGAACGCCTGTCA-’3.
Samples were amplified in triplicates and no-template-control (NTC) and calibrator were run in the plates. Real-time PCR was performed in 2015 on a Roto-Gene 6000 (Qiagen) thermocycler, in 2016 using a 7500 fast real-time PCR system (Applied Biosystem), and in 2019 with a CFX96 Touch real-time PCR detection system (Bio Rad). The dilution series (1:8, 1:16, 1:32) of cDNAs were used to generate a standard curve. The amplification efficiency was determined based on the slope of the log-linear portion of each standard curve. For a relative gene analysis, two standard curve methods were applied. The PCR mixture in 2015 and 2016 contained 10 µL 2x SensiFast SYBR® No-ROX Mix (Biomine), 0.8 µL 10 µM reverse and forward primers, 0.4 µL 50x ROX, and 5 ng cDNA. The applied temperature profile consisted of the following steps: 95°C for 2 min and then 40 cycles of 95°C for 5 sec, 60°C for 30 sec and 72°C for 15 sec. In 2016, the relative ratios of the threshold cycle (Ct) values between the RAS gene and the endogenous control (EF1α) were calculated for each sample. The PCR mixture in 2019 contained 10 µL of SsoAdvanced Universal SYBR® Green Supermix, 0.8 µL 10 µM reverse and forward primers, 5 ng cDNA and DEPC-treated water. The applied temperature profile was as follows: 95°C for 3 min and then 40 cycles of 95°C for 40 sec and 60°C for 30 sec (two-step PCR). A melt curve analysis (65–95°C) served to verify the designed primer specificity for the EF1α and RAS genes. The RAS gene expression level was calculated by the ΔΔCt method.
Statistical Analysis
To enable a correct comparison of the gene expression and RA accumulation patterns of different years despite the considerable heterogeneity in the raw gene expression data (due to the different instruments) and RA contents and the high level of phenological inhomogeneity among the individuals, we calculated the differences in the gene expression values and those of the RA contents between consecutive sampling times for each plant. In these cases, where the increase/decrease exceeded 10%, we assigned +1/‒1, respectively, to the time interval. If the change was lower than 10%, we assigned 0 to the time interval. In this way, we could show characteristic patterns both for the gene expression and for the RA content changes from one sampling time to the other (Tables 5 and 6).
Table 5.
The gene expression pattern of the field experiment in years 2015 and 2019, (constructed the way described in chapter Statistical analysis) +1 and -1 mean 10% increase/decrease in gene expression during the indicated time interval, respectively. 0 means lower change than 10%. Color coding: read means increase (+1), green means decrease (-1) and yellow means no change (within ±10%) (0)
Table 6.
The Gene Expression Pattern Of The Climate Chamber Experiments, Constructed The Way Described In Chapter Statistical Analysis +1 And -1 Mean 10% Increase/Decrease In Gene Expression And Rosmarinic Acid During The Indicated Time. Color Coding: Read Means Increase (+1), Green Means Decrease (-1) And Yellow Means No Change (Within ±10%) (0)
| Year | From 01.04 To 29.04 | From 29.04 To 20.05 | From 20.05 To 20.06* | |||||
| Ras Gene Expression |
Ra Content | Ras Gene Expression |
Ra Content | Ras Gene Expression |
Ra Content | |||
| 2016 | Cold | Control | ‒1 | ‒1 | 1 | 1 | ‒1 | ‒1 |
| ‒1 | 1 | 1 | ||||||
| ‒1 | 1 | ‒1 | ||||||
| Treatment | 1 | 0 | ‒1 | 0 | ‒1 | 0 | ||
| 1 | ‒1 | 1 | ||||||
| 1 | ‒1 | 1 | ||||||
| Warm | Control | ‒1 | ‒1 | 1 | 1 | ‒1 | 0 | |
| ‒1 | 1 | ‒1 | ||||||
| ‒1 | 1 | ‒1 | ||||||
| Treatment | 1 | 1 | ‒1 | ‒1 | 1 | ‒1 | ||
| ‒1 | ‒1 | 1 | ||||||
| 1 | ‒1 | 1 | ||||||
| Year | From 10.04 To 02.05 | From 02.05 To 30.05 | From 30.05 To 27.06* | |||||
| Ras Gene Expression |
Ra Content | Ras Gene Expression |
Ra Content | Ras Gene Expression |
Ra Content | |||
| 2019 | Cold | Control | 0 | 0 | ‒1 | 1 | 1 | 0 |
| 1 | 0 | ‒1 | 1 | ‒1 | ‒1 | |||
| 1 | ‒1 | 1 | 0 | ‒1 | 1 | |||
| Treatment | 1 | 1 | ‒1 | 0 | 1 | 0 | ||
| 1 | 1 | ‒1 | 0 | 1 | 0 | |||
| ‒1 | 0 | ‒1 | 1 | ‒1 | ‒1 | |||
| Warm | Control | 1 | ‒1 | ‒1 | 1 | 1 | ‒1 | |
| 1 | 0 | ‒1 | 1 | ‒1 | 0 | |||
| 1 | 0 | ‒1 | 1 | 0 | 0 | |||
| Treatment | 1 | 1 | ‒1 | 1 | 1 | ‒1 | ||
| 1 | 1 | ‒1 | 1 | ‒1 | ‒1 | |||
| 1 | 1 | ‒1 | 1 | 1 | ‒1 | |||
Results
RAS Gene Identification
Using primers designed based on the Melissa officinalis RAS sequence, a 153 bp long fragment was amplified via PCR and was cloned, sequenced and deposited in the NCBI GenBank under accession number ON808438. It showed 90.85% similarity to the Melissa officinalis RAS sequence (FR670523) in the NCBI Blast service. The alignment of two sequences is shown in Fig. 2. This fragment was used in the gene expression analysis.

Changes of RAS Expression during Ontogenesis
The expression of the RAS gene during five phenological phases (vegetative, budding, beginning of flowering, full flowering and fruit bearing) was studied in 2015 and 2019. The results were similar in both years, the studied plants showed comparable profiles. The expression decreased continuously until the last sampling time, which was at the fruit-bearing phase. In the fruit-bearing phase, the expression of the RAS gene increased in both years, although to a different extent (Fig. 3).

Changes of RAS Expression Levels and RA Contents due to Environmental Factors
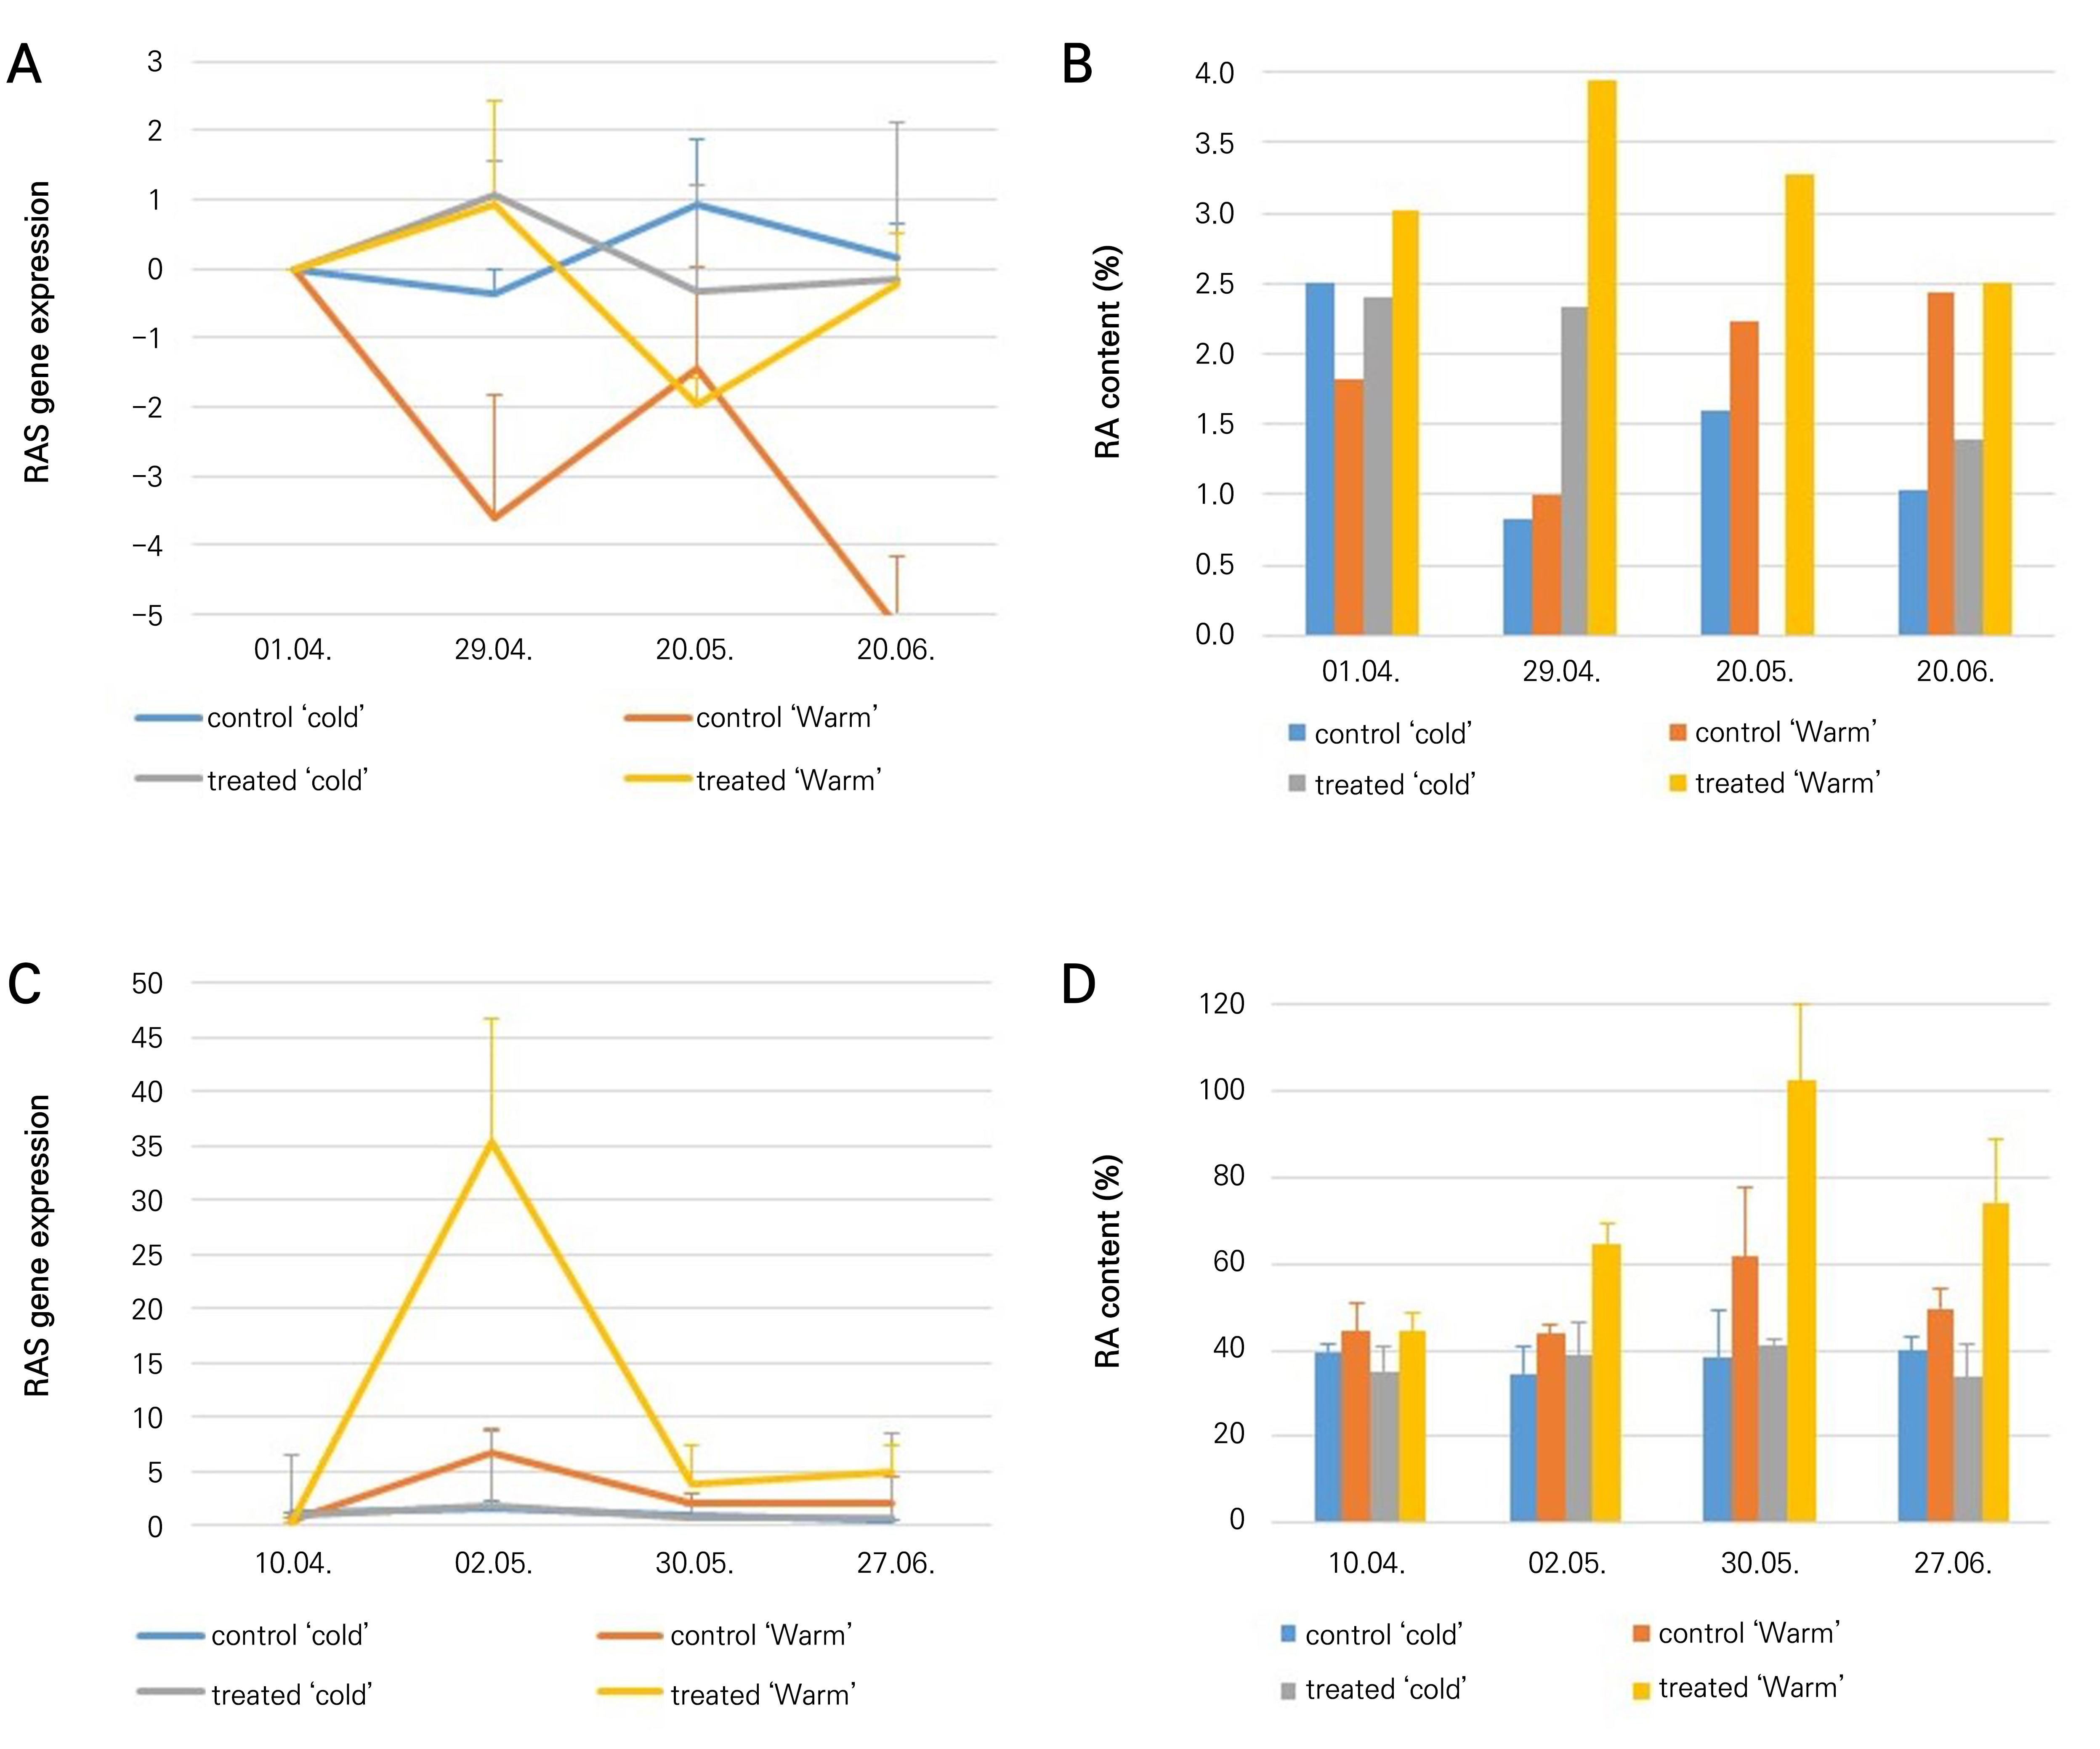
In 2016, most of the time, the gene expression level changed in parallel with the RA content, except at the last sampling time in a warm chamber, where gene expression of the treated plants increased, but no increase in the RA content was observed. The highest RA level (3.9%) was detected in the treated group at the second sampling time in the ‘warm’ chamber. In this chamber, the lowest RA content (0.9%) was measured at the second sampling time in the controls. The gene expression curves of the control and the treated plants changed in a contrary manner; i.e., when the gene expression in the control increased, the gene expression in the treated plants decreased, and vice versa. In the ‘cold’ chamber, the RA content did not increase and instead decreased from 2.4% to 1% during the study for the controls and from 2.3% to 1.3% for the treated plants. The RAS gene expression level was similar to that in the ‘warm’ chamber. The highest RA content was measured at 40% SWC and the control samples (70% SWC) did not show any increase in RA accumulation (Fig. 4). In 2019, the highest RAS gene expression level was measured at the second sampling time in both climatic chambers, but in the warm chamber, this was an outstanding gene expression increase that was followed by a RA content increase at the next sampling time. After this elevation, both the RA content and the RAS gene expression level dropped. The highest RA content was measured in the treated group at the third sampling time (12.7%) in the warm chamber, while the lowest RA content (3.5%) was found in the control plants at the first sampling time. In the ‘cold’ chamber, the RA content did not increase, and the highest RA content value (4.6%) was measured at the first sampling time.
Discussion
Studying the RAS gene expression during the course of vegetation, we found it to decrease continuously until the fruit set, at which time RAS gene expression increased in both years. The summer of 2016 was hotter and drier (sum of heat: 842.6°C; sum of precipitation: 142 mm) than 2019 (sum of heat: 682.95°C; sum of precipitation: 236.8 mm). Based on our study, these parameters may have influenced the RAS gene expression levels and RA contents of garden thyme. We detected greater RAS gene expression increases upon fruit set in the hotter and drier year. According to our results, the temperature and the precipitation did not affect the genetically encoded pattern of RA production during the vegetation period, but it may have influenced the extent of the gene expression change. Several studies have demonstrated that particular enzymes or groups of enzymes responsible for the formation of special secondary compounds are synthesized or activated at a particular stage of plant development. In the related species marjoram, Sellami et al., (2009) detected decreasing concentrations of phenolic acids from the late vegetative stage and assumed that they play a significant role in the protection of plants at the beginning of their development. Similarly to our results, Hassanzadeh et al. (2017) found that the RA content in Rosmarinus officinalis L. leaves during the vegetation period remained low in the course of the vegetation period, increasing only upon fruit set. Based on several studies, the maximal RA content of various plants occurs from August to October. Stafiniak et al. (2021) studied the expression of RAS gene in the leaves of Salvia abrotanoides and S. yangii during the vegetation period with two different primer pairs based on two Salvia RAS sequences in Poland. The plants were sampled in mid-May at the start of the season, in mid-August at flowering time, and in mid-October at the end of the season. With the first primer pair, a decreasing RAS gene expression level was detected during the vegetation period. However, with the other primer pair, the highest RAS gene expression was measured in mid-August. Also, for Perilla frutescens Britton, the highest RA content was measured in August (Natsume et al., 2006). Galasso et al. (2014) studied the polyphenol content of Thymus longicaulis at different phases of the life cycle in Italy. The highest rosmarinic acid content was measured in September, and at that time this was the main metabolite. Luis and Jonson (2005) studied the seasonal variations of eight compounds in Rosmarinus officinalis and the highest rosmarinic acid level was found in September. In contrast, Kiferle et al. (2011) found that in a hydroponic basil culture, the RA content was higher in plants at flowering than during the vegetative phase. The RA content of Zostera species was measured in Denmark (Ravn et al., 1994) and in France (Achamlale et al., 2009). In Denmark, two peaks were found in the RA content, one in August and the other in December, while in France, the highest RA content was detected during the spring.
Phenolics may accumulate to prepare the plant for the lignification process. Environmental stressors may also enhance the accumulation of phenolics as protective agents (Treutter, 2010) among those other than RA. Thyme and related Lamiaceae species react due to a significant elevation of the RA content stemming from a lack of water (Manukyan, 2011; Németh-Zámbori et al., 2017). The effects of a water shortage on RAS gene expression and RA content outcomes in intact Thymus vulgaris plants have not yet been studied. In our study, plants with low soil water contents showed increased RAS gene expression levels and RA contents in the two years studied compared to control plants. In the ‘warm’ chamber in 2016, the highest RA content for the control plants was 2.4%, while the RA content of the treated plants was 3.9%. In the second year (2019), the highest RA content of the control plants was 6.9%, while that of the treated plants was 11.4%. In 2016, the RAS gene expression level and RA content of control plants decreased, but in 2019 both increased similarly to the treated plants, though only moderately. In 2019, the plants were fully developed, large individuals, implying that 70% SWC may have also indicated a shortage of water. Several studies of various species support our result. Drought stress affected Moldavian dragonhead (Dracocephalum moldavica) metabolites, with high rosmarinic, chlorogenic and p-coumaric acid contents measured under moderate drought stress (Kamalizadeh et al., 2019). The RA contents of Mentha piperita L. and Prunella vulgaris L. plants also increased due to mild drought stress (Mirzamohammadi et al., 2021; Chen et al., 2011). However, in Salvia miltiorrhiza plants, the RA content decreased in drought stress, but at the same time the salvianolic acid content increased, an outcome deriving from the same precursor (hydroxyphenyllactic acid) as RA (Liu et al., 2011). The RA content of Melissa officinalis L. plants was also found to increase due to both mild and severe drought stress (Manukyan, 2011; Németh et al., 2017), while the RA content of Nepeta cataria f. citriodora and Salvia officinalis L. decreased due to a reduced water supply (Manukyan, 2011). Thymus vulgaris is a xerophile plant, meaning that it adapts excellently to dry conditions (Hornok, 1992). Based on the present study, warmer and drier conditions affect the RA content and RAS gene expression levels of garden thyme in a positive way. Khazaie et al. (2008) examined the effect of the irrigation frequency on the herbal biomass in garden thyme and found that the irrigation frequency does not influence the total biomass. This suggests that irrigation is not a prerequisite for thyme, either for biomass production or for RA production. This finding has implications for the profitability of garden thyme cultivation for RA production.
An effect of the temperature on the RA content could not be demonstrated. In 2016, the highest RA content of the control plants at both temperature settings was 2.4%, while in 2019, at the higher temperature the highest RA content was 6.9%, while in the colder chamber it was 4.4%. Regarding other environmental factors, the water supply did not affect either the RA content or the RAS gene expression level in the ‘cold’ chamber. The effect of a water shortage on the elevation of the RA content is more pronounced in warmer conditions. Previous studies demonstrated variable results regarding this topic (Németh-Zámbori et al., 2017). A short-term heat treatment (38°C for 5 h) elevated the RA content of Melissa officinalis L. (Pistelli et al., 2019). Khaleghnezhad et al. (2019) studied the RA content of Dracocephalum moldavica L. at 35°C during the flowering phase; despite the fact that the RA content increased at 35°C, the change was not significant and a further ABA treatment was needed to realize a significant increase in the RA content. The RA content of Mentha spicata L. plants decreased due to a long-term heat treatment (30°C for four weeks). Fletcher et al. (2005) suggested that heat stress negatively regulates RA biosynthesis. Dörr et al. (2019) studied Plectranthus scutellarioides L. RA content changes with different illumination systems. The use of heat-emitting lamps led to a lower total RA content, with the leaf temperature also found to be the main factor affecting secondary metabolite production. Gholamnia et al. (2022) studied the combined effect of heat and salinity on Mentha piperita L., finding that a high temperature combined with salinity decreased both the RAS gene expression level and the RA content. The effect of temperature on RAS gene expression has not been studied thus far.
We found a connection between the dynamics of the RA content and the RAS gene expression level in thyme shoots. A single contradictious result was achieved in 2016 in the warm chamber at the last sampling time, where the RAS gene expression increased but the RA content decreased. A firm connection between the dynamics of the RAS gene expression and the RA content was found in 2019, when the RA content followed the RAS gene expression with a 28-day delay. In 2016, this delay was not obvious, but the connection was stronger when the RA content and RAS gene expression level were compared at the same harvest time. The only difference between the two years that may have caused the delay was the age of the plants. In 2016, young, eight-month-old plants were used, while in 2019, perennial plants were used for the experiment. The older plants produced 1.6–4.9-fold more RA compared to the eight-month-old plants. In this case, we would assume that the older plants reacted more slowly but more intensely to the water shortage. RAS is the key enzyme of the RA biosynthesis, catalyzing one of the last steps of the pathway (Petersen and Simmonds, 2003). The correlation between the RA content and RAS gene expression may confirm the central role of RAS in the biosynthesis step. This correlation was demonstrated previously in Melissa officinalis L. cell cultures (Weitzel and Petersen, 2011). Stafiniak et al. (2021) also discovered a high correlation in the roots of Salvia abrotanoides and S. yangii, suggesting transcriptional RA biosynthesis regulation in which a high gene transcript level results in a high accumulation rate of RA. For leaves, they found variable results, concluding that the mechanism may be more complex and may include the presence of different RAS isoforms or transcription-independent mechanisms. Several factors, such as the long-distance transport processes of secondary metabolites, the putative isomorphs properties, and the rate of the accumulation and degradation of RA and its precursors may allow us fully to understand the mechanism of RA accumulation. This mechanism may also show some differences in certain target species.
In our study, we demonstrated that the connection between the expression of the RAS gene and the RA content in thyme showed differences depending on the year and on other circumstances in this study, particularly the temperature or plant age. Therefore, a very clear and straight connection could not be proved, suggesting that the above considerations of additional mechanisms in this pathway may be significant and are thus worthy of examination in the future.
