

서 언
원예작물의 시설 재배에서 생육과 수량 및 품질에 주요한 영향을 주는 요인 중 하나는 이산화탄소(CO2) 농도이다(Bowes 1993). 시설재배에서 CO2 시비는 생산비를 증가시켜 재배자의 경제적 부담이 될 수 있어 합리적 관리가 필요하다(Ayari et al. 2000). 현재 대부분의 CO2 시비에 관한 연구는 주로 수량과 품질 및 영양생장과 생식생장 반응(Ryu et al. 2018) 등에 관한 것이고, 일부분이 CO2 시비의 효율과 환경과의 관계성에 관한 것이다(Jung et al. 2022). Namizaki et al.(2022)는 CO2 농도와 주야간 온도를 각각 2개 수준으로 처리하였을 때, CO2 고농도 (elevated CO2 (eCO2): 800–1000ppm)에서 탄소 동화작용 및 동화산물의 축적과 과실의 건물중 비율이 높아졌으며, 낮은 야간온도(LT; 35/10 ± 2°C, day/night)에서 높은 야간온도(HT; 25/20 ± 2°C, day/night)보다 잎의 호흡억제로 광합성 산물의 전류가 증가되었다고 하여 시설 내 야간 온도 환경과 야간 호흡량과의 관계성을 보여주었다.
Behboudian and Lai(1994)는 낮 시간대에 CO2 농도를 340과 700µl·liter-1로 처리하였을 때 야간 호흡율은 각각 2.7 ± 0.2와 4.1 ± 0.7µmol·m-2·s-1로 700µl·liter-1 처리에서 높았고 주/야 온도가 25/16°C인 조건에서 22/16°C보다 야간 호흡율이 높았다고 하였다. Frantz et al.(2004)는 야간 온도가 1°C 올라갈수록 토마토의 야간 호흡은 2.7% 증가한다고 보고하였으며 Tartachnyk and Blanke(2007)도 토마토의 야간 호흡은 온도가 낮은 1월에 약 2µmol CO2·m-2·s-1이었고 온도가 상승한 2월에 3µmol CO2·m-2·s-1이었다고 하였다. Hückstädt et al.(2013)는 챔버 실험에서 야간 온도를 18°C로 유지하였을 때 13°C와 10°C 처리에 비해 토마토(엽수 21–22장)의 호흡이 높았다고 하였다. 본 연구팀의 선행연구에서도 야간 호흡 작용으로 증가되는 CO2 농도는 HT 온도의 경우 오후 6시(346ppm) 부터 서서히 증가되어 오전 3시(454ppm)에 가장 높았으며 9시간 동안 약 100ppm이 증가되어 시간당 약 11ppm이 증가되었고(토마토 240개체, 엽면적 330m2), LT 온도에서는 그 증가폭이 낮았다. 봄철 CO2 시비 온실에서 CO2 시비 개시 직전(오전 7:30)에 측정된 CO2 농도는 야간온도가 15°C 이상의 경우(HT)는 15°C 이하의 경우(LT)보다 3–4배 높은 결과를 얻었으며 그날의 계산된 공급 CO2 시비량도 HT 온도에서 낮았다(Choi et al. 2023a). 따라서, 토마토의 야간 호흡 작용으로 증가되는 CO2 농도는 시설 내 온도의 영향을 받으며, 야간에 증가된 CO2는 낮 시간대 CO2 시비량에 영향을 준다는 것을 알 수 있었다.
본 연구는 선행연구에서 구축한 이산화탄소(CO2) 공급량 예측 모델식을 기반으로(Choi et al. 2023b) 야간 호흡을 고려한 CO2 공급량을 예측하기 위하여 실험 1에서는 봄 재배기간 동안 상업적 토마토 수경재배 온실에서, 실험 2는 가을 재배 기간 동안 실험 온실에서 실험을 수행하였고, 추가적으로 야간 시간대 식물 호흡 작용으로 인한 CO2 증가량 예측값과 실측값을 비교하였다.
재료 및 방법
식물재배 및 재배환경
실험 1. 상업용 토마토 재배 온실의 야간 호흡량을 고려한 CO2 시비량 예측
실험 1은 강원도 춘천시 사농동(37.914692°N, 127.727889°E)에 위치한 상업용 토마토 재배 온실(폴리에틸렌(polyethylene) 피복 연동형, 면적: 540m2, 규격: 6m(W) × 90m(L) × 3.0m(H))에서 2023년 2월 24일부터 2023년 5월 30일까지 실시하였다(Fig. 1B to 1E). 토마토(S. lycopersicum L. ‘Nonari’(Daenong seed Co. Ltd., Goyang-si, Korea.)) 모종 2,100주를 코코피트 배지(100cm × 20cm × 10cm, chip:dust 5:5(v:v), Jiffy Group, Zwijndrecht, Netherland) 2 거터에 6주씩 정식하였다. 급액은 네덜란드 PBG 토마토 배양액 [A tank (5{Ca(NO3)2 2H2O NH4NO3} 89.4kg, KNO3 23.3kg, NH4NO3 1.3kg, HNO3 0.15kg, DTPA-6% 3.3L)과 B tank (KH2PO4 20.3kg, KNO3 47.4kg, MgSO4 7H2O 45.1kg, Mg(NO3)2 6H2O 1.1kg, HNO3 0.3kg, H3BO3 300g, MnSO4 H2O 200g, ZnSO4 141g, CuSO4 5H2O 20g, Na2MoO4 2H2O 12g)]으로 pH는 6.0, EC는 1.8–2.4dS·m-1 수준으로 100ml씩 2회 공급하였다. 온풍기(FHS-001H018, Fine Energy Co. Ltd., Geumsan-gun, Chuncheongnam-do, Korea)를 이용하여 최저온도가 14°C가 되도록 설정하였다. 탄산시비는 LPG 연소형 이산화탄소 발생기(KCH-21SV, KATSURA, Long An, Vietnam)를 이용하여 2023년 3월 19일부터 2023년 5월 13일까지 CO2 농도를 600µmol· mol-1 목표로 설정하여 오전 7시30분부터 11시까지 작동하였다.
실험기간 중 온실 내부의 최고와 최저 온도는 3월에는 각각 33.1, 14.1°C, 4월에는 32.4, 13.1°C, 5월에는 32.1, 9.39°C였고, 외부 온도는 3월에 25.2, –2.5°C, 4월에는 28.0, –1.8°C, 5월에는 26.5, 3.35°C 이었다. 온실 내부의 최고와 최저 습도는 3월에는 각각 93.6, 17.3%, 4월에는 96.8, 18.1%, 5월에는 94.7, 30.3%였고, 외부 습도는 3월에 88.8, 12.6%, 4월에는 100, 14.8%, 5월에는 100, 19.9%였다. 온실 내부 광도는 3월 평균과 최고는 각각 135, 603W·m-2, 4월은 92, 679W·m-2, 5월은 128, 747W·m-2 수준이였다(Table 1).
Table 1.
Monthly maximum, minimum and average air temperatures along with relative humidity levels both inside and outside of the greenhouse as well as the humidity deficit, solar irradiance and carbon dioxide (CO2) concentration in the greenhouse in March to May of 2023 in experiment 1
실험 2. 실험 온실에서 야간 호흡량을 고려한 CO2 시비량 예측
본 실험은 서울시 종로구 한국방송통신대학교(37.578234°N, 127.002715°E)에 위치한 폴리에틸렌(Polyethylene) 단동형 온실 (면적: 16m2, 규격: 4m(W) × 4m(L) × 3.25m(H))에서 2023년 9월 1일부터 2023년 10월 30일까지 실시하였다(Fig. 1A). 정식은 여주육묘장에서 60일 재배된 토마토(Solanum lycopersicum L. ‘Bonitto’(scion) (Enza Zaden, Enkhuizen, Netherland), ‘B-blocking’(rootstock) (Takii Seed Co., Kyoto, Japan)) 코코피트 배지(100cm × 20cm × 10cm, chip:dust 5:5, Biogrow Lanka Ltd., Nogombo, Sri Lanka)에 3주씩 심어 총 24주를 정식하였다. 코코피트 배지의 포수는 정식 전날 수돗물로 배지 EC가 0.5dS·m-1 이하가 되도록 충분히 하였고 배지 하단에 배수구는 3cm 크기로 4개가 되도록 하였다. 토마토의 측지는 지속적으로 제거하여 1줄기로 재배하였고 착과 촉진을 위하여 오전 10시 이전에 유인줄을 흔들어 주었으며 정식 후 46일(10월 17일)에 7화방 위에서 순지르기를 하였다. 급액은 Yamazaki 토마토 배양액{KNO3 40.4kg, Ca(NO3)2· 4H2O 35.4kg, Fe-EDTA 1.53kg, KNO3 20.2kg, NH4H2PO4 7.6kg, MgSO4·7H2O 24.6kg, H3BO3 114g, [MnSO4·4H2O] 81g, [ZnSO4·7H2O] 9g, [CuSO4·5H2O] 4g, [Na2MoO4·2H2O] 1g(1000L 100배)}의 pH와 EC 수준을 각각 5.8–6.0, 1.8–2.4dS·m-1로 생육 시기별로 조정하여 공급하였다. 1회 급액량은 120mL가 되도록 타이머 방식으로 공급하였으며 오후 3시 전에 급액이 종료되도록 설정하였다. 탄산시비는 2023년 9월 23일부터 10월 29일까지 액화탄산발생기(CO2 generator, Daehan specific gas Ltd., Kimpo, Gyeonggi-do)를 이용하여 목표 CO2 농도를 600µmol·mol-1으로 설정하여 오전 9시부터 11시까지 수행하였다. CO2 센서(SH-VT260, SOHA-TECH Ltd., Seoul, Korea)와 광센서(ioCropsClima, ioCrops Inc., Seoul, Korea)의 데이터는 센서 노드박스(nodebox, ioCrops Inc., Seoul, Korea)로 수집하였고, 외부 기상환경(온도, 습도)은 외부기상센서(ATMOS14, METER Group Inc., WA, USA)와 노드박스(ZL6, METER Group Inc., WA, USA), 엽온은 엽온센서(LT-1M, Bioinstruments S.R.L., Chişinău, Moldiva)와 노드박스(CR300, Campbell Scientific, Inc., Logan, UT, USA)로 측정하였다.
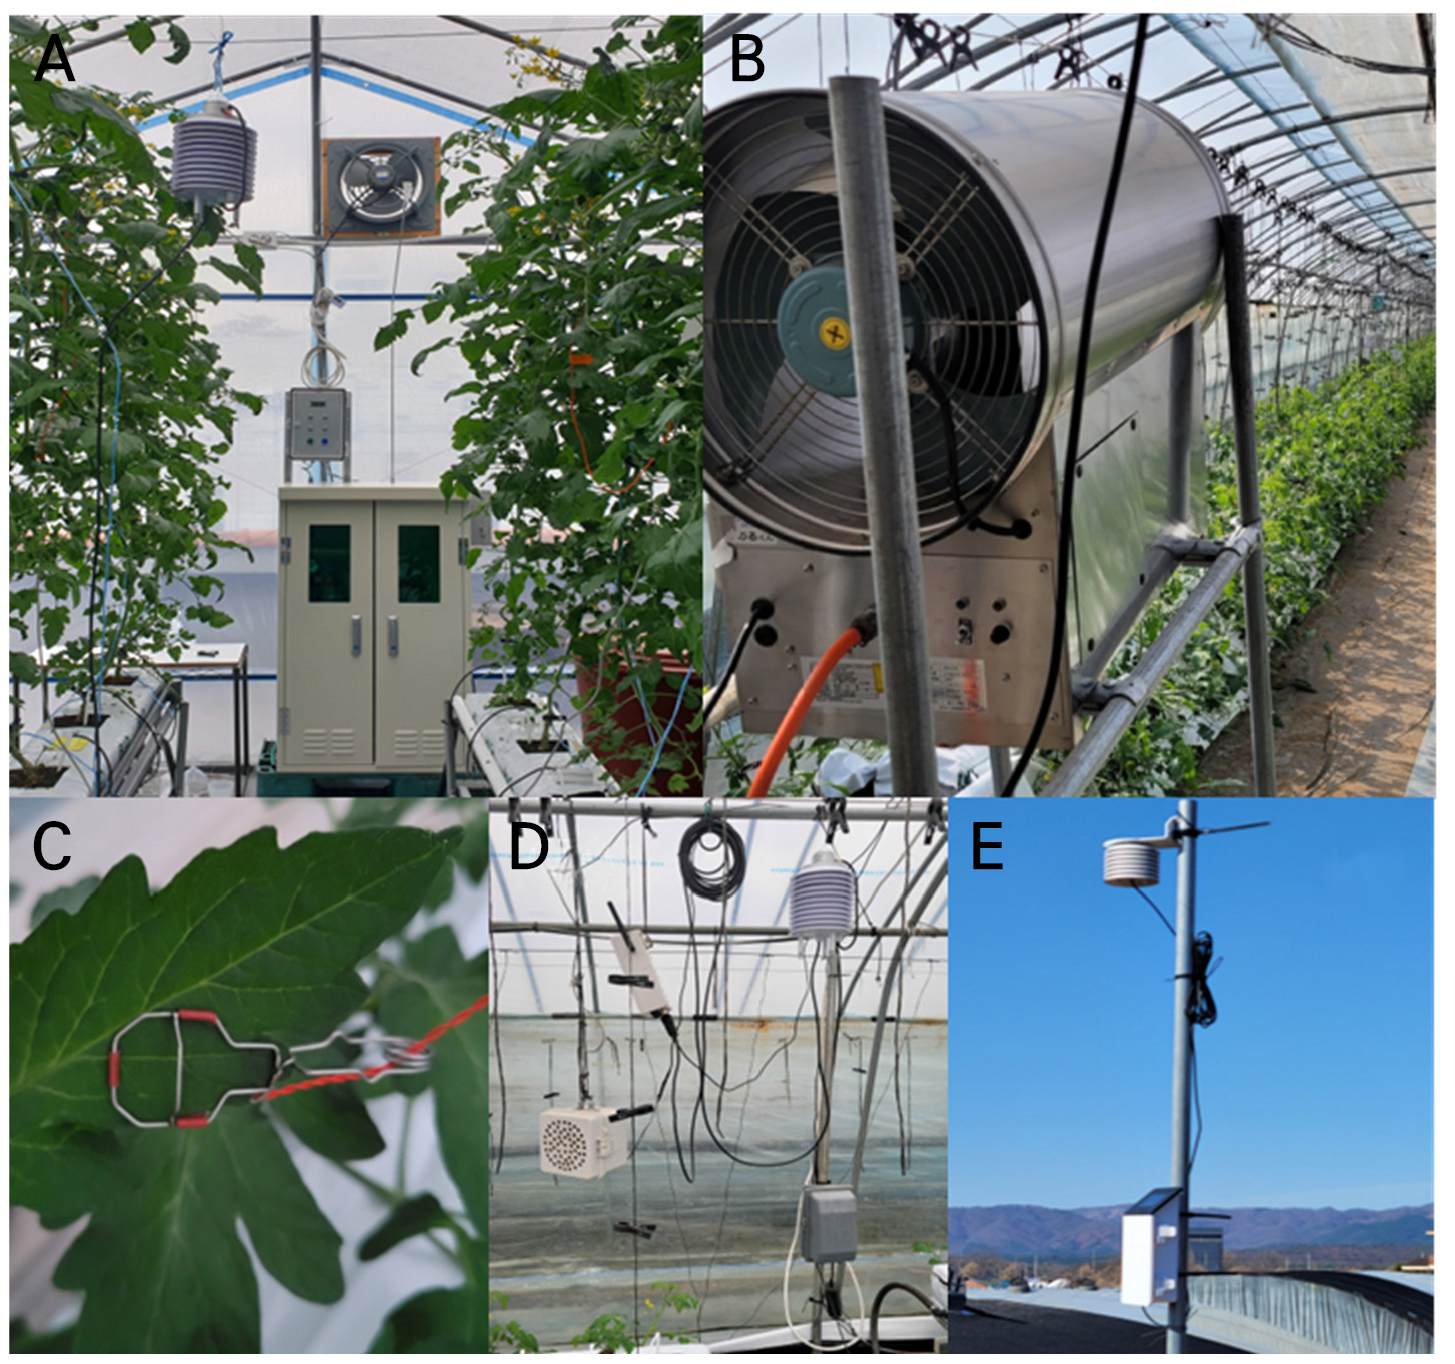
Fig. 1.
Representative experimental images of tomato plants grown with CO2 supplementation in the commercial tomato hydroponic greenhouse (Expt. 1) using CO2 fertilizer with LPG (B). Leaf temperature sensor (C), solar sensor and node box (D), and temperature/humidity sensor and node box outside the greenhouse (E) installed in the commercial greenhouse. In the experimental greenhouse (Expt. 2), CO2 supplementation was conducted using a CO2 generator with liquefied petroleum gas (A).
실험기간 중 온실 내부의 최고와 최저 온도는 9월에는 각각 38.4, 16.1°C, 10월에는 30.4, 11.6°C였고, 외부 온도는 9월에 15.6, 33.0°C, 10월에는 6.3, 25.6°C였다. 온실 내부의 최고와 최저 상대습도는 9월에는 각각 95.5, 24.0%, 10월에는 24.1, 89.3%였고, 외부 습도는 9월에 97.2, 30.6%, 10월에는 93.7, 24.8%였다. 온실 내부 광도는 9월 평균과 최고가 각각 60.4, 503W·m-2, 10월은 54.4, 399W·m-2 수준이였다(Table 2).
Table 2.
Monthly maximum, minimum and average air temperatures along with relative humidity levels both inside and outside of the greenhouse as well as the humidity deficit, solar irradiance and carbon dioxide (CO2) concentration in the greenhouse in September and October of 2023 in experiment 2
측정항목 및 측정 방법
실험 1의 생육조사는 완전임의배치법으로 재배된 식물 18개체를 대상으로 18반복으로 정식 19일(3월 15일)부터 7일 간격으로 5월 26일까지 수행하였다. 실험 2의 생육조사는 완전임의배치법으로 재배된 식물 24개체 중 3개체를 선정하여 3반복으로 정식 후 41일 이후(10월 12일)부터 5–7일 간격으로 하였고, 정식 후 59일(10월 30일)에는 15개체를 15반복으로 조사하였다. 초장은 지제부에서 생장점까지 길이, 엽수는 지제부부터 생장점 아래 완전히 전개한 잎의 수를 측정하였다. 엽장과 엽폭은 생장점 아래 완전히 전개한 엽에서 5번째에 해당하는 잎의 길이와 폭을 측정하였고 그 잎의 엽록소 함량을 SPAD로 측정하였다. 줄기 굵기(경경)는 생장점으로부터 개화 위치 사이의 줄기 굵기와 지제부 줄기 굵기를 측정하였고, 화방높이는 생장점 아래에서 개화 위치까지 길이를 측정하였다. 엽면적은 엽병을 포함한 모든 잎을 절단하여 엽면적 측정기(LI-3100, LI-COR Inc., Nebraska, USA)를 이용하여 측정하였다. 야간 시간 식물 호흡률은 2023년 10월 16일 18시부터 10월 17일 6시까지 광합성 측정기(LI-6400XT, Li-Cor, Inc., Lincoln, NE, USA)로 충분히 전개된 5번째 잎으로 측정하였다.
데이터 수집 및 분석
시설 내부 기상 환경(온도, 습도, 내부 일사량)은 광센서(ioCropsClima, ioCrops Inc., Seoul, Korea)와 센서 노드박스(nodebox, ioCrops Inc., Seoul, Korea), 외부 기상환경(온도, 습도)은 외부기상센서(ATMOS14, METER Group Inc., WA, USA)와 노드박스(ZL6, METER Group Inc., WA, USA), 엽온은 센서(LT-1M, Bioinstruments S.R.L., Chişinău, Moldiva), CO2는 센서(SH-VT260, SOHA-TECH Ltd., Seoul, Korea)와 노드박스(nodebox, ioCrops Inc., Seoul, Korea)로 측정하였다.
야간 호흡을 고려한 CO2 공급량 모델식
본 연구에서 개발된 모델식인 Eq. (1)에서 는 첫 CO2 공급 전 온실 내 CO2 농도(g·m-3)를 예측한 값(Predicted value, PV)으로 전날 일몰 시점(광량 50W 이하)의 예측 CO2 농도()에 야간시간 동안(t0-t1) 호흡량(Rd(g))을 더한 값(누적 호흡량)이다. Rd은 암호흡(µmol CO2·m-2·s-1)이고 Rd(g)은 g으로 환산한 호흡률(g CO2·m-2·h-1)이다. h는 온실 평균 높이(실험 1은 3m, 실험 2는 3.25m), ρ는 CO2 밀도다(1.83kg·m-3 at 20°C and 101.3kPa)). Eq. (2)와 Eq. (3)은 본 연구팀의 선행 연구 논문에서 제시 된 모델식과 동일하다(Choi et al. 2023a, 2023b). Q는 첫 CO2 공급량(Q) (g·m-2·h-1)이며 V는 환기율(Ventilation rate), Cg은 CO2 시용목표농도(g·m-3)이다. P𝑛은 CO2 순동화율(An, µmol CO2·m-2·s-1) (Collatz et al. 1991)을 g으로 환산한 CO2 순동화율(g CO2·m-2·h-1)이다. Eq. (3)에서 다음 CO2 공급량(Next Q) (g·m-2·h-1)은 Eq. (2)와 동일하되 Ci 대신 예측된 현재 CO2 농도(Ct)를 대입하여 계산한다.
결과 및 고찰
실험 1. 상업용 토마토 재배 온실의 야간 호흡량을 고려한 CO2 시비량 예측
Table 3에서 하루의 첫 CO2 공급 시작 시점의 CO2 농도 예측값(PV )은 전날 일몰 시점의 CO2 농도()에 누적 야간 호흡량을 합하여 계산하였다. 전날 일몰시점(3월 24일(최고 온도 23°C, 야간 온도 17–18°C) 18시)의 CO2 농도()는 466µmol·mol-1이었고, 야간 시간대(19:00–7:00) 누적 호흡량(Eq. 1)은 133µmol·mol-1수준이었으므로 3월 25일 하루의 첫 CO2 공급 시작 시점(7:00)의 PV 농도는 681µmol·mol-1로 예측되었다. Table 3에서 PV CO2 (A)는 PV 농도를 포함한 하루 예측된 CO2 농도이며 445–681µmol·mol-1 범위였고, 센서 실측 값(MV, measured value)은 400–737µmol·mol-1범위였다(Table 3). 이와 같이 Table 4에서도 3월 25일 일몰 시점(18:00)의 는 465µmol·mol-1이고, 야간 시간동안(19:00–7:00) 누적된 호흡량은 140µmol·mol-1수준이었으므로 다음날 3월 26일의 PV 는 694µmol·mol-1였고 PV 농도를 포함한 PV CO2 (A)는 438–694µmol·mol-1 범위였으며 MV CO2 값은 404–643µmol·mol-1범위였다(Table 4). 따라서, 온실 야간 기온이 16–19°C 범위였던 3월 24–26일의 3일간 PV 는 681–694µmol·mol-1 범위로 예측되었는데 이는 일몰 시점의 농도(465–466µmol·mol-1)와 야간 시간대(19:00–7:00) 누적 호흡량(133–140µmol·mol-1)을 합한 결과이다.
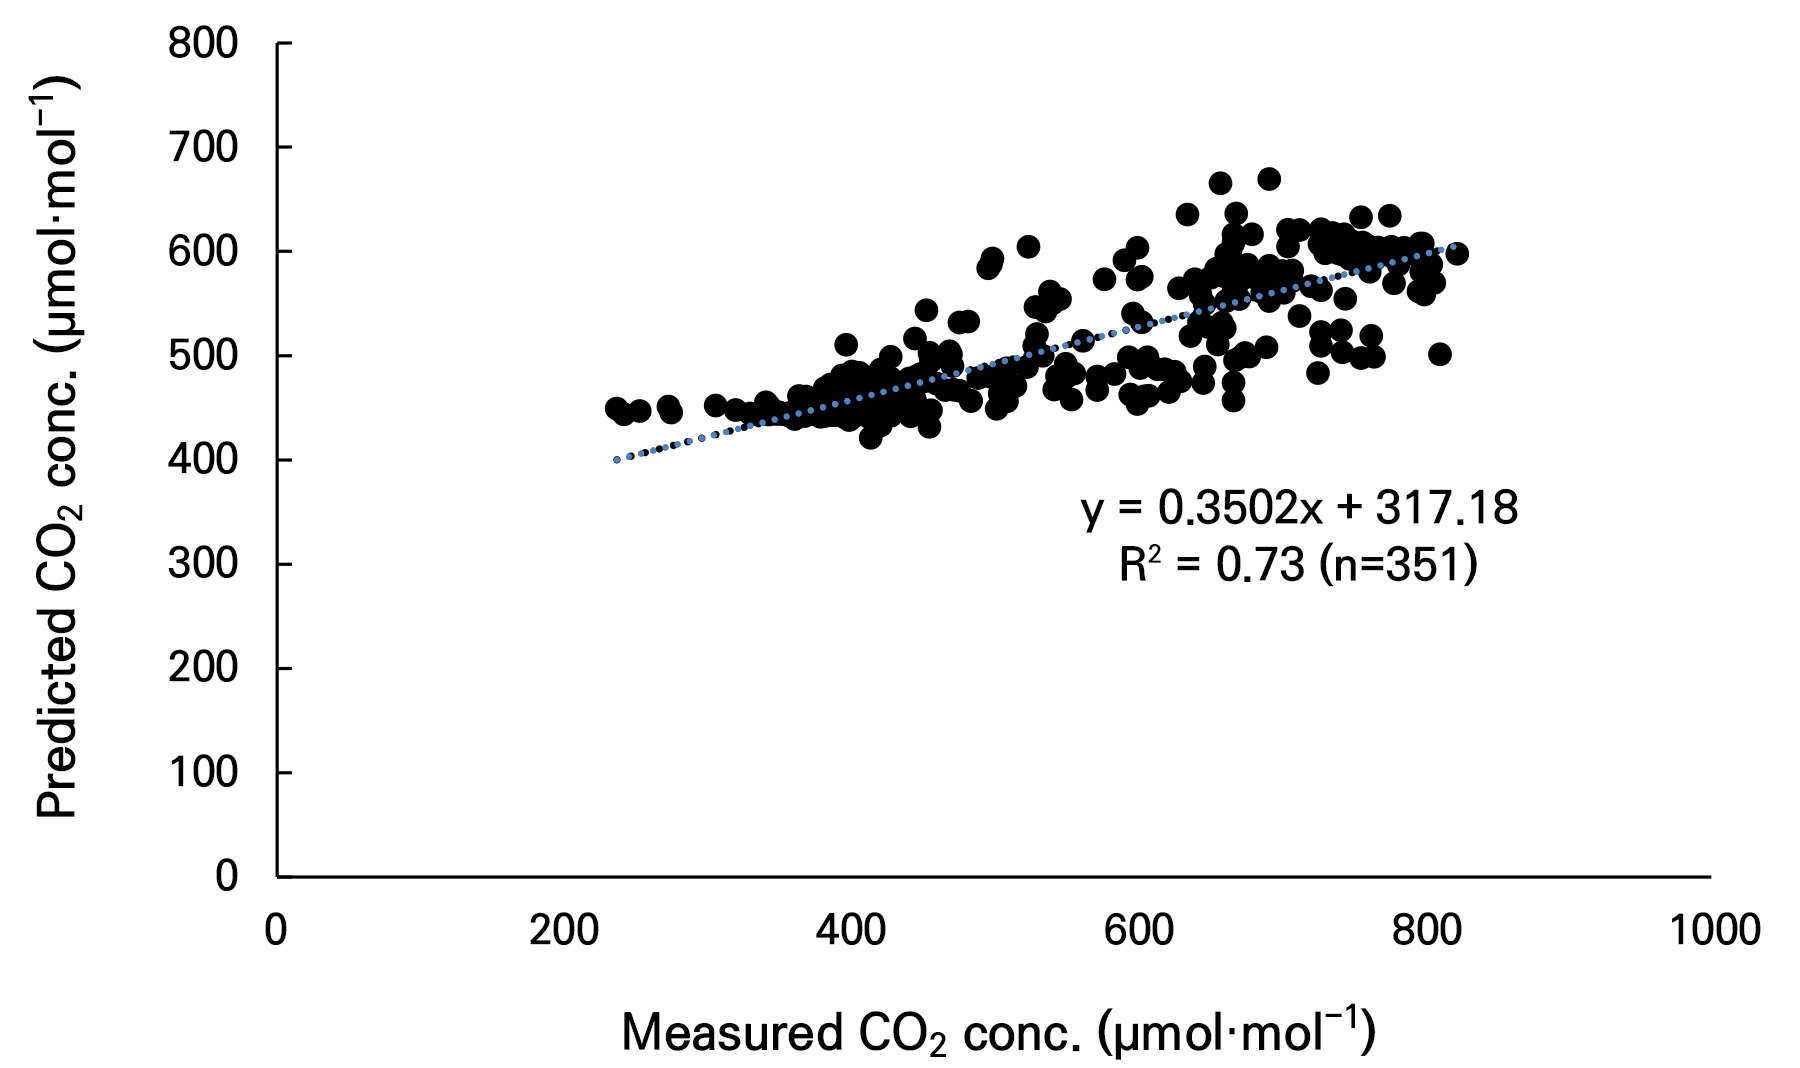
Table 3에서 3월 24–25일에 초장이 100cm이고 엽수가 14장인 상태에서(data not shown) 예측된 순광합성율(PV of net assimilates, B)은 5.4–10.6g CO2·m-2·h-1, 환기에 의한 CO2 손실량(PV of ventilated CO2 loss, C)은 0.5–32.2g CO2·m-2·h-1, CO2 시비량 (PV of supplemental CO2, D)은 4.4–33.0g CO2·m-2·h-1로 예측되었으며, Table 4에서도 3월 26일 순광합성율(B)은 5.3–9.2g CO2·m-2·h-1, 환기에 의한 CO2 손실량(C)은 1.2–55.4g CO2·m-2·h-1, CO2 시비량(D)은 3.2–36.9g CO2·m-2·h-1로 예측되었다. 선행 연구에서 광량이 800W·m-2 조건에서 작물이 흡수하는 CO2는 5.0–8.0g·m-2·h-1 정도라고 하였는데(Esmeijer 1999) 본 실험에서 예측된 순광합성율과 유사하다. Esmeijer(1999)는 온실에서 채소류 재배시 40–80m3·ha-1·h-1를 적정한 CO2 시비량이라고 하였는데 이것을 환산하면(1.0kg CO2 = 0.56m3) 7.14–14.3g·m-2·h-1로 본 연구에서 예측된 CO2 시비량인 3.2–36.9g·m-2·h-1와 비교하였을 때 낮은 수준이다. 이는 본 연구 장소인 상업적 재배 온실의 높이(동고)가 3m인 것과 관련하여 환기에 의한 CO2 손실이 높았던 것과 관련이 있는 것으로 보인다. Tartachnyk and Blanke (2007)는 2월의 맑은 날 야간 온도가 16–17°C, 낮 최고 온도가 31°C인 조건에서 이른 오전의 광보상점 시점에 CO2 농도는 906µmol·mol-1수준으로 보고하였는데 본 실험에서는 하루의 첫 CO2 공급 시작 시점의 CO2 농도(PV )는 681–694µmol·mol-1로 예측되었고 MV CO2도 557–737µmol·mol-1범위를 나타내 다소 낮은 경향을 보였다. 공급 전 CO2 농도를 예측한 것과 CO2 센서를 활용한 실측치를 비교하였을 때 약 0.73의 상관관계(r2)를 보였다(Fig. 2).
Table 3.
Representative data of predicted values (PV) of the CO2 concentration in the greenhouse prior to the first CO2 supplementation. The calculation was conducted between the 24th and 25th of March of 2023 in experiment 1
| Hour |
MV of DT (°C) |
MV of RH (%) |
MV of LT (°C) |
MV of IR (W m-2) |
MVyof CO2 (µmol·mol-1) |
PV of CO2 conc. (µmol·mol-1) |
PV of Net assimilates (g CO2 m-2 h-1) |
PV of ventilated CO2 loss (g CO2 m-2 h-1) |
PV of supplemental CO2 (g CO2 m-2 h-1) |
PV of CO2 after Supplement (µmol·mol-1) |
PV of CO2 after crop absorbs (µmol·mol-1) |
PV of ventilated CO2 loss (µmol·mol-1) | ||
| 24th of March | A | B | C | D | (A+D) | (A+D)-B | (A+D)-B-C | |||||||
| 7 | 17 | 87 | 16 | 54 | 557 | 683z | 5.22 | 1.83 | 7.07 | 704 | 688 | 683 | ||
| 8 | 19 | 80 | 17 | 93 | 478 | 683 | 5.82 | 17.2 | 4.01 | 695 | 677 | 625 | ||
| 9 | 21 | 71 | 18 | 143 | 502 | 625 | 6.33 | 21.3 | 5.45 | 642 | 623 | 558 | ||
| 10 | 20 | 53 | 19 | 132 | 484 | 558 | 6.89 | 29.4 | 9.89 | 588 | 567 | 478 | ||
| 11 | 23 | 43 | 18 | 308 | 408 | 478 | 6.50 | 22.8 | 22.6 | 547 | 527 | 457 | ||
| 12 | 22 | 41 | 20 | 314 | 412 | 457 | 7.39 | 19.7 | 32.7 | 557 | 534 | 474 | ||
| 13 | 23 | 38 | 20 | 296 | 412 | 474 | 7.39 | 26.9 | 28.1 | 560 | 538 | 456 | ||
| 14 | 21 | 39 | 20 | 232 | 414 | 456 | 7.51 | 16.4 | 29.6 | 546 | 523 | 473 | ||
| 15 | 21 | 39 | 19 | 189 | 417 | 473 | 7.08 | 22.9 | 25.2 | 550 | 528 | 459 | ||
| 16 | 20 | 40 | 20 | 136 | 422 | 459 | 7.09 | 13.8 | 23.8 | 531 | 509 | 468 | ||
| 17 | 19 | 53 | 18 | 76 | 415 | 468 | 6.55 | 5.37 | 11.5 | 503 | 483 | 466 | ||
| 18 | 18 | 72 | 18 | 26 | 458 | 466 () | 6.45 | 1.13 | 7.54 | 489 | 470 | 466 | ||
| 25th of March | PV of nighttime respiration: 133 µmol·mol-1 between 7pm and 7am | |||||||||||||
| 7 | 17 | 93 | 16 | 18 | 737 | 681z (PV ) | 5.40 | 0.54 | 5.92 | 698 | 682 | 681 | ||
| 8 | 16 | 91 | 16 | 44 | 653 | 681 | 5.45 | 8.22 | 4.61 | 694 | 678 | 653 | ||
| 9 | 19 | 79 | 17 | 104 | 484 | 653 | 5.66 | 16.9 | 4.37 | 667 | 649 | 598 | ||
| 10 | 27 | 66 | 19 | 355 | 481 | 598 | 7.03 | 26.7 | 7.11 | 620 | 599 | 516 | ||
| 11 | 28 | 38 | 26 | 462 | 401 | 516 | 10.6 | 32.2 | 20.1 | 578 | 545 | 445 | ||
| 12 | 27 | 37 | 23 | 511 | 400 | 445 | 8.76 | 11.6 | 33.0 | 547 | 520 | 484 | ||
| 13 | 27 | 35 | 23 | 414 | 406 | 484 | 9.01 | 25.8 | 24.6 | 560 | 532 | 452 | ||
| 14 | 28 | 34 | 23 | 354 | 401 | 452 | 8.83 | 10.3 | 24.5 | 529 | 501 | 469 | ||
| 15 | 28 | 34 | 24 | 243 | 408 | 469 | 9.63 | 11.0 | 19.4 | 529 | 499 | 465 | ||
| 16 | 22 | 38 | 22 | 100 | 418 | 465 | 8.66 | 7.70 | 16.3 | 515 | 489 | 465 | ||
| 17 | 21 | 41 | 21 | 73 | 431 | 465 | 7.61 | 6.97 | 14.6 | 509 | 486 | 465 | ||
| 18 | 19 | 72 | 19 | 27 | 472 | 465 | 6.64 | 1.27 | 7.92 | 489 | 469 | 465 | ||
Table 4.
Representative data of predicted values (PV) of the CO2 concentration in the greenhouse prior to the first CO2 supplementation. The calculation was conducted between the 25th and 26th of March of 2023 in experiment 1
| Hour |
MV of DT (°C) |
MV of RH (%) |
MV of LT (°C) |
MV of IR (W m-2) |
MV of CO2 (µmol·mol-1) |
PV of CO2 conc. (µmol·mol-1) |
PV of net assimilates (g CO2 m-2 h-1) |
PV of ventilated CO2 loss (g CO2 m-2 h-1) |
PV of supplemental CO2 (g CO2 m-2 h-1) |
PV of CO2 after Supplement (µmol·mol-1) |
PV of CO2 after crop absorbs (µmol·mol-1) |
PV of ventilated CO2 loss (µmol·mol-1) | ||
| 25th of March | A | B | C | D | (A+D) | (A+D)-B | (A+D)-B-C | |||||||
| 7 | 17 | 93 | 16 | 18 | 737 | 681z | 5.40 | 0.54 | 5.92 | 698 | 682 | 681 | ||
| 8 | 16 | 91 | 16 | 44 | 653 | 681 | 5.45 | 8.22 | 4.61 | 694 | 678 | 653 | ||
| 9 | 19 | 79 | 17 | 104 | 484 | 653 | 5.66 | 16.9 | 4.37 | 667 | 649 | 598 | ||
| 10 | 27 | 66 | 19 | 355 | 481 | 598 | 7.03 | 26.7 | 7.11 | 620 | 599 | 516 | ||
| 11 | 28 | 38 | 26 | 462 | 401 | 516 | 10.6 | 32.2 | 20.1 | 578 | 545 | 445 | ||
| 12 | 27 | 37 | 23 | 511 | 400 | 445 | 8.76 | 11.6 | 33.0 | 547 | 520 | 484 | ||
| 13 | 27 | 35 | 23 | 414 | 406 | 484 | 9.01 | 25.8 | 24.6 | 560 | 532 | 452 | ||
| 14 | 28 | 34 | 23 | 354 | 401 | 452 | 8.83 | 10.3 | 24.5 | 529 | 501 | 469 | ||
| 15 | 28 | 34 | 24 | 243 | 408 | 469 | 9.63 | 11.0 | 19.4 | 529 | 499 | 465 | ||
| 16 | 22 | 38 | 22 | 100 | 418 | 465 | 8.66 | 7.70 | 16.3 | 515 | 489 | 465 | ||
| 17 | 21 | 41 | 21 | 73 | 431 | 465 | 7.61 | 6.97 | 14.6 | 509 | 486 | 465 | ||
| 18 | 19 | 72 | 19 | 27 | 472 | 465 () | 6.64 | 1.27 | 7.92 | 489 | 469 | 465 | ||
| 26th of March | PV of nighttime respiration: 140 µmol·mol-1 between 7pm and 7am | |||||||||||||
| 7 | 16 | 90 | 16 | 40 | 643 | 694z (PV ) | 5.27 | 1.18 | 6.45 | 713 | 698 | 694 | ||
| 8 | 20 | 78 | 17 | 153 | 495 | 694 | 5.87 | 23.0 | 3.24 | 707 | 686 | 616 | ||
| 9 | 23 | 44 | 18 | 373 | 472 | 616 | 6.24 | 55.4 | 4.72 | 631 | 611 | 442 | ||
| 10 | 27 | 28 | 20 | 559 | 492 | 442 | 7.13 | 9.7 | 30.6 | 537 | 515 | 485 | ||
| 11 | 27 | 26 | 22 | 557 | 404 | 485 | 8.47 | 30.0 | 26.3 | 566 | 540 | 447 | ||
| 12 | 26 | 26 | 23 | 557 | 406 | 447 | 8.70 | 14.2 | 35.7 | 558 | 531 | 487 | ||
| 13 | 27 | 23 | 22 | 549 | 406 | 487 | 8.50 | 36.3 | 29.1 | 577 | 551 | 438 | ||
| 14 | 24 | 18 | 22 | 384 | 414 | 438 | 8.27 | 9.47 | 36.9 | 551 | 526 | 497 | ||
| 15 | 23 | 17 | 22 | 277 | 414 | 497 | 8.41 | 31.6 | 22.6 | 566 | 540 | 443 | ||
| 16 | 22 | 19 | 23 | 131 | 413 | 443 | 9.20 | 4.34 | 18.9 | 501 | 473 | 460 | ||
| 17 | 20 | 17 | 22 | 83 | 423 | 460 | 8.62 | 5.99 | 15.7 | 507 | 481 | 463 | ||
| 18 | 18 | 56 | 17 | 32 | 437 | 463 | 5.66 | 1.15 | 6.88 | 484 | 467 | 463 | ||
실험 2. 실험 온실에서 야간 호흡량을 고려한 CO2 시비량 예측
Table 5에서 온실 야간 기온이 13–21°C 범위를 보였던10월 16일 일몰 시점(17:00)의 CO2 농도()는 448µmol·mol-1이고, 야간 시간대(18:00–7:00)에 누적 호흡량은 121µmol·mol-1이므로 10월 17일 하루의 첫 CO2 공급 시작 시점(7:00)의 CO2 농도(PV )는 569µmol·mol-1로 예측되었다. PV CO2 (A)는 424–570µmol·mol-1 범위였고 MV CO2 농도는459–758µmol·mol-1범위였다(Table 5). 또한, Table 5에서 10월 16–17일(47DAT)은 엽면적지수(LAI)가 2.75m2·m-2조건으로(Table 7), 순광합성율(B)이 3.6–9.6g CO2·m-2·h-1, 환기에 의한 CO2 손실량(C)은 0.5–52.2g CO2·m-2·h-1, CO2 시비량(D)은 4.6–44.8g CO2·m-2·h-1로 예측되었다.
Table 5.
Representative data of predicted values (PV) of the CO2 concentration in the greenhouse prior to the first CO2 supplementation. The calculation was conducted between the 16th and 17th of October of 2023 in experiment 2
| Hour |
MV of DT (°C) |
MV of RH (%) |
MV of LT (°C) |
MV of IR (W m-2) |
MV of CO2 (µmol·mol-1) |
PV of CO2 conc. (µmol·mol-1) |
PV of Net assimilates (g CO2 m-2 h-1) |
PV of ventilated CO2 loss (g CO2 m-2 h-1) |
PV of supplemental CO2 (g CO2 m-2 h-1) |
PV of CO2 after Supplement (µmol·mol-1) |
PV of CO2 after crop absorbs (µmol·mol-1) |
PV of ventilated CO2 loss (µmol·mol-1) | ||
| 16th of October | A | B | C | D | (A+D) | (A+D)-B | (A+D)-B-C | |||||||
| 7 | 16 | 78 | 13 | 15 | 470 | 609z | 4.41 | 1.20 | 5.72 | 620 | 611 | 609 | ||
| 8 | 17 | 78 | 13 | 47 | 446 | 609 | 4.43 | 21.5 | 4.21 | 617 | 609 | 569 | ||
| 9 | 20 | 70 | 15 | 133 | 694 | 569 | 5.05 | 36.8 | 6.64 | 581 | 572 | 503 | ||
| 10 | 22 | 67 | 19 | 202 | 812 | 503 | 7.07 | 24.6 | 13.0 | 527 | 514 | 468 | ||
| 11 | 23 | 74 | 22 | 226 | 473 | 468 | 8.28 | 11.5 | 14.9 | 496 | 480 | 458 | ||
| 12 | 21 | 44 | 24 | 260 | 456 | 458 | 9.35 | 37.8 | 38.1 | 530 | 512 | 442 | ||
| 13 | 21 | 40 | 20 | 266 | 452 | 442 | 7.37 | 24.8 | 44.8 | 526 | 512 | 466 | ||
| 14 | 21 | 41 | 21 | 181 | 455 | 466 | 7.86 | 38.8 | 31.5 | 525 | 510 | 437 | ||
| 15 | 22 | 57 | 21 | 146 | 483 | 437 | 8.02 | 5.19 | 18.4 | 472 | 456 | 447 | ||
| 16 | 22 | 65 | 22 | 86 | 546 | 447 | 8.41 | 3.82 | 13.0 | 471 | 455 | 448 | ||
| 17 | 21 | 63 | 21 | 13 | 595 | 448 | 7.76 | 0.77 | 8.62 | 464 | 450 | 448 | ||
| 17th of October | PV of nighttime respiration: 121 µmol·mol-1 between 6pm and 7am | |||||||||||||
| 7 | 13 | 79 | 11 | 11 | 513 | 569 z | 3.56 | 0.99 | 4.67 | 578 | 571 | 570 | ||
| 8 | 15 | 81 | 12 | 48 | 492 | 570 | 3.87 | 17.7 | 4.61 | 578 | 571 | 538 | ||
| 9 | 19 | 71 | 14 | 147 | 744 | 538 | 4.79 | 26.9 | 7.68 | 553 | 544 | 493 | ||
| 10 | 23 | 64 | 20 | 195 | 758 | 493 | 7.30 | 17.1 | 12.4 | 517 | 503 | 471 | ||
| 11 | 23 | 71 | 23 | 225 | 547 | 471 | 8.97 | 11.9 | 15.2 | 500 | 482 | 460 | ||
| 12 | 21 | 41 | 24 | 250 | 460 | 460 | 9.60 | 42.3 | 40.1 | 535 | 517 | 438 | ||
| 13 | 22 | 38 | 20 | 244 | 462 | 438 | 7.17 | 20.1 | 44.8 | 522 | 509 | 471 | ||
| 14 | 22 | 35 | 21 | 181 | 459 | 471 | 8.05 | 52.2 | 35.4 | 538 | 523 | 424 | ||
| 15 | 24 | 60 | 22 | 150 | 488 | 424 | 8.24 | 0.73 | 15.2 | 453 | 437 | 436 | ||
| 16 | 22 | 59 | 24 | 87 | 492 | 436 | 9.51 | 2.33 | 14.5 | 463 | 445 | 441 | ||
| 17 | 20 | 60 | 21 | 11 | 537 | 441 | 7.79 | 0.50 | 8.58 | 457 | 442 | 441 | ||
Table 6.
Representative data of predicted values (PV) of the CO2 concentration in the greenhouse prior to the first CO2 supplementation. The calculation was conducted between the 17th and 18th of October of 2023 in experiment 2
| Hour |
MV of DT (°C) |
MV of RH (%) |
MV of LT (°C) |
MV of IR (W m-2) |
MV of CO2 (µmol·mol-1) |
PV of CO2 conc. (µmol·mol-1) |
PV of Net assimilates (g CO2 m-2 h-1) |
PV of ventilated CO2 loss (g CO2 m-2 h-1) |
PV of supplemental CO2 (g CO2 m-2 h-1) |
PV of CO2 after Supplement (µmol·mol-1) |
PV of CO2 after crop absorbs (µmol·mol-1) |
PV of ventilated CO2 loss (µmol·mol-1) | ||
| 17th of October | A | B | C | D | (A+D) | (A+D)-B | (A+D)-B-C | |||||||
| 7 | 13 | 79 | 11 | 11 | 513 | 569 z | 3.56 | 0.99 | 4.67 | 578 | 571 | 570 | ||
| 8 | 15 | 81 | 12 | 48 | 492 | 570 | 3.87 | 17.7 | 4.61 | 578 | 571 | 538 | ||
| 9 | 19 | 71 | 14 | 147 | 744 | 538 | 4.79 | 26.9 | 7.68 | 553 | 544 | 493 | ||
| 10 | 23 | 64 | 20 | 195 | 758 | 493 | 7.30 | 17.1 | 12.4 | 517 | 503 | 471 | ||
| 11 | 23 | 71 | 23 | 225 | 547 | 471 | 8.97 | 11.9 | 15.2 | 500 | 482 | 460 | ||
| 12 | 21 | 41 | 24 | 250 | 460 | 460 | 9.60 | 42.3 | 40.1 | 535 | 517 | 438 | ||
| 13 | 22 | 38 | 20 | 244 | 462 | 438 | 7.17 | 20.1 | 44.8 | 522 | 509 | 471 | ||
| 14 | 22 | 35 | 21 | 181 | 459 | 471 | 8.05 | 52.2 | 35.4 | 538 | 523 | 424 | ||
| 15 | 24 | 60 | 22 | 150 | 488 | 424 | 8.24 | 0.73 | 15.2 | 453 | 437 | 436 | ||
| 16 | 22 | 59 | 24 | 87 | 492 | 436 | 9.51 | 2.33 | 14.5 | 463 | 445 | 441 | ||
| 17 | 20 | 60 | 21 | 11 | 537 | 441 | 7.79 | 0.50 | 8.58 | 457 | 442 | 441 | ||
| 18th of October | PV of nighttime respiration: 155 µmol·mol-1 between 6pm and 7am | |||||||||||||
| 7 | 18 | 70 | 16 | 18 | 525 | 596z | 5.24 | 0.73 | 6.36 | 608 | 598 | 597 | ||
| 8 | 20 | 72 | 16 | 59 | 497 | 597 | 5.42 | 16.0 | 5.47 | 607 | 597 | 567 | ||
| 9 | 22 | 63 | 18 | 129 | 696 | 567 | 6.55 | 27.7 | 7.83 | 582 | 569 | 517 | ||
| 10 | 25 | 64 | 19 | 188 | 743 | 517 | 6.67 | 21.7 | 10.5 | 537 | 524 | 483 | ||
| 11 | 24 | 78 | 23 | 181 | 474 | 483 | 8.99 | 12.1 | 13.6 | 509 | 492 | 469 | ||
| 12 | 22 | 52 | 22 | 198 | 497 | 469 | 8.64 | 41.1 | 31.5 | 528 | 512 | 434 | ||
| 13 | 23 | 47 | 21 | 190 | 493 | 434 | 7.74 | 18.6 | 52.6 | 534 | 519 | 484 | ||
| 14 | 23 | 46 | 20 | 173 | 488 | 484 | 7.61 | 80.8 | 37.8 | 556 | 541 | 388 | ||
| 15 | 23 | 54 | 21 | 110 | 500 | 388 | 7.72 | 0 | 23.3 | 432 | 418 | 418 | ||
| 16 | 24 | 65 | 21 | 62 | 540 | 418 | 7.83 | 0 | 12.6 | 442 | 427 | 427 | ||
| 17 | 23 | 63 | 21 | 14 | 562 | 427 | 8.13 | 0.20 | 9.21 | 444 | 429 | 428 | ||
Table 7.
Plant height, leaf number (no.), leaf area, LAI (leaf area index), SPAD, and fresh and dry weights of leaves and stems in experiment 2
|
Date (DAT) |
Plant height (cm) |
Leaf no. (no.·plant-1) |
Leaf area (m2·plant-1) |
LAI (m2·m-2) | SPAD |
Leaf fwt. |
Leaf dwt. |
Stem fwt. |
Stem dwt. |
| (g·plant-1) | |||||||||
| 41 | 173(11.9) z | 24.7(1.5) | 0.69(0.04) | 2.08 | 50.7(2.7) | 315(25.7) | 34.3(3.7) | 170(17.4) | 18.2(2.3) |
| 47 | 191(12.0) | 29.0(0) | 0.92(0.04) | 2.75 | 52.1(1.8) | 410(19.2) | 46.5(0.7) | 256(42.3) | 27.8(5.4) |
| 54 | 206(13.7) | 28.3(1.5) | 1.19(0.20) | 3.56 | 51.4(0.2) | 582(88.0) | 66.3(12.8) | 314(33.3) | 36.7(5.8) |
| 59 | 212(15.1) | 28.9(2.2) | 1.32(0.14) | 3.97 | 52.1(2.4) | 633(80.8) | 73.6(10.0) | 336(52.6) | 44.1(5.7) |
Table 6에서 10월 17일 일몰 시점(17:00)의 는 441µmol·mol-1로 예측되었고 야간 시간대(18:00–7:00)에 누적 호흡량은 155µmol·mol-1이므로 10월 18일 하루의 첫 CO2 공급 시작 시점(7:00)의 CO2 농도(PV )는 596µmol·mol-1로 예측되었다. 10월 18일 PV CO2 (A)는 388–597µmol·mol-1 범위였으며 MV CO2 농도는 488–743µmol·mol-1 범위를 보였다(Table 6). Table 6에서 10월 18일은 순광합성율(B)이 5.2–9.0g CO2·m-2·h-1, 환기에 의한 CO2 손실량(C)은 0–80.8g CO2·m-2·h-1, CO2 시비량(D)은 5.47–52.6g CO2·m-2·h-1로 예측되었다.
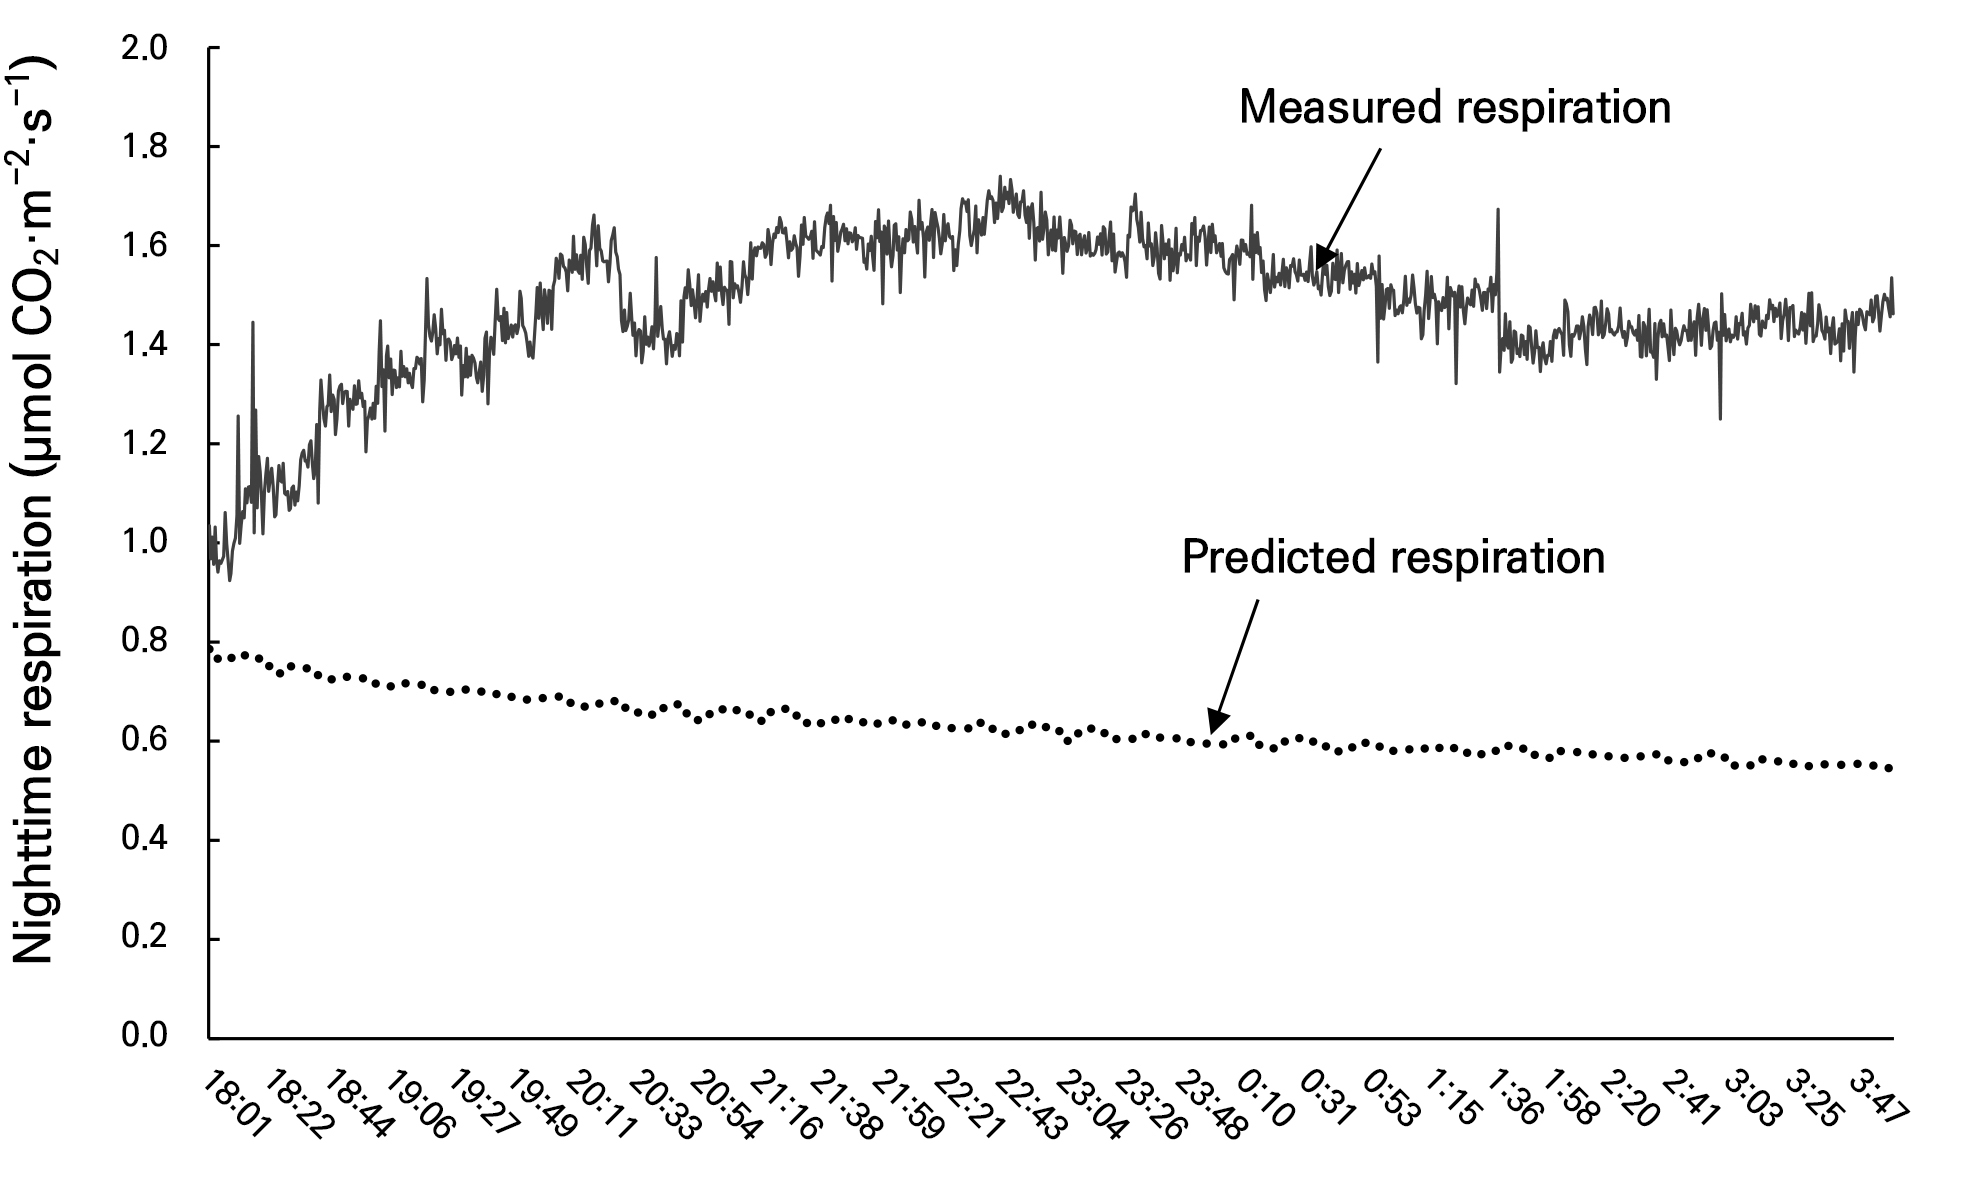
야간 시간대 호흡량은 측정치의 경우 10월 11–12일에 평균 1.48(±0.145) µmol CO2·m-2·s-1, 예측값은 평균 0.650 (±0.184) µmol CO2·m-2·s-1였으며(Fig. 3), 10월 16일에 측정된 호흡량은 평균 0.735(±0.228) µmol CO2·m-2·s-1, 예측 호흡량은 평균 0.512(±0.007) µmol CO2·m-2·s-1 범위로(data not shown) 측정값보다 예측값이 낮았다. Tartachnyk and Blanke (2007)는 온실 온도가 14–22°C, VPD가 0.6–1.4kPa, PAR 84–700µmol·m-2·s-1조건에서 토마토 잎의 야간 호흡량이 1월에 약 2µmol CO2·m-2·s-1, 2월에 3µmol CO2·m-2·s-1이었다고 하였다.
본 연구 결과에서 토마토 온실 야간 기온이 16–19°C 범위였던 3월 24–26일의 3일간 예측된 CO2 시비량은 3.24–36.9g CO2·m-2·h-1범위였고, 실험 온실의 야간 기온이 최저 13°C까지 내려간 조건이였던 10월 16–18일의 3일간 예측된 CO2는 4.21–52.6g CO2·m-2·h-1범위였다. 온실의 최저 야간 기온이 호흡량에 영향을 미치고 그에 따라 CO2 시비량 예측값이 달라지는 것을 알 수 있다. 따라서, 기존 CO2 공급량 예측 모델식에 야간 호흡이 도입된 새로운 모델식은 온실 CO2 공급량 조절 방법에 활용될 수 있을 것으로 보인다.
