

Introduction
Materials and Methods
Scion and Rootstock Varieties
Measuring Moisture Content of Scions
Hyperspectral Imaging System
Results and Discussion
Moisture Content and Spectral Reflectance Characteristics of Cucumber Seedlings
Prediction of Moisture Content using a Hyperspectral Imaging System
Introduction
The production of healthy grafted seedlings is an important step for the stable yield of horticultural crops. For this reason, shading materials or plastic films are widely used to keep the high relative humidity and low light intensity around grafted seedlings in greenhouse or tunnel. So, it is quite difficult to optimally control the environment during healing and acclimation of grafted seedlings under natural light. Thus, growers rely on their experience for the production management of grafted
seedlings (Kim, 1996).
Moisture is critical for grafted plants. After grafting, seedlings must be cared such that the moisture content of the grafts may not be lost excessively. After 3-4 days of water stress, the grafted seedlings begin to regain moisture to normal levels, suggesting that the moisture content of the scion is an indicator of healthy grafting. It is common to observe and monitor newly developing adventitious roots out of a stem of rootstock until the wilted scion looks recovered. However, visual observation is inconsistent and can be labor-intensive. In addition, if water stress is not carefully managed, it may lead to death of the grafted plant or the grafted seedlings may become intermediate hosts to diseases. If the moisture content is an indicator of how well the scion takes root, then it is informative to measure the moisture content, which is generally determined by drying the plants in an oven, which is destructive and time-consuming. Therefore, there is a growing interest in obtaining the moisture content in grafted seedlings, non-destructively.
A hyperspectral image consists of narrow, continuous spectral bands and the reflection spectrum of young leaves from a given light source has unique information of the sample (Mishra et al., 2017). This spectrum is called a “signature” and is used to diagnose plant disease (Apan et al., 2004; Jones et al., 2010; Yuan et al., 2014) and plant stress (Behmann et al., 2014; Park and Cho, 2014). Previously, Lobell and Asner (2002) and Eitel et al. (2006) reported that moisture can absorb light at specific wavelengths. This suggests that the moisture content of plants can be predicted using hyperspectral characteristics.
The purpose of this study was to obtain hyperspectral reflectance of grafted seedlings in the shortwave infrared (SWIR) region, to analyze the relationship between moisture content and the reflectance, and to develop a model that can predict the moisture content of living grafted cucumber seedlings.
Materials and Methods
Scion and Rootstock Varieties
The cucumber Cucumis sativus L. cv. Eunsung baekdadaki (Hung-nong Seeds Co., Korea) was used as scion and the pumpkin Cucurbita ficifolia cv. Heukjong (Farm Hannong Co., Korea) was used as rootstock. Cucumber seedlings were grown on a 40-cell tray for 7 days in a closed chamber for grafting. The cucumber scion was cut approximately 1 cm below the cotyledons at a 45° angle. The pumpkin rootstock was cut at the same angle as the scion, leaving only one cotyledon. The grafting clip joined the two plants such that the cross-sections of the grafted leaves were aligned with each other. The grafting chamber was illuminated with a mixture of blue and red LEDs with a photosynthetic photon flux (PPF) of 50 µmol·m-2·s-1. The chamber was set to darkness for 1 day, followed by a photoperiod of 16/8 h (day/night) for 6 days, and the temperature and relative humidity were constant at 25°C and 90%, respectively.
Measuring Moisture Content of Scions
The oven method was used to measure the moisture content of grafted cucumber seedlings. The scion was separated from the rootstock, hyperspectral images were taken, and the fresh weight (WFresh, g) of the scion was measured using an electronic balance (AB204-S, Mettler Toledo, USA). The fresh sample was then dried in an 80°C oven for 72 h before the dry weight (WDry, g) was measured. The wet-basis moisture content (MC) was calculated using the following equation:
 (1)
(1)
Hyperspectral Imaging System
Image Acquisition
Hyperspectral images were acquired with a SWIR camera (SWIR3.0, Specim, Finland) that had a spectrometer and a mercury cadmium telluride (MCT) detector. The SWIR camera images were in the spectral range of 900-2,500 nm. This range was divided into 288 bands, each with a 5.6-nm interval and 384 pixels. Two 650 W halogen lamps (64540 BVM 650W, Osram, Germany) were used as the light source. Hyperspectral images in the SWIR region were taken from a total 280 cucumber seedlings (40 seedlings per day for 7 days) immediately after grafting, along with a white reference plate (SRT-99100, Labsphere, USA) whose reflectance was 99%. SpectralDAQ (Specim, Finland) software was implemented in the camera set frame rate at 40 fps and the exposure time 22.8 ms.
Preprocessing of Spectra and Extraction of the Region of Interest
The original images obtained with the hyperspectral imaging system were corrected to the relative brightness by the equation:
 (2)
(2)
where Rraw is the original spectrum of the hyperspectral image, Rdark the dark spectrum with the lens closed, and Rwhite the reference spectrum of the white plate that reflected 99% of the light. The line-scanned data from the SWIR camera was used to calculate the Rwhite.
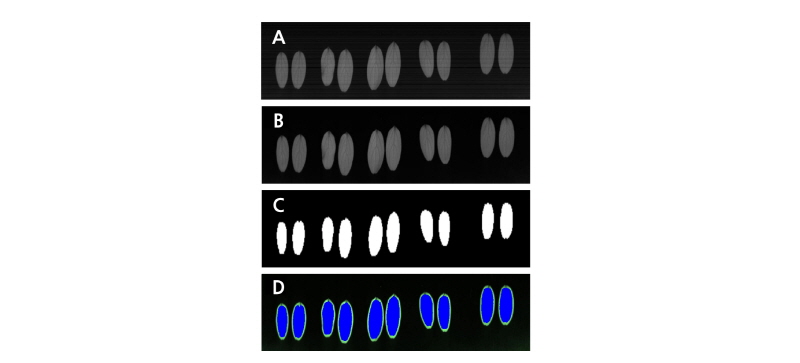
The region of interest (ROI) was extracted from brightness-corrected hyperspectral image (Fig. 1). Two wavelengths 1,745 nm and 2,025 nm were used to identify sample images from the background. To remove the influence of the edge of the scion, morphology operation was performed on the images. Normalization, the first order differentiation, and smoothing were applied to preprocess the acquired hyperspectral image data (Fig. 1). Mean-variance normalization and Savitzky-Golay first-order differentiation were performed on the extracted ROI spectra. Then, the normalized spectrum was further processed with smoothing. MATLAB (2017a, MathWorks, USA) was used for all preprocessing.

Statistical Model Development and Significant Wavelength Analysis
The SWIR hyperspectral images contained various information about the sample; however, not all wavelengths were related to the moisture content. It was necessary to find distinct wavelengths for an accurate estimation of the moisture content. In this paper, a statistical model was developed to predict the moisture content of the cucumber seedlings. The model performance was statistically analyzed in order to determine the significant wavelengths associated with the moisture content of the cucumber seedlings.
A total of 280 samples were divided into two groups: one for calibration datasets for prediction model development and the other for validation datasets for verification. The moisture content was sorted in descending order and classified into calibration and validation datasets at a ratio of 3:1. Then, correlation coefficient spectrum (CCS) analysis, multiple linear regression (MLR) analysis, and partial least square (PLS) regression analysis were performed using the calibration dataset.
The CCS analysis selected wavelengths with a large absolute correlation coefficient (r) between the moisture content and the spectral reflectance of the cucumber seedlings. In the present study, the criterion of |r|>0.6 was applied. The MLR is a statistical analysis method that evaluates the relationship between two or more independent variables in the linear regression model. Independent variables by stepwise method were selected as significant wavelengths that can be used to predict moisture content of sample plants. The PLS regression analysis is an advanced type of the principal component analysis that uses a principal component without correlation between independent variables, as a new independent variable to estimate dependent variables. In the PLS regression analysis, the appropriate number of factors was determined by the lowest predicted residual error sum of squares (PRESS) which cross-validates factors using the Leave-One-Out method. The smaller the PRESS value is, the better the predictability of the model (Osten, 1988). The B coefficients were determined by the X-loading, X-weight, and Y-weight during the PLS regression process.
 (3)
(3)
where  is the X-weight,
  the X-loading, and
  the Y-weight. The B coefficients indicate the importance of each independent variable for PLS regression analysis where the higher absolute value is, the more it influences model performance (Min and Lee, 2005). The |
 | > 0.5 criterion was applied to select wavelengths that affect the moisture content of grafted cucumber seedlings in this study. For selection of significant wavelengths, the results from CCS, MLR analysis, and the B coefficients obtained from PLS regression analysis were estimated.
Model Validation
For validation of the developed model, 70 validation datasets were used. In order to evaluate the fitness of the model, the coefficient of determination (R2), which represents the linear fit between the two values, was used. Standard error from the calibration dataset (SEC), standard error from the validation dataset (SEV), and root mean square deviation (RMSD) were also calculated as follows:
 (4)
(4)
 (5)
(5)
 (6)
(6)
where n is the number of samples, p the number of independent variables, ei the difference between the measured and calculated values, and ē is the average of ei.
Results and Discussion
Moisture Content and Spectral Reflectance Characteristics of Cucumber Seedlings
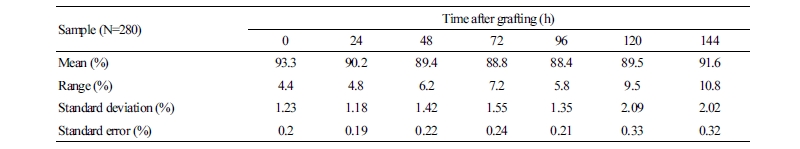
The average moisture content of the seedlings began to decrease from 93.3% before grafting to 88.4% 96 h after grafting (Table 1), and then gradually increased to initial levels because in the early stages. The grafted plants experience water stress due to injuries, while respiration and transpiration continues from the scion until complete union.
The pattern of the average reflectance of grafted cucumber seedlings as affected by two different moisture contents was almost similar (Fig. 3). Fig. 3 agreed with the report that the 1,450 nm and 1,950 nm wavelengths within the SWIR range was sensitive absorption bands for water (Carter, 1991; Curran, 1989). The lower reflectance at 0 h, the moment to start wilting, corresponded to the higher moisture content measured before grafting. The higher reflectance at 96 h corresponded to the lower moisture content after grafting. The reflection difference in the 1,450 nm region was about 3-5% but no difference in the 1,950 nm region was noted.

Prediction of Moisture Content using a Hyperspectral Imaging System
Correlation between Moisture Content and Spectral Reflectance
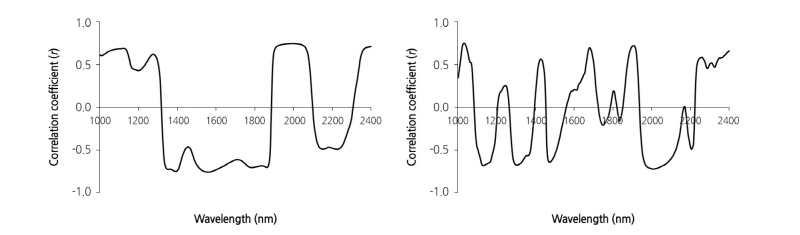
Among the 900-2,500 nm spectra obtained with the SWIR image measurement system, the reflectance data in the range of 1,000-2,400 nm were used to improve the accuracy of the prediction model by eliminating noises generated at both edges of the measurement range. In the CCS analysis, the highest, positive r between moisture content and spectral reflectance for the normalized spectrum was 0.74 at 1,997 nm, and the lowest negative r was -0.76 at 1,560 nm (Fig. 4). The wavelengths that corresponded to the absolute correlation coefficients |r| > 0.6 with normalized data were determined at 1,001-1,148 nm, 1,267-1,283 nm, 1,334-1,419 nm, 1,486-1,874 nm, 1,896-2,070 nm and 2,343-2,399 nm. The highest positive r between moisture content and reflectance for the spectrum with first order differentiation was 0.75 at 1,029 nm, and the lowest negative r was -0.72 at 2,008 nm. The wavelengths that corresponded to |r|>0.6 with first order differentiation data were determined at 1,018-1,052 nm, 1,120-1,171 nm, 1,289-1,340 nm, 1,464-1,486 nm, 1,672-1,694 nm, 1,885-1,919 nm, 1,958 -2,098 nm, and 2,377-2,399 nm. In the CCS analysis that used either normalization or first order differentiation preprocessing, the common wavelengths that corresponded to |r|>0.6 between the moisture content of the cucumber seedlings and the spectral reflectance were 1,012-1,052 nm, 1,120-1,148 nm, 1,334-1,340 nm, 1,486 nm, 1,672- 1,694 nm, 1,896-1,919 nm, 1,958-2,070 nm, 2,377-2,399 nm, where well-known moisture absorption wavelength, 1,958 nm was included.
Significant Wavelengths Related to Moisture Content by MLR Analysis
Some wavelengths that resulted from the MLR analysis with the stepwise method for predicting moisture content in grafted cucumber seedling were selected (Table 2). When the normalized spectra were used, 10 wavelengths were significant: 1,063 nm, 1,091 nm, 1,340 nm, 1,868 nm, 1,880 nm, 2,182 nm, 2,210 nm, 2,243 nm, 2,271 nm and 2,299 nm. Additionally, the spectra with first-order differentiation selected 16 wavelengths including 1,453 nm as significant for moisture absorption.
Table 2. Significant wavelengths selected by MLR analysis for predicting moisture content in grafted cucumber seedlings 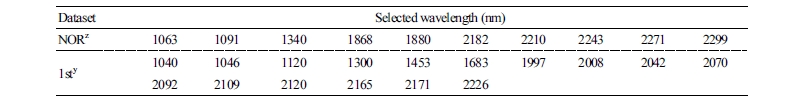 | |
zNOR: Normalization. y1st: First order derivative. | |
The B Coefficient Calculated by PLS
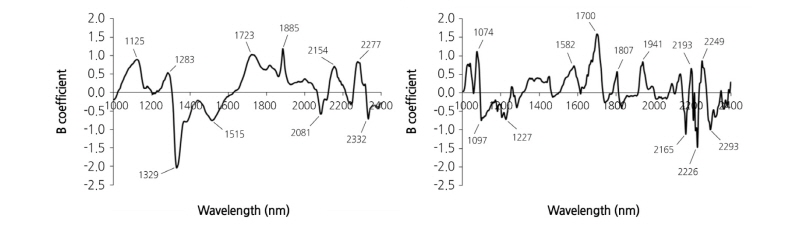
The PLS regression analysis for the moisture content in grafted cucumber seedlings and the spectral reflectance using both the normalized and first order differential spectra was applied to determine the B coefficients (Fig. 5). The wavelengths that corresponded to the absolute correlation coefficients where | | > 0.5 used the normalized spectra were 1,125 nm, 1,283 nm, 1,329 nm, 1,515 nm, 1,723 nm, 1,885 nm, 2,081 nm, 2,154 nm, 2,277 nm and 2,332 nm. The wavelengths that corresponded to |
 | > 0.5 that used the first order differential spectra were 1,074 nm, 1,097 nm, 1,227 nm, 1,582 nm, 1,700 nm, 1,807 nm, 1,941 nm, 2,165 nm, 2,193 nm, 2,226 nm, 2,249 nm and 2,293 nm. The wavelength 1,941 nm belonged to the moisture absorption band region.
Selecting Significant Wavelengths for Predicting Moisture Content
The absorption wavelengths of water with the characteristics of O-H bonds have been reported 970 nm, 1,200 nm, 1,450 nm and 1,950 nm (Curran, 1989), whereas water vapor in the atmosphere absorbs wavelengths at 940 nm and 1,140 nm (Gao and Goetz, 1990). Therefore, the significant wavelengths that were included in at least two analysis methods were 1,040-1,046 nm, 1,120-1,125 nm, 1,340 nm, 1,683 nm, 1,997 nm, 2,008 nm, 2,042 nm, 2,070 nm, 2,165 nm, and 2,226 nm. These wavelengths were included in CCS, MLR, and PLS analysis and were selected for predicting the moisture content in grafted cucumber seedlings. When we compared precious reports with the results from this study, the moisture absorption wavelengths did not coincide exactly. This is because the moisture content of the scion may have been affected by the heat from the light sources during healing, even though the controlled room temperature 18°C was thought to be good enough to minimize experimental disturbances. Our results indicated that illumination settings need careful attention.
Testing Statistical Models for Predicting Moisture Content
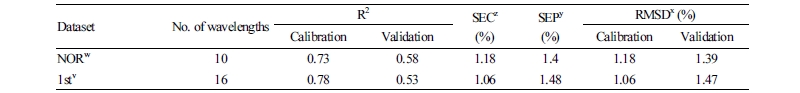
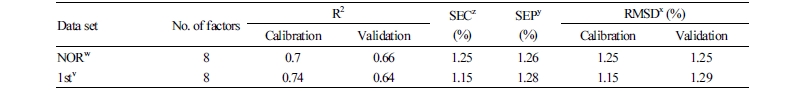
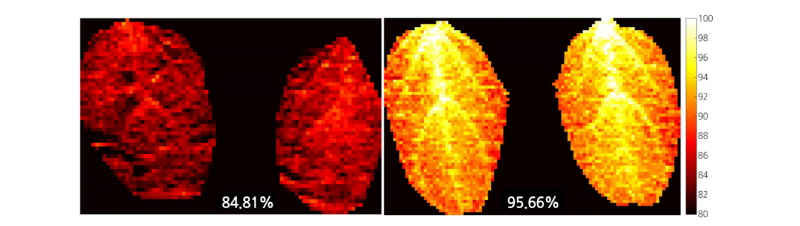
The 10 wavelengths were selected as independent variables by the MLR model using the normalized spectra (Table 3). The R2 for the calibration dataset was 0.73 and for validation 0.58; the SEC and SEV were 1.18% and 1.4%, respectively. RMSD for the calibration dataset and validation were 1.18% and 1.39%, respectively. The 16 wavelengths were selected by the MLR model using the first order differential spectra. The R2 for the calibration dataset was 0.78 and 0.53 validation, respectively. The SEC and SEV were 1.06%, 1.48%, respectively. RMSD for the calibration dataset was 1.06% and the prediction was 1.47%. The number of factors with the lowest PRESS values in the PLS regression analysis was eight whether the preprocessing method was normalization or first-order differentiation (Table 4). In the PLS regression model with normalized spectra, the R2 for calibration was 0.7 and for validation 0.66. The SEC was 1.25% and SEV 1.26%. RMSD was 1.25% for both calibration and validation datasets. In the PLS regression model with the first order differential spectra, the R2 for calibration was 0.74 and for prediction 0.64. SEC was 1.15% and SEV 1.28%. RMSD for calibration was 1.15% and for prediction 1.29%. For calibration dataset, the R2 by the MLR analysis was higher than the one by PLS regression analysis; however, the R2 by the MLR analysis was lower than the PLS for the validation dataset, which hints at the possibility that it was over-shot in the MLR model. In the validation of the PLS regression model, no meaningful difference in R2 was noted between normalization and first-order differentiation, but the former had a relatively stable prediction performance when compared to the latter. Fig. 6 shows the moisture content predicted by the PLS regression model with normalized spectra for each pixel within a scion whose average moisture contents were 84.81% and 95.66%. The moisture content at the edge of scion was lower than that of the central part around the vein. In fact, in the process of healing and acclimation of the grafted seedlings, the moisture content of a scion decreased and the edge of the scion curled inward.
In order to diagnose moisture stress in crops cultivated in the field, thermal imaging (Han et al., 2016; Martynenko et al., 2016; Santesteban et al., 2017) or chlorophyll fluorescence reaction (Bresson et al., 2015; Lichtenthaler and Babani, 2000) are commonly used, and only a few studies used hyperspectral imaging characteristics to evaluate crops grown in a greenhouse (Mangus et al., 2015; Hazrati et al., 2016; Park and Cho, 2014). Furthermore, for proper moisture management of vegetable seedlings, there was no report of the relationship between moisture content and hyperspectral image characteristics. Our results showed that the moisture content in grafted seedlings could be estimated non-destructively by using a hyperspectral imaging system.
In conclusion, we attempted to select significant wavelengths and predict the moisture content in grafted cucumber seedlings. The normalized PLS regression model was better at predicting moisture content than other analysis methods tested. We concluded that short-wave infrared hyperspectral reflectance imaging has potential as a method for estimating moisture content in vegetable seedlings. However, the determination coefficients were not high enough to the degree as we expected. This is presumably due to the fact that the change in water content in the grafted cucumbers during the healing period was about 5-6% over five days after grafting. Further research is required to improve the accuracy and stability of the model so that it includes data of grafted seedlings with larger changes in water content and minimizes measurement error due to uneven distribution of illumination of the sample plate.
