Introduction
Materials and Methods
Young Seedlings in the Laboratory
Cultivation in the Greenhouse
Chemical Reagents
Extraction and Desulfation of Glucosinolates
Determination of Desulfo-glucosinolates by HPLC Analysis
LC/MS Analysis of Desulfo-glucosinolates
Principal Component Analysis (PCA)
Results and Discussion
Introduction
Brassica vegetables belong to Cruciferous family and include many varieties of cabbage (Chinese, savoy, swamp, red and white), cauliflower, broccoli, Brussels sprouts and kale, which are consumed in high quantities all over the world (Podsedek, 2007). These vegetables possess both antioxidant and anti-carcinogenic properties (Chu et al., 2002; Cohen et al., 2000; Verhoeven et al., 1997). Especially, Chinese cabbage (Brassica rapa L. ssp. pekinensis) is exten-sively used in Asia and the major ingredient in Kimchi, a representative Korean salted and fermented vegetable. Kimchi has an important role in the diet and nutrition of Koreans (Lee, 1997) and has become popular throughout the world. Most studies on bioactive compounds in Brassica vegetables have focused on the content of glucosinolates (GSLs), a nitrogen and sulphur-containing group of compounds that is especially abundant in these species.
GSLs are β-thioglucoside N-hydroxysulfates containing a side chain and a β-d-glucopyranosyl moiety (Mithen et al., 2000). The highly variable structure of the side chain includes aliphatic (i.e. straight chain, branched chain, hydro-xylated, sulfur containing, keto-derivatives), alkenylic, aromatic, hydroxyalkyl benzoated or indolic moieties and can be multiply glycosylated. Aliphatic GSLs are derived from methionine, aromatic GSLs from phenylalanine (and possibly tyrosine), and indoly GSLs from tryptophan (Fahey et al., 2001). Upon disruption of plant tissues, GSLs are hydrolyzed to various bioactive degradation products by the endogenous enzyme myrosinase (thioglucohydrolase; E.C. 3.2.1.1). These degradation products include isothiocyanates, nitriles, thio-cyanates and other minor products (Fenwick et al., 1983a, 1983b) depending on the substrate, pH conditions, availability of ferrous ions, and the level and activity of specific protein factors such as the epithiospecifier protein (ESP) (Halkier and Du, 1997). GSLs, myrosinase and degradation products constitute a frequently-studied plant defense system that appears to deter generalist herbivores and pathogens (Chew, 1988; Renwick, 2001). GSLs and their breakdown products are known to have important several biological activities including anti-carcinogenic, anti-fungal and anti-bacterial effects (Fenwick et al., 1983a, 1983b).
Variation of GSL composition and concentration in Brassica vegetables is caused by many factors: varieties, different plant organs and development stages, growing and environmental conditions, post-harvest storage and handling procedures (Jeffery et al., 2003; Vallejo et al., 2002). The concentration of potentially health beneficial GSLs for a given species has been found to be greater in seed sprout vegetables are scarce and much of the literature still focuses upon either fully grown plants of B. oleracea crops (Charron et al., 2005; Ciska et al., 2000; Kushad et al., 1999) or seeds (Mattaus and Luftmann, 2000; West et al., 2004). De March et al. (1989) examined the variation of GSLs content during pod and seed maturity. However, the composition of individual GSLs has not been studied in detail during plant growth and development. Especially, a comprehensive understanding of the GSL profiles and contents during seeding and leaf development of Korean Chinese cabbage is still lacking.
The proportion of each individual GSL contributing to the concentration may significantly alter the biological effects of the crop at various growth stages. Variation of individual and total GSL contents represents the net effect of biosynthesis, transport and catabolism of GSLs, and precise knowledge of the GSL profiles in various growth stages provides a foundation for studying the relative importance of these physiological processes. Therefore, the objective of this study was to investigate changes of individual GSL concentration during plant development from sowing to harvest in Korean Chinese cabbage.
Materials and Methods
Young Seedlings in the Laboratory
Seeds of ‘Winter pride’ cultivar of Korean Chinese cabbage were obtained from Seminis Korea Co. (Seoul, Republic of Korea). In the laboratory, seeds were soaked in distilled water at room temperature (25 ± 2°C) for 6 h. The distilled water was drained off, and then the soaked seeds were placed on moist cotton gauze in sprouting equipment (26 × 17 × 16 cm, Miraewon Agricultural Co., Ltd., Gyeonggi-do, Republic of Korea) for germination and sprouts. The seeds were germinated in dark at 25°C, for up to 2 days. They were then grown with a 16 h light and 8h dark photoperiod and a corresponding 25/20°C cycle for grown sprouts. To maintain moistness, a small quantity of water was added to the sprouting equipment regularly. Grown sprouts during from 0 to 14 days were taken out every 24 h, and lyophilized. All experiments were conducted in triplicate.
Cultivation in the Greenhouse
Seeds (‘Winter pride’ cultivar) were planted by direct seeding method in the greenhouse (Duksung Women’s University, Seoul, Republic of Korea). Korean Chinese cabbage was grown during a period from 0 to 15 weeks at an average temperature of 20-25°C, 60-80% relative humidity and used natural fertilizers. Water supply and insect and disease controls were properly done. Korean Chinese cabbage of each grown stages were harvested once every week after being sown, immediately freeze dried and stored at -70°C.
Chemical Reagents
Sinigrin monohydrate from horseradish (99%) and Helix pomatia type H-1 sulphatase (EC 3.1.6.1) were purchased from Sigma-Aldrich (St. Louis, MO, USA). Diethylaminoethyl (DEAE)-Sephadex A25 was obtained by GE Healthcare (Uppsala, Sweden). Ethanol and acetonitrile (ACN) were of high-pressure liquid chromatography (HPLC) grade, and ultrapure water was produced using a Milli-Q RG system from Millipore (Bedford, MA, USA).
Extraction and Desulfation of Glucosinolates
Desulfo-GSLs were determined according to a modified method described by ISO 9167-1 (ISO 9167, 1992). In brief, 50 mg freeze-dried samples were extracted with 1.5 mL boiling 70 % (v/v) ethanol in a water bath at 70°C for 5 min. And then, centrifugation (13,000 × g at 4°C for 20 min), the supernatant was collected in a 10mL test tube. The residue was extracted twice using the same procedure. Desulfation of the GSLs was performed on DEAE anion exchange columns. The columns were prepared by adding a slurry of Sephadex A25 (about 40 mg DW) activated with 0.5 M sodium acetate to a mini-column using a 1.0 mL pipette tip. Also, GSLs were desulfated by adding a solution of aryl sulfatase (75 μL, 28.7 units) to the column. After overnight reaction at ambient temperature, Desulfo- GSLs were eluted with 1.0 mL deionized water (0.5 mL × 2) and filtered through a 0.45 μm Teflon PTEE syringe filter for analysis. The elutes were analyzed immediately by HPLC or at -20°C until chemical analysis.
Determination of Desulfo-glucosinolates by HPLC Analysis
For quantitative analysis, desulfo-GSLs were separated by HPLC (Dionex, Sunnyvale, CA, USA) on an Inertsil ODS2 (C18) column (4.6 × 250 mm; GS Science, Tokyo, Japan). The column oven temperature was set to 35°C and a flow rate of 1.0 mL・min-1. The wavelength was set at 227 nm using a variable wavelength detector. The solvent system employed was (A) deionized water and (B) 20% (v/v) acetonitrile. The samples were separated according to the following gradient: a linear gradient of 1% to 99% solvent B for 18 min, 99% solvent B for the next 11 min, and a linear step from 99% to 1% solvent B for 3 min. HPLC profiles were obtained by injecting samples of a known volume (20 μL). Separated individual GSL peaks were characterized using liquid chromatography-electrospray ionization-mass spectrometry (LC-ESI-MS) analysis. Desulfo- GSL contents were calculated using sinigrin as an external standard and obtained by summing the individual GSLs identified.
LC/MS Analysis of Desulfo-glucosinolates
For identification of desulfo-GSLs, the column eluate was split, and 0.2 mL・min-1 directed to a Finnigan LCQ Advantage IT mass spectrometer (Thermo-Quest; Thermo Finnigan, San Jose, CA, USA) equipped with an ESI interface after passing through the flow cell of the photodiode array detector. Analysis was conducted using positive electrospray ionization source at a capillary temperature of 250°C, spray voltage of 5.5 kV, capillary voltage of 2.3 V, and tube lens offset of 48 V. Spectral data were recorded with N2 as collision gas (sheath gas of 28 arbitrary units). Data were collected and processed using the Xcalibur 1.4 version software program (Thermo Electron, Waltham, MA, USA).
Principal Component Analysis (PCA)
Variation of GSL composition during seedlings and growth stages of Korean Chinese cabbage were exported to an Excel spreadsheet and analyzed using principal component analysis (PCA). PCA is multivariate modeling method where the information in the original variables is projected onto a small number of underlying variables called principal components. Plotting the principal components can reveal interrelationships between the variables (loading plot) and detect sample patterns, grouping, similarities or differences (score plot). The PCA was performed using the SAS 9.1 software package (SAS Institute, Cary, NC). All data were visualized as a two-dimensional (two PCs) scatter plot using the principal components score and loading plots.
Results and Discussion
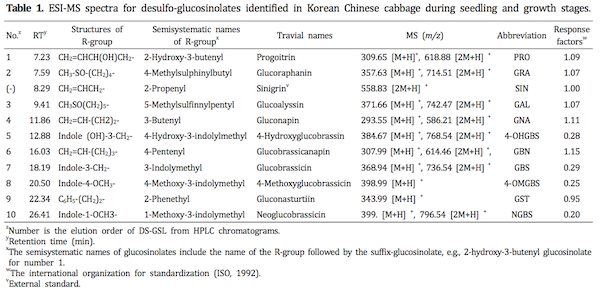
In this study, ten different individual GSLs, namely pro-goitrin (peak no. 1, 7.23 min), glucoraphanin (no. 2, 7.59 min), glucoalyssin (no. 3, 9.41 min), gluconapin (no. 4, 11.86 min), 4-hydroxyglucobrassin (no. 5, 12.88 min), glucobrassicanapin (no. 6, 16.03 min), glucobrassicin (no. 7, 18.19 min), 4-methoxyglucobrassicin (no. 8, 20.50 min), neoglucobrassicin (no. 9, 22.34 min) and gluconasturtiin (no. 10, 26.41 min), were detected in plant organs during seedlings and growth stages of Korean Chinese cabbage by LC/MS analysis (Table 1). Especially, gluconasturtiin was first observed in the vegetative tissues in three weeks after sowing. The molecular ion and fragmentation patterns are consistent with literature data (Barbieri et al., 2008) and allowed for unequivocal identification. Ten kinds of GSLs, including five aliphatic, four indolic and one aromatic GSLs based on the structure of different amino acid precursors were detected in sprouts and developed vegetative tissues of Korean Chinese cabbage.
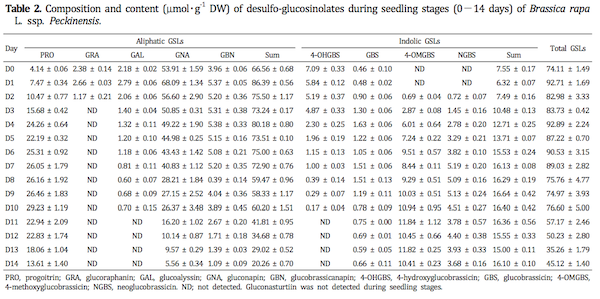
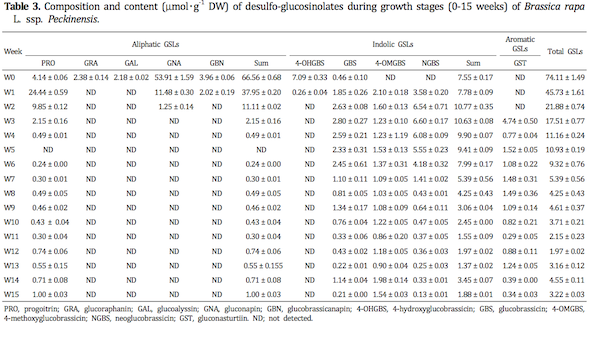
Total GSL content in plant organs during seedling and growth stages of Korean Chinese cabbages ranged from 35.26 to 92.89 μmol・g-1 DW (Table 2) and from 1.97 to 74.11 μmol・g-1 DW (Table 3), respectively. The GSL content of vegetables varies considerably based on the date of planting, environmental conditions and length of growing seasons (Cartea et al., 2008). Previous work has shown that the total GSL content in five groups of Brassica oleracea (broccoli, Brussels sprouts, cabbage, cauliflower and kale) ranges from 10.9 to 25.1 μmol・g-1 DW (Kushad et al., 1999). From germination to seven days, the total GSL content was significantly greater than those of after eight days. Also, from eight days to 14 days, the total GSL concentration decreased gradually in sprouts tissues. In general, GSL content is high in young leaves (Bennet et al., 1995; Bergman, 1970; Brudenell et al., 1999) shoots and silique walls (Lein, 1972) and decrease as the tissue matures (Clossais-Besnard and Larher, 1991; Porter et al., 1991). Large and significant decrease also occurred between the contents in one and seven week growth stages, whereas changes in total GSLs levels were not shown significant difference after eight weeks stages. The decrease in GSL content during growth stages has also been reported in other Brassica species (Clossais-Besnard and Larher, 1991; McGrefor, 1998; Pereira et al., 2002); this phenomenon may be due to dilution of GSL content during tissue expansion (Chen and Andreasson, 2001). Also, these results would agree with the results from Clossais-Besnard and Larher(1991) who indicated that GSLs, accumulated during the vegetative stage, were catabolized during the reproductive stage especially during flowering and then GSL accumulation occurred again at maturation. Rosa and Heaney (1996) also reported a large decrease of GSLs from seedling leaves to mature leaves of B. juncea, B. oleracea and B. napus. The total GSL content in developing tissues of Korean Chinese cabbage varies widely depending on duration of seedling and grown stages.
The content of the individual GSLs identified in the plant tissues at the seedling and growth stages monitored is presented in Figs. 1-2. The GSLs were classified into three groups according to their side chain: aliphatic GSLs (pro-goitrin, glucoraphanin, glucoalyssin, gluconapin, glucobrassi-canapin), indolic GSLs (4-hydroxyglucobrassin, glucobrassicin, 4-methoxy-glucobrassicin, neoglucobrassicin) and aromatic GSL (gluconasturtiin).
The major GSLs in organs of the seedling (0-14 days) were gluconapin (15.7-73.4%), progoitrin (5.59-45.4%) and 4-methoxyglucobrassicin (0-29.5%) with minor amount (≤ 10% of total GSLs) of glucoalyssin, glucobrassicanapin, glucobrassicin, neoglucobrassicin, 4-hydroxyglucobrassicin and glucoraphanin (Fig. 1). Aliphatic GSLs were predominant, with gluconapin as the most common GSL, followed by progoitrin during seedling of Korean Chinese cabbage. This result has been described previously for B. rapa (Bradshaw et al., 1984) with profile similar to that of B. napus(Sarwar and Kirkegaard, 1998). They were a major GSL group in seedling stage and remained as such during the growth monitored and their content decreased with seedling. Other study described that the content of aliphatic GSLs in leaves of B. oleracea and B. napus decreased sharply from seedling (14 days) to harvest (28 days) (Rose and Heaney, 1996). In agreement with the results recorded in our experiments. Especially, regarding the individual aliphatic GSLs, gluconapin content was highest in seed and germination period (about 73.1 μmol・g-1 DW), and it declined gradually from 73 to 15% during seedling stages (0-14 days) in Korean Chinese cabbage. During the first seven days of imbibition of B. napus seeds, the content of the GSLs, mainly aliphatic type, decreases dramatically (Fieldsend and Milfor, 1994). However, change of progoitrin content (5.59-45.4%) as the predomi-nating aliphatic GSLs during seedling period showed opposite trends with other aliphatic GSLs in our study. For example, the evolution of gluconapin and progoitrin during seedling analyzed contrastive pattern, the former decreasing with the latter increasing in content throughout the sprouting period. Maybe the differences of change in individual aliphatic GSLs content between this study and previous reports are therefore due to different cultivars and growing conditions. In experiment, levels of 4-methoxyglucobrassicin were significantly higher between two days and 14 days than other indolic GSLs. Also, two indolic GSLs (4-methoxyglucobrassicin and neoglucobrassicin) increased considerably increasing seedling duration.
In the plant tissue during growth stages (1-15 weeks), neoglucobrassicin (7.83-54.4%), progoitrin (0-53.4%), 4- methoxyglucobrassin (4.58-47.8%), gluconasturtiin (6.95- 35.1%) and glucobrassicin (0.62-26.2%) were the main individual GSLs (Fig. 2). Four aliphatic GSLs (glucoraphanin, glucoalyssin, gluconapin, and glucobrassicanapin) and one indolic GSL (4-hydroxyglucobrassin) were detected as the only important GSLs during germinating period (0-2 weeks). Individual and total GSLs in the leaves showed relatively rapid and complex changes throughout the growing period. The content of the major aliphatic GSLs, gluconapin and progoitrin tend to decrease sharply, on the other hand, the levels of indolic GSLs (4-methoxyglucobrassicin, glu-cobrassicin) and aromatic GSL (gluconasturtiin) were found to increase tend to at the beginning of growth stages. Especially, neoglucobrassicin had the highest content (4.18-6.60 μmol・g-1 DW) between two and six weeks.
These results are in agreement with the decrease of total and individual GSLs conctent during the vegetative stage of rape reported by Clossais-Besnard and Larher(1991) and the observation of Paxman and Hill(1974) that leaves of kale contain higher amounts of thiocyanate ion (an hydrolysis product of both indol-3-ylmethyl-, 1- methoxyindol-3-ylmethylglucosinolate). Other factors may include translocation of GSLs to other parts of the plant and the onset of senescence in order leaves which could also cause a disruption of cells and vacuoles and an activation of myrosinase leading to GSLs catabolism. In agreement with the results recorded in our experiment, mature tissues tend to have higher content of indol-3- ylmethyl GSL than young tissues which have been related to de novo synthesis of this group of GSLs with growth (Kushad et al., 1999). GSLs are plant defence compounds and consistent with this function are accumulated preferentially in the organs that contribute most to plant fitness at a particular moment in the growth cycle (Grubb and able, 2006; Halkier and Gershenzon, 2006).
PCA is one of the most popular clustering methods form exploratory data analysis requiring no knowledge of data structures. Identification of compounds that exhibit the greatest variance within a population and determination of closely related compounds is possible using PCA. Ten major individual GSLs peak among seedling and growth stages were identified in the chromatogram by comparing the individual UV-visible spectra and their retention times that were used for PCA. The results are indicated by the principal components score plotting (Figs. 3 and 4). The abscissa represents the principal components 1 (PC1) score, while the ordinate represents the principle component 2 (PC2) score. Each plot in Fig. 3 implies the corresponding metabolome of nine GSL concentrations during seedling periods (0-14 days). PCA revealed that the two highest ranking principal components accounted for 90.0% of the total variance within the data. The component 1, accounting for 68.5% of the total variance, showed the seedling stages according to the total GSLs content. Especially, the germination period (0-1day) clearly stood out from the other seedling stages in PC1, and four-day stage was different from the others in PC2. To investigate the contributors of the principal components further, the metabolic loadings in PC1 and PC2 were compared. In PC1, the corresponding loading was positive for 4-hydroxyglucobrassin (0.394), glucoalyssin (0.384), glucoraphanin (0.354), gluconapin (0.351) and glucobrassicanapin (0.206) and negative for 4-methoxy-glucobrassicin (-0.392), neoglucobrassicin (-0.375), progoitrin (-0.317) and glucobrassicin (-0.093). 4-Hydroxyglucobrassin was the predominant individual GSLs in PC1. In PC2, the corresponding loading was positive for glucobrassicin (0.611), glucobrassicanapin (0.555), progoitrin (0.356), gluconapin (0.308), glucoalyssin (0.155) and neoglucobrassicin (0.155) and negative for glucoraphanin (-0.210), 4-methoxyglu-cobrassicin (-0.050) and 4-hydroxyglucobrassin (-0.000). PC2 directly correlated with glucobrassicin and was inversely related with glucoraphanin. Also, corresponding metabolome of ten GSLs levels during growth stages (0-15 weeks) showed scores and loading plots of PC 1 and PC2, respectively. In Fig. 4, PC1 and PC2 explained 55.3% and 21.5% of the total variance, respectively. PC1 was highly contributed by glucolyssin (0.416), 4-hydroxyglucobrassin (0.416), glucoraphanin (0.415), glucobrassicanapin (0.384) and, but inversely correlated, by 4-methoxyglucobrassicin (-0.290), glucobrassicin (-0.166), neoglucobrassicin (-0.160); PC2 was directly correlate with glucobrassicin (0.557), neoglucobrassicin (0.554), strictly inversely related with gluconasturtiin (0.064). These results analyzed give a good visual impression of the difference or similarity between growing stages. Total and individual GSL concentration of each seedling and growth stages can be grouped and PCA could fully distinguish between these growing Korean Chinese cabbage.
In conclusion, total GSL concentrations were significantly affected by seedling and growth stages and were higher in early developing period than in mature period of Korean Chinese cabbages. Also, our results showed significant difference of composition and proportion of individual GSLs according to plant growth stages.