Introduction
Materials and Methods
Morphological Characteristics
Plant Materials and DNA Extraction
RAPD Analysis
Data Analysis
Results and Discussion
Morphological Characteristics
Principal Coordinate Analysis (PCoA)
RAPD Analysis
Genetic Distance
Introduction
Hydrangea is known for a number of attractive characteristics, and it is commonly cultivated for both landscape and ornamental plants. The genus Hydrangea is in the Hydrangeaceae family and consists of 23 species with a distribution in both the temperate and tropical regions of eastern Asia, eastern North America, and South America, and it comprises a high ornamental value and diverse growth forms (McClintock, 1957). Among them, H. macrophylla is the most popular species and one of the most commercially important flowering shrubs (Dirr, 2004; van Gelderen, 2004). Although more than 1,000 cultivars of H. macrophylla exist, many of them are similar in their growth habits,
floral characteristics, and disease susceptibility (Dirr, 2002). New sources of genetic diversity are needed to develop cultivars with improved disease resistance and flowering characteristics.
The genetic diversity among the H. macrophylla cultivars is limited due to the restricted native distribution and the multiple breeding programs that utilize the same taxa and employ similar breeding goals (Haworth-Booth, 1984; van Gelderen, 2004). Breeding efforts to improve H. paniculata, H. arborescens, and H. quercifolia are also needed. Though many hydrangea cultivars are available as genetic resources, they cannot be utilized effectively for breeding purposes because of a lack of information on their genetic relationship and compatibility. In addition, investigation of interspecific relationships, genetic diversity, and genetic-similarity clustering will provide important information for the selection of parents for a wide range of hybridization studies.
Compared to observation of morphological characteristics, which can vary depending on environmental conditions, molecular markers provide more definitive results regarding the relatedness or hybridity of a group of plants and cultivar identity (Morell et al.,1995). Molecular markers are valuable tools for the identification of genetic relationship between the species and assessment of the genetic diversity among and within species. Several types of molecular markers have been used to evaluate genetic diversity and to examine hybridization patterns (Wolfe et al., 1998). Random amplification of polymorphic DNA (RAPD) has been widely used to study the genetic relationships in many plant species because this technique is simple and it is economical (Williams et al., 1990). RAPD markers also used to detect virus resistant lines in Cucurbita spp. (Kim, 2016). Due to the ease of their use, RAPD markers are utilized for the identification of Hydrangeaceae accessions (Joung et al., 2010) and interspecific hybrid confirmations in Hydrangea species (Kudo et al., 2008).
The objective of this study was to evaluate the genetic relationships among H. macrophylla, H. paniculata, H. serrata, and H. arborescens to provide information for hydrangea breeding. Accordingly, the results will demonstrate the usefulness of the RAPD loci for species identification and future hydrangea breeding, particularly in the creation of interspecific hybrids. South Korea is one of the origins of H. serrata, but most of the commercial cultivars are imported from other geographic regions such as Europe. An improvement of the local germplasm and germplasm collected from other countries is required to develop a hydrangea breeding program in South Korea.
Materials and Methods
Morphological Characteristics
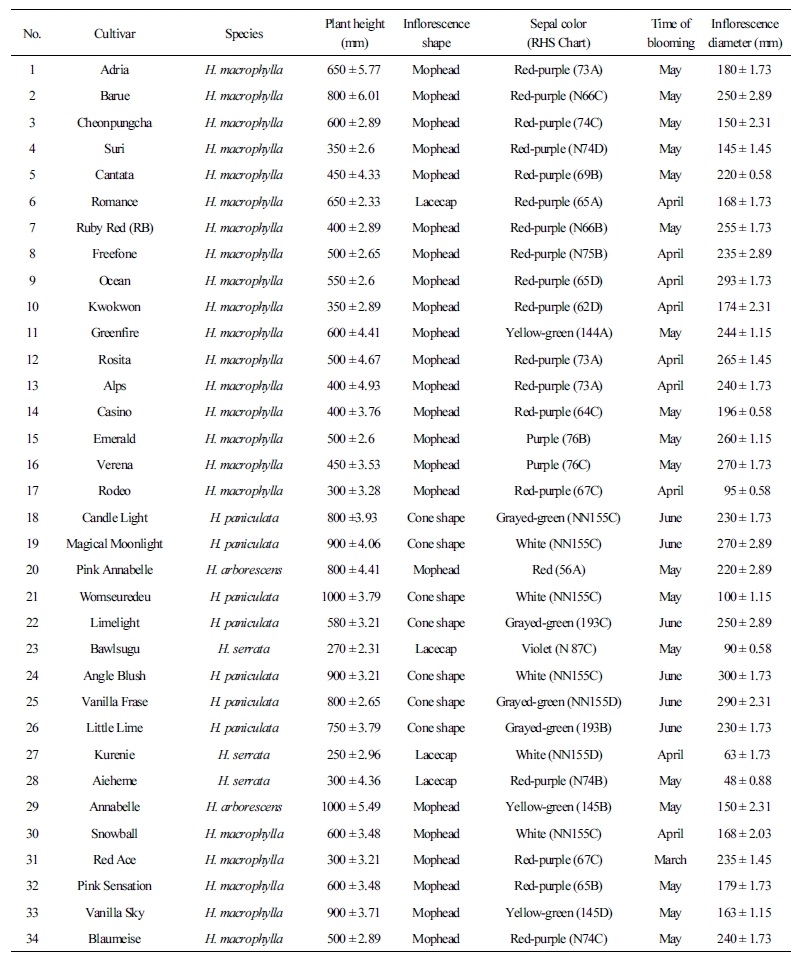
Morphological characteristics, including plant height, inflorescence shape and diameter, and sepal color, were measured from three mature plants per cultivar grown in a greenhouse at Chonnam National University during the full blooming season of April to June, 2016 (Table 1). Flower color was determined visually with the aid of the Royal Horticultural Society (RHS) Color Chart.
Table 1. List of Hydrangea cultivars evaluated by the random amplification of polymorphic DNA (RAPD) analysis and their morphological
characteristics
 |
Plant Materials and DNA Extraction
The samples for DNA extraction was collected from 34 accessions comprising 4 species of hydrangea. Genomic DNA was extracted from 0.1g of fresh leaf tissue using a Qiagen Plant Mini Kit (Qiagen, USA).
RAPD Analysis
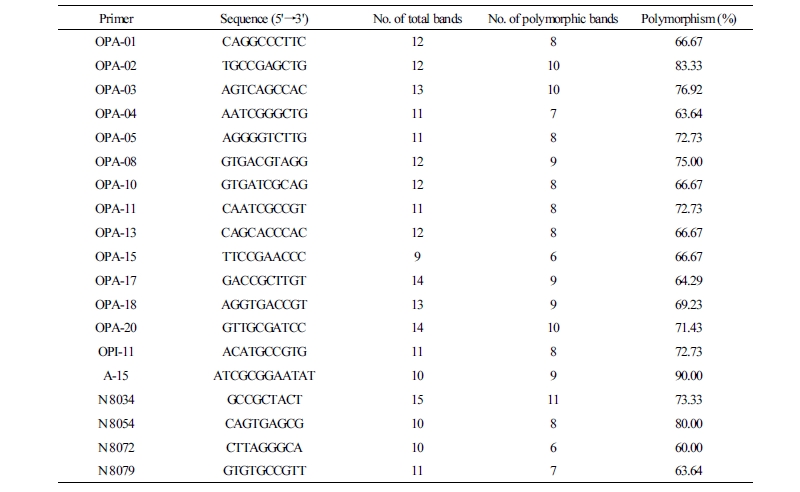
A total of 38 random 10-mer primers were used for polymerase chain reaction (PCR) (Table 2). PCR was carried out in a total reaction volume of 20 mL containing 10 × Taq buffer, 10 ng of genomic DNA, 10-mM deoxynucleotide triphosphates (dNTPs), 10-pM primers, and 1unit of Taq DNA polymerase (SolGent, South Korea).The DNA fragments were amplified with an initial denaturation of 3 min at 95°C, followed by 40 cycles of 30 s at 95°C, 1 min at 39°C and 2 min at 72°C, and a final extension of 5 min at 72°C. Electrophoresis was conducted for 1hr at 100 V using a 2% (w/v) agarose gel in 1xTris-acetate-EDTA (TAE) buffer with 5 µL of the PCR product from each sample.
Table 2. List of random amplification of polymorphic DNA (RAPD) primers used to detect polymorphisms
 |
Data Analysis
The DNA profiles were scored visually from gel photographs. The presence of a band was designated as (1) and, an absence was designated as (0). The data that were obtained from the RAPD scoring were subjected to the calculation of a similarity matrix using the Jaccard coefficients (Jaccard, 1901). The genetic distances between individual samples were calculated using allele sharing for the creation of a distance matrix (Jukes and Cantor, 1969). The dendogram was subjected to a clustering analysis using the unweighted pair group method with arithmetic mean (UPGMA) method to estimate the genetic distance and relatedness among the species in version 3.15 of the PAST (Paleonto Logical Statistics) program (Ryan et al., 1995). The statistical-support estimates for the resultant clusters were obtained from the UPGMA bootstrap analysis with 1,000 replications. The principal coordinate analysis (PCoA) was performed using PAST.
Results and Discussion
Morphological Characteristics
Morphological characterization of the collected germplasm was performed during the full blooming period to record plant height and flowers characteristics, which differed according to the species. Different growth habits, different flowering times, and various flower shapes and colors were found among the cultivars even under controlled environmental conditions (Table 1). The tallest plants belonged to H. paniculatas species, the shortest plants belonged to H. serrata, and most of the cultivars possessed mophead-type inflorescences. The cultivars that produced the lacecap-type inflorescences have large, imperfect flowers and deep-green foliage. Most of the accessions bloomed in May, and the late flowering time of H. Paniculata occurred in June. The biggest inflorescences were found in H. macrophylla, whereas the smallest inflorescences were observed in H. serrata accessions. The sepal color of H. macrophylla was in the red-purple group, but the other species occupied the white group, the violet group, or the grayed-green group (Table 1).
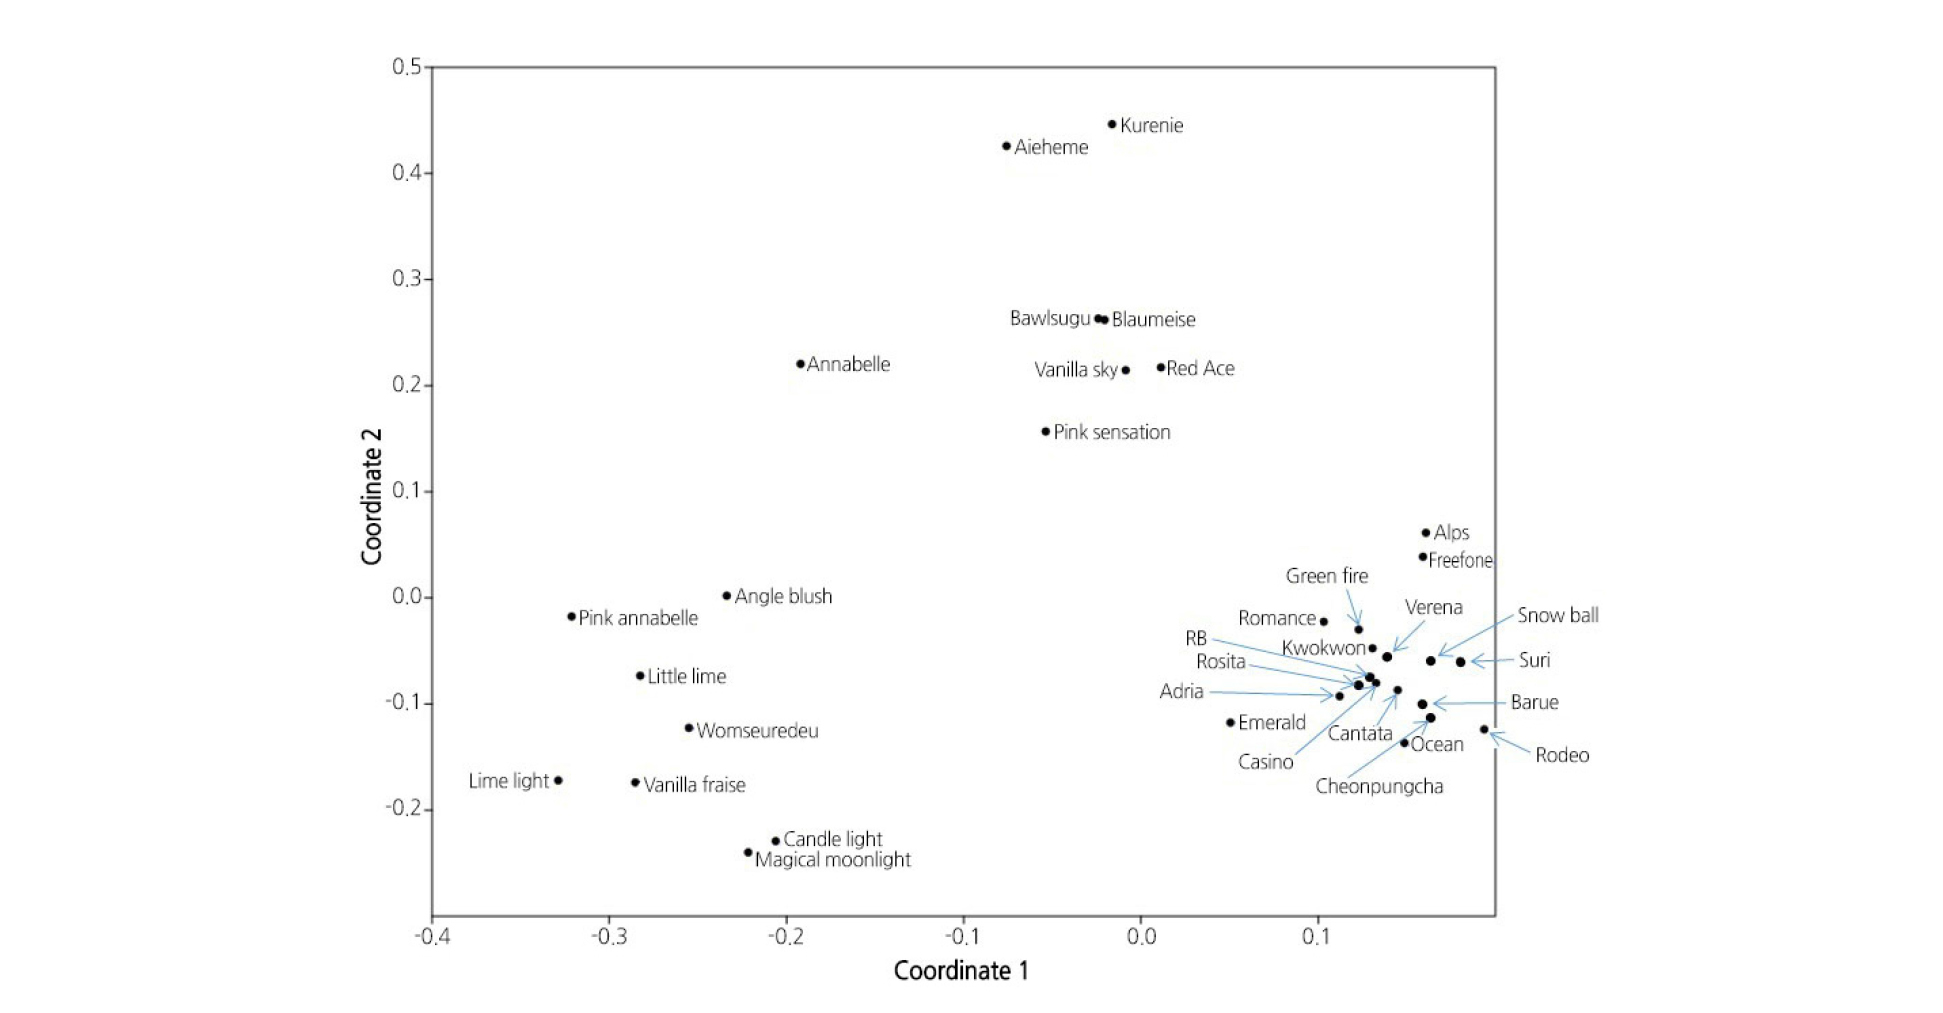
Principal Coordinate Analysis (PCoA)
PCoA was used to demonstrate the inter-cultivar genetic relationships and is based on the genetic frequencies of all of the samples. The PCoA results accounted for 31.43% of the total variation. The following four main demarcated clusters resulted: two groups containing H. macrophylla, one group of H. paniculata, and a final group containing H. serrata (Fig. 1). Hydrangea macrophylla was separated into two clusters, and one cluster was close to H. serrata. ‘Bawlsugu’ of H. serrata was clustered together with one of the H. macrophylla groups (Fig. 1). This cultivar may be a hybrid between H. macrophylla and H. serrata. The two cultivars of H. arborescens, ‘Annabella’ and ‘Pink Annabelle’ were separated and ‘Pink Annabelle’ clustered close to H. paniculata, suggesting that one of the parents of ‘Pink Annabelle’ descended from H. paniculata.
RAPD Analysis
The number of polymorphic bands that were produced varied from 6 to 11, depending upon the markers. Primer A 15 produced the most polymorphisms (90%), whereas primer N 8072 produced the least polymorphisms (60%). All primers produced above 60 % of polymorphisms (Table 2).
A total of 38 RAPD markers were used in all of the individuals, with only 19 of the markers being polymorphic; a total of 125 RAPD polymorphic bands were generated with the 19 markers. The size of the amplified DNA fragments ranged from 300 to 2,000 base pairs. The UPGMA dendogram indicates that all of the individuals were separated into four major groups, which agrees with their morphological classifications (Table 1 and Fig. 2). Based on the RAPD analysis, H. macrophylla samples were segregated into two groups with a similarity value of 0.6 (Fig. 2). The samples including ‘Blaumeise’, ‘Pink Sensation, ‘Red Ace’, and ‘Vanilla Sky’ occupied one small group with a high bootstrap support (81%). The large group of H. macrophylla was divided into six subgroups with high similarity value among these cultivars. In this species, the flowers of ‘Romance’ were incomplete and different within the same subgroup. The flowers of ‘Rosita’ and ‘Emerald’ were genetically similar to each other, but they were distantly related to the other subgroups. ‘Adria’ was classified into a separate group of this species and it is distantly related to the other cultivars.

Generally, the H. macrophylla cultivars showed high levels of genetic similarity compared with the other cultivars (Fig. 2). This might be because most of the H. macrophylla cultivars were developed using a small number of native and imported cultivars. H. paniculata occurred in one major group where in ‘Candlelight’ and ‘Magical Moonlight’ were in subgroups with a high bootstrap value (84%). ‘Womseuredeu’ separated into another subgroup. The growth habit and flower type of this cultivar is different from those of the other cultivars in the same species. H. serrata separated into a group consisting of the ‘Bawlsugu’, ‘Kurenie’, and ‘Aieheme’ with a high bootstrap support (93%). A group consisting of ‘Annabelle’ and ‘Pink Annabelle’ indicated that H. arborescens with a similarity value of 0.45. The dendrogram suggested that H. macrophylla and H. serrata are genetically similar with a similarity value of 0.5. The chance of a successful hybridization within these species may be greater than more distantly related species. For example, ‘Aieheme’ and ‘Kurenie’ were classified as H. serrata and which can be crossed successfully with the H. macrophylla group for interspecific hybridization. In H. macrophylla, intraspecific hybridization among the same subgroup could be easier than crossing among the different subgroups because of the high genetic similarity within a subgroup. In addition, there are many subgroups, particularly in H. macrophylla that may have different plant types and inflorescence forms.
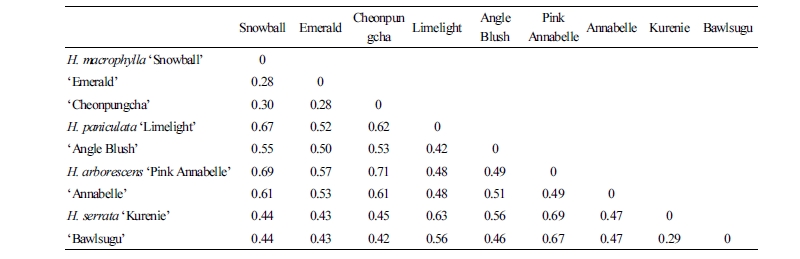
Genetic Distance
The genetic-distance measurements for each cultivar ranged from 0.28 to 0.71 (Table 3), and it seems that the genetic diversity among the tested cultivars is greatly different. The genetic distances between the same species of ‘Snowball’, and ‘Cheonpungcha’ with ‘Emerald’ were 0.28. But the genetic distance between different species such as ‘Pink Annabelle’ and ‘Cheonpungcha’ was 0.71, suggesting a significant genetic divergence between them. The results of the DNA analysis indicated that genetic distance within the same species especially H. macrophylla, where the genetic distance is very low compared with those of the other species, due to long term breeding with a limited gene pool. Hybridization between the accessions with lower genetic distances will be more successful than hybridization between the accessions with greater genetic distances. In this study, ‘Emerald’ should be crossed with ‘Snow ball’ as opposed to ‘Cheonpungcha’ for intraspecific hybridization. And also interspecific hybridization of ‘Snow ball’ with ‘Angle blush’ may be more achievable than ‘Lime light’ because of the low genetic distance between them.
There are two interpretations of the taxonomic positions of H. macrophylla and H. serrate. One interpretation is that these taxa should be treated as different species (Haworth-Booth, 1984; Ohba, 2001; Wilson, 1923; Zonneveld, 2004). The other is that H. serrata var. serrata should be categorized as a subspecies of macrophylla (Makino, 1929; McClintock, 1957; Reed and Rinehart, 2007; Rinehart et al., 2006). The results of this study revealed the division of H. macrophylla and H. serrata into two different groups; however, the genetic distance between these two species is shorter when compared with other species (Fig. 1 and Table 3). In plant breeding, wide hybridization between the different species is a productive method where the offspring possesses the best features of both parents. The results presented in this study are valuable to hydrangea breeding programs and, the cultivars studied here could be selected for hybridization and more wide hybrids are expected to be released.
In conclusion, we performed an evaluation of the genetic relationships among the Hydrangea species using RAPD markers. However, more cultivars and further morphological studies, as well as an analysis with more genomic information, are needed to confirm the morphology and the genetic diversity of this species. This study provided useful information for the verification of intraspecific hybrids, interspecific hybrids, and germplasm conservation in terms of hydrangea breeding to develop new and improved forms of the Hydrangea cultivars.