

Introduction
Materials and Methods
Plant material and cultivation system
Experimental design and light treatments
Growth measurements
Extraction and HPLC analysis of justicidin A and B
Plant growth analysis
Statistical analysis
Results
Environmental characteristics under different light conditions
Growth responses under different light conditions
Changes in justicidin A and B contents
Relationship between DLI and DW
Relationship between DLI and justicidin contents
Discussion
Extended photoperiod and high-light intensity promote growth
DLI Is a reliable predictor of biomass accumulation
High light levels maximize total justicidin production despite lower concentrations
Differential light responses between justicidin A and B
EEUE determines economic viability
Introduction
The growing interest in health management given our modern society has enhanced the demand for functional foods and nutraceuticals derived from natural sources, driving sustained growths in the domestic functional food market. Within this expanding market, medicinal plants containing bioactive compounds have garnered increasing attention as valuable sources for the development of functional foods.
Justicia procumbens L. (Acanthaceae) is an annual herb that has attracted scientific interest due to its unique bioactive profile, particularly its arylnaphthalene lignans (ANLs), such as justicidin A and B (Corrêa and Alcântara 2012). These compounds were found to possess significant pharmacological activities, including anticancer, antiviral, and anti-inflammatory effects (Fukamiya and Lee 1986; Asano et al. 1996; Chen et al. 1996). A pharmaceutical composition derived from an extract of this herb has since been patented for the prevention or treatment of respiratory diseases (Yoon et al. 2019). Despite the high contents of functional compounds and its potential value as a raw material for functional foods, the commercial application of J. procumbens faces considerable challenges. The primary limitations include an unstable supply of raw materials and inconsistent bioactive compound levels, which arise from variability in its cultivation conditions and environmental factors (Nafees et al. 2020).
Traditional open-field culturing of medicinal plants is subject to remarkable variations in productivity and phytochemical contents due to unpredictable climatic conditions, soil heterogeneity, and insufficient light. These factors lead to inconsistencies with regard to the quality and composition of the harvested raw materials, limiting their suitability for industrial applications requiring standardized ingredients. Vertical farming systems offer a promising alternative approach to address these challenges by enabling precise control of crucial environmental parameters, including the light quality and intensity, photoperiod, temperature, and humidity. Through such optimization efforts, vertical farms can facilitate stable year-round productivity and maximize target bioactive accumulation while maintaining product quality.
Light conditions, particularly the photoperiod and photosynthetic photon flux density (PPFD), are critical environmental factors that influence plant growth and secondary metabolite biosynthesis. Studies of functional crops have demonstrated that the manipulation of light-associated parameters can remarkably enhance the production of bioactive substances. The intensity of light and the photoperiod substantially affected the growth characteristics and functional compound contents of Agastache rugosa when grown in a vertical farming system (Kim et al. 2017; Yeo et al. 2021; Hwang et al. 2022). Similarly, for lettuce (Lactuca sativa) and basil (Ocimum basilicum) as well as perilla (Perilla frutescens) when grown in a closed-type plant factory system, specific combinations of blue and red light wavelengths promote photosynthetic efficiency and the aggregation of phenolic compounds and flavonoids (Huché-Thélier et al. 2016; Li and Kubota 2009; Sul et al. 2022).
ANLs, the primary bioactive substances of J. procumbens, are phenylpropanoid-derived secondary metabolites predominant in the Justicia, Phyllanthus, Haplophyllum, and Linum genera (Nedelcheva et al. 2024). These compounds are synthesized through the phenylpropanoid pathway, utilizing phenylalanine and tyrosine as precursors, followed by condensation and cyclization that reproduce the characteristic naphthalene structure (Weng et al. 2004). Their biosynthesis and accumulation are influenced by various environmental factors, particularly the quality and intensity of light, which play crucial roles in the activation of this pathway. UV-B radiation and specific spectra significantly enhance ANL contents, while appropriate temperatures promote the activity of biosynthetic enzymes (Weng et al. 2004; Jin et al. 2014). Furthermore, both abiotic stress factors (e.g., drought) and biotic stress factors (e.g., pathogen infection) can activate defense mechanisms that elevate ANL accumulation, and the growth stage and environmental conditions have similarly been shown to alter the secondary metabolite composition in other medicinal plant species (Pariyani et al. 2020). Despite the recognized relevance of environmental control in medicinal plant cultivation, systematic studies examining the impacts of the photoperiod and light intensity on J. procumbens growth and ANL production in controlled-environment agriculture systems remain limited. Understanding light conditions that are optimal for J. procumbens cultivation is essential for establishing stable production systems that can supply consistent, high-quality raw materials for the functional food and pharmaceutical industries.
Therefore, this study aimed to evaluate the effects of a range of photoperiods and PPFD combinations on the growth characteristics, biomass production, and justicidin A and B contents of J. procumbens cultivated in a vertical farm with a recirculating deep flow technique (DFT) system. The specific objectives were firstly to identify the photoperiod and PPFD combination that maximizes growth and bioactive production among the levels tested, secondly to analyze the relationship between daily light integral (DLI) and biomass accumulation, thirdly to evaluate light use efficiency (LUE) and electrical energy use efficiency (EEUE) under different light treatments, and finally to provide fundamental data for designing light environments optimal for the large-scale production of J. procumbens in vertical farming systems. Ultimately, this study aimed to establish standardized cultivation protocols for medicinal plants via controlled-environment agriculture and support the development of sustainable production systems for functional food ingredients.
Materials and Methods
Plant material and cultivation system
The experiment was conducted in a vertical farming facility at the Wooree Green Science Co., Ltd. (Ansan, South Korea) from July 18 to October 19, 2022, for a total cultivation duration of 13 weeks. Seeds of Justicia procumbens L. were collected from a farm in Jecheon, Chungcheongbuk-do, South Korea, in 2017, with species identity confirmed via the National Species Knowledge Information System (NIBR 2023), and stored until use. Seeds were sown on July 18, 2022, and seedlings were raised for 59 days. During this nursery period, seedlings were grown under a 16-h photoperiod (16 h light/8 h dark) with a red:green:blue LED ratio of 2:1:1, a PPFD of 200 µmol·m‒2·s‒1, and temperature and relative humidity set points maintained at 24°C and 70%, respectively. On September 15, 2022, the seedlings were transplanted into a recirculating DFT hydroponic system at a density of 42 plants·m‒2. The environmental setpoints in the vertical farm were maintained at 24°C and 70% relative humidity over the experimental period, whereas the corresponding measured means recorded during cultivation are reported in the Results (see “Environmental Characteristics under Different Light Conditions”). Hoagland nutrient solution was supplied with electrical conductivity adjusted to 1.5 dS·m‒1 and the pH maintained at 6.0. The light source consisted of 45-W LED bars designed for plant cultivation (WOOREE Enterprise Co., Ltd., Ansan, South Korea), with a spectral composition of red (660 nm), green (530 nm), and blue (447 nm) at a photon-based ratio of 2:1:1, as measured with a PG200N spectroradiometer (UPRtek, Zhunan, Taiwan).
Experimental design and light treatments
Light treatments were applied starting immediately after transplantation into the DFT hydroponic system on September 15, 2022. Based on the photoperiod and PPFD, five light treatment combinations were established. For the 14-h photoperiod (14 h light/10 h dark), two PPFD levels were tested: 200 (D14L200) and 300 µmol·m‒2·s‒1 (D14L300). For the 16-h photoperiod (16 h light/8 h dark), three PPFD levels were applied: 200 (D16L200), 300 (D16L300), and 375 µmol·m‒2·s‒1 (D16L375). PPFD values at the canopy level were measured with a PG200N spectroradiometer (UPRtek, Zhunan, Taiwan).
Growth measurements
Plant growth characteristics were evaluated weekly by harvesting five plants randomly sampled from each treatment plot at each sampling date (n = 5 subsamples per treatment plot). Plant height (PH) was measured from the substrate surface to the apical meristem using a ruler. Plant width (PW), representing the maximum horizontal spread, including leaves, was ascertained to assess spatial growth and the canopy architecture. Fresh weight (FW) was instantaneously quantified with an EW220-3NM electronic balance (Kern & Sohn GmbH, Balingen, Germany). To determine the dry weight (DW), harvested samples were dried in a KED-066A forced-air oven (Kiturami Co., LTD., Seoul, South Korea) at 50°C for 72 h and then weighed at room temperature. This relatively low drying temperature and extended duration were selected to ensure complete moisture removal while minimizing potential thermal degradation of phenolic compounds such as lignans, which are reportedly susceptible to heat-induced degradation during the drying of plant materials (ElGamal et al. 2023).
Extraction and HPLC analysis of justicidin A and B
JA and JB were extracted and quantified using modified methods from earlier studies and patents (Dongwha Pharm. Co., Ltd.; Korean Patent Application No. 10-2016-0044807; WO2017179931A1, 2017). The chemical structures of JA and JB were confirmed based on previously reported NMR spectral data (Yang et al. 2006). For the JA and JB content analysis, aerial parts from five plants per treatment were pooled and homogenized into a single composite sample at each sampling date. Dried aerial parts of J. procumbens were powdered, and 50 mg was mixed with 50 mL of 95% ethanol. The mixture was ultrasonically extracted for 20 min, after which it was centrifuged at 3,000 rpm for 5 min. The supernatant was collected through filtration, and the residue was re-extracted with an additional 40 mL of ethanol via ultrasonic extraction for ten minutes, followed by centrifugation and filtration employing the same procedures. All filtrates were combined and transferred to a 100 mL volumetric flask and then passed through a 0.45-µm syringe filter. An HPLC analysis was conducted on an Agilent 1200 series system (Agilent Technologies, Santa Clara, CA, USA) equipped with a Capcell Pak UG120 C18 column (4.6 × 250 mm, 5 µm; Shiseido, Tokyo, Japan), with the column temperature maintained at 35°C. The mobile phase consisted of (A) acetonitrile and (B) water at a flow rate of 0.8 mL/min, with gradient elution as follows: 0 min, 15% A; 40 min, 46% A; 60 min, 55% A; 70 min, 60% A (v/v). Detection was performed at 256 nm, and the injection volume was 10 µL. The pooled sample was extracted and analyzed in triplicate (n = 3 technical replicates), and quantification was based on external standard calibration curves, with the mean value used to represent each treatment.
Plant growth analysis
The growth dynamics of J. procumbens were analyzed based on the crop growth rate (CGR, g·m‒2·d‒1, Eq. 1) and relative growth rate (RGR, g·g‒1·d‒1, Eq. 2), which represent the rate of increase in plant biomass per unit time and per unit of existing biomass, respectively. Growth patterns were modeled with the exponential linear function proposed by Goudriaan and Monteith (1990) (Eq. 3):
where W represents shoot FW (g·m‒2) or shoot DW (g·m‒2) per unit area, Cₘ is the crop growth rate (g·m‒2·d‒1), Rₘ is the relative growth rate (g·g‒1·d‒1), and "t" denotes days after transplanting. Model coefficients were estimated using SPSS software (IBM Corp., Armonk, NY, USA) based on growth data. CGR and RGR (Eq. 1 and Eq. 2) represent interval-specific growth rates calculated between consecutive sampling dates and were used to characterize short-term growth dynamics, whereas the absolute growth rate (AGR) reported in the Results section and in Table 1 was derived from the slope of the fitted growth curve (Eq. 3) and represents the season-long average growth trend for each treatment. This metric was therefore adopted as the principal summary metric for comparing overall treatment performance outcomes. The fitted Cm, Rm, and tb coefficients of the Goudriaan–Monteith model (Eq. 3) for each treatment are provided in Table 2.
Table 1.
Total fresh weight (TFW), total dry weight (TDW) per unit area at 33 days after transplanting and coefficients of the linear relationship for the absolute growth rate (AGR) of Justicia procumbens L. cultivated under different light conditions in a vertical farm system
| Treatment | Biomass (mg·m-2) | AGRz (g·m-2·d-1) | R2 | P-value | |
| TFW | D14L200 | 1675.8 ± 625.3 c | 47.5 | 0.990 | <0.05 |
| D14L300 | 2310.0 ± 636.3 c | 62.7 | 0.986 | <0.05 | |
| D16L200 | 2696.4 ± 957.7 c | 104.7 | 0.992 | <0.05 | |
| D16L300 | 3910.2 ± 1119.7 b | 160.5 | 0.999 | <0.05 | |
| D16L375 | 5405.4 ± 2395.4 a | 197.8 | 0.995 | <0.05 | |
| TDW | D14L200 | 267.2 ± 15.0 c | 7.6 | 0.994 | <0.05 |
| D14L300 | 367.7 ± 14.1 c | 9.9 | 0.983 | <0.05 | |
| D16L200 | 399.4 ± 41.4 bc | 20.8 | 0.994 | <0.05 | |
| D16L300 | 555.6 ± 58.0 ab | 27.4 | 0.999 | <0.05 | |
| D16L375 | 728.9 ± 205.6 a | 25.3 | 0.997 | <0.05 |
Table 2.
Fitted coefficients (Cm, Rm, and tb) of the Goudriaan–Monteith growth model (Eq. 3) for shoot dry weight of Justicia procumbens L. cultivated under different light conditions in a vertical farm system
*Coefficients were fitted by nonlinear least-squares regression (Levenberg–Marquardt algorithm) of Eq. 3 to the mean shoot DW per unit area at 0, 5, 13, 19, 26, and 33 days after transplanting (n = 6 sampling dates per treatment); P-value indicates the significance of the fitted model relative to a constant-mean null model (F-test). For D14L200 and D14L300, as growth over the observed period did not show a clear early lag phase distinguishable from linear growth, Rm and tb are weakly identified for these two treatments (multiple parameter combinations fit nearly equally well); Cm for these treatments should be interpreted as closely approximating a constant (linear) growth rate rather than a true asymptotic maximum. W = shoot dry weight (g·m-2); t = days after transplanting.
LUE was determined from a linear regression analysis between cumulative DLI and shoot DW per unit area, with the slope coefficient representing LUE (Eq.4). Cumulative DLI was calculated based on PPFD measurements obtained using a PG200N spectroradiometer (UPRtek, Zhunan, Taiwan). EEUE was similarly estimated from a linear regression analysis between cumulative electrical energy consumption (EC) per unit area and shoot DW per unit area (Eq. 5). Energy consumption was calculated based solely on the power usage of the 45-W LED bars (WOOREE Enterprise Co., Ltd., Ansan, South Korea) used in the vertical farm. It does not include electricity consumed by other facility systems such as heating, ventilation, and air-conditioning (HVAC), water pumps, or environmental control equipment; therefore, the EEUE reported in this study represents lighting-specific, not whole-system, energy use efficiency.
Statistical analysis
The statistical analysis in this study was performed using the IBM SPSS software (IBM Corp., Armonk, NY, USA). Analysis of variance determined significant differences among treatments, and mean variations were assessed using Duncan’s multiple range test at a 5% significance level. For LUE and electrical energy use efficiency (EEUE) analyses, linear regression was utilized with cumulative light or energy and DW as the independent and dependent variables, respectively. The significance of the regression coefficients, representing the impacts of light conditions and energy consumption on crop growth across treatments, was tested using Student’s t-test at a 5% significance level.
Results
Environmental characteristics under different light conditions
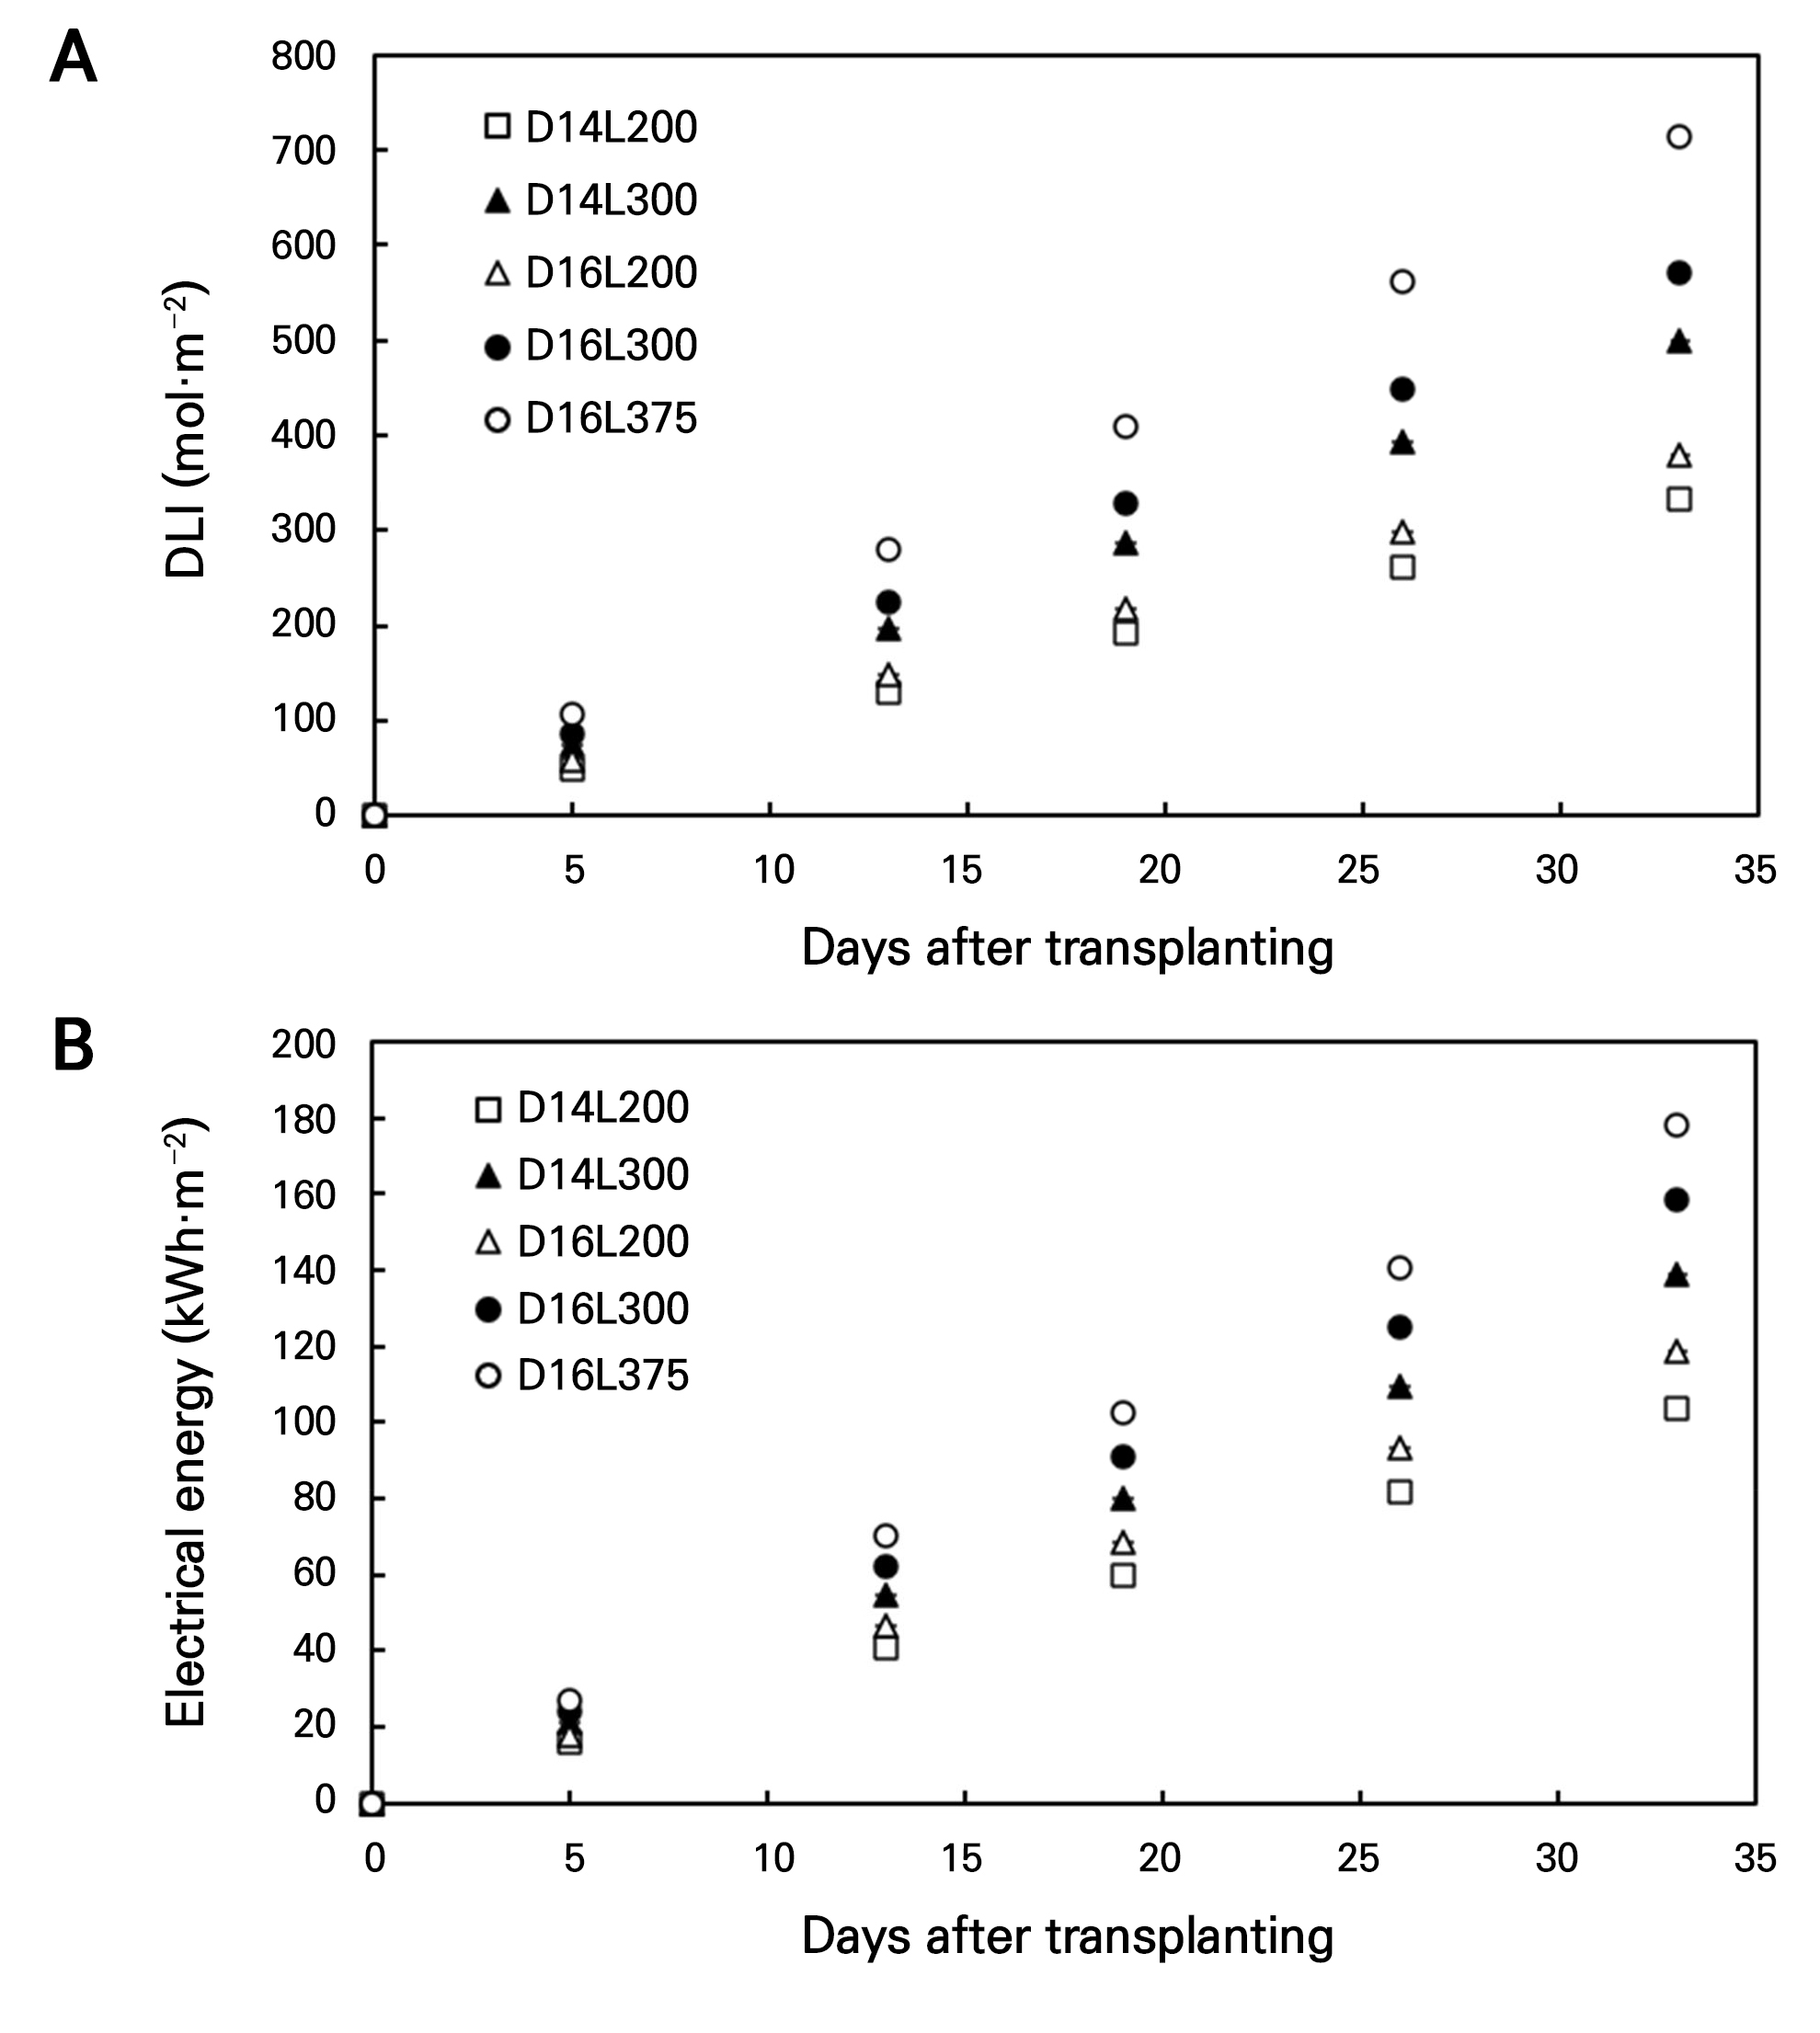
The average measured temperature and relative humidity were 22.7°C ± 0.2°C and 63.5% ± 4.8%, slightly below the corresponding environmental setpoints (24°C and 70% RH) specified in the Methods section, throughout the cultivation period. DLI varied according to the photoperiod and photosynthetic photon flux density, ranging from 10.08 to 21.60 mol·m‒2·d‒1 in the D14L200 and D16L375 treatments, respectively. The cumulative DLI over 33 days post-transplantation ranged from 332.64 to 712.80 mol·m‒2. Cumulative electrical energy consumption increased from 103.95 to 178.20 kWh·m‒2 with an increase in the photoperiod and PPFD (Fig. 1).
Growth responses under different light conditions
Growthin J. procumbens was also enhanced with an increase in the photoperiod and PPFD, with D16L375 showing the greatest growth (Fig. 2). At 33 days after transplanting, PH was greatest with D16L375 at 35.6 ± 5.9 cm but were significantly lower at 20.1 ± 2.6 and 17.6 ± 2.6 cm with the D14L200 and D14L300 treatments, respectively (p < 0.05) (Fig. 2). Linear regression revealed D16L375 as inducing the maximum PH growth rate of 0.79 cm·d‒1 (R2 = 0.967), whereas D14L300 led to the lowest rate at 0.22 cm·d‒1 (R2 = 0.854). PW also reached its maximum with D16L375 at 25.3 ± 3.0 cm, with a growth rate of 0.43 cm·d‒1 (R2 = 0.970) (Fig. 2).
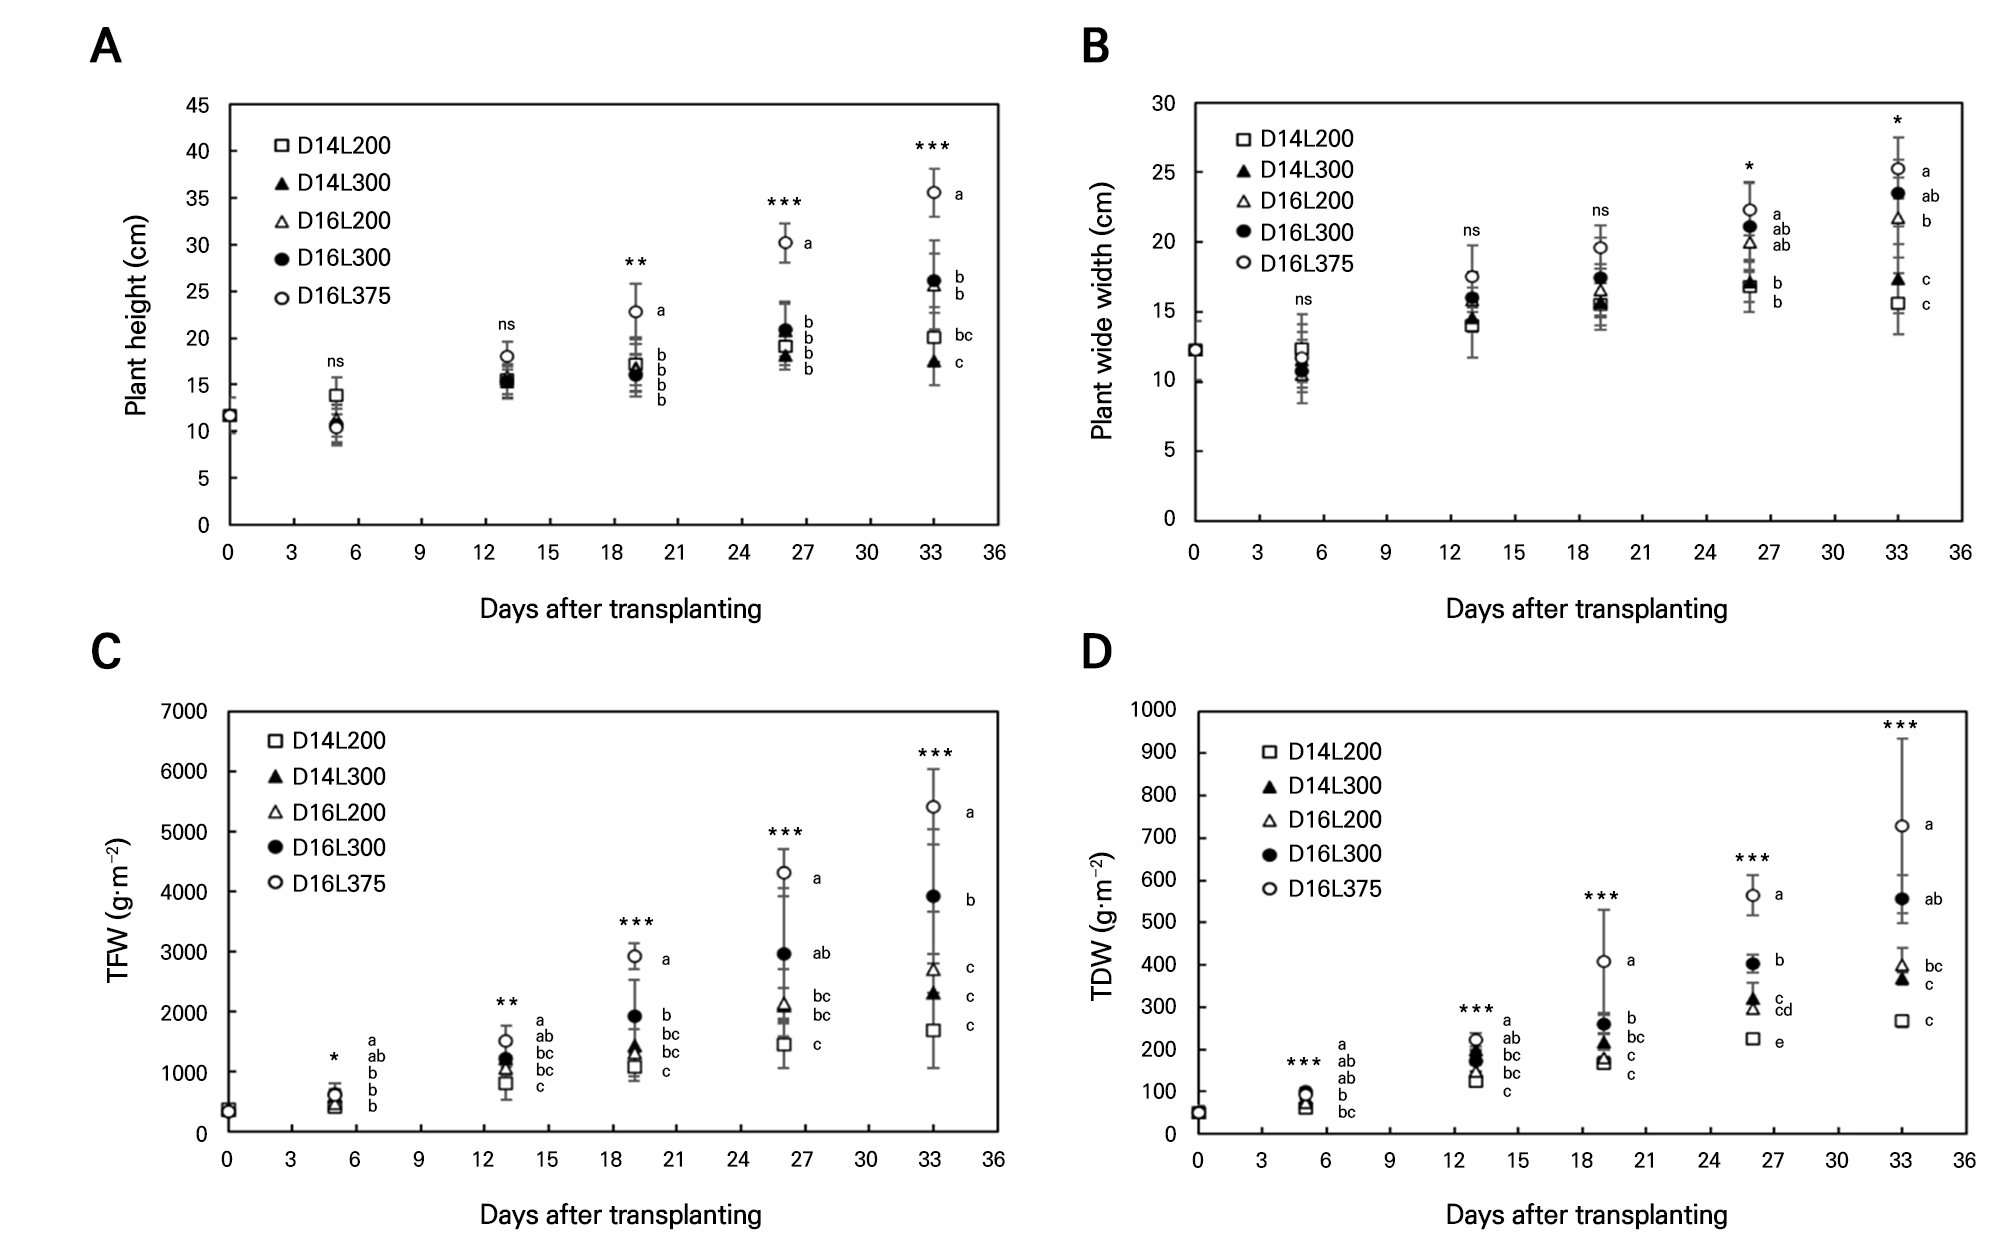
Fig. 2.
Changes in plant height (A), plant wide width (B), total fresh weight (TFW) per unit area (C) and total dry weight (TDW) per unit area (D) under different light conditions during cultivation of Justicia procumbens L. for 33 days after transplanting in a vertical farm system. Data are presented as the means ± SD. Different letters above data points at the same time point indicate significant differences among treatments (p < 0.05, ANOVA, DMRT). ns, *, **, and *** represent not significantly different or significantly different at p < 0.05, p < 0.01, and p < 0.001, respectively.
Total FW (TFW) per unit area reached its peak value with D16L375 at 5405.4 ± 2395.4 g·m‒2, which was approximately 3.2 times higher compared to D14L200 (1,675.8 ± 625.3 g·m‒2) (Fig. 2). The absolute growth rate (AGR) was 197.8 g·m‒2·d‒1 (R2 = 0.995) with D16L375, exhibiting significant variations from all other treatments (p < 0.05). Total DW (TDW) was also highest with D16L375 at 728.9 ± 205.6 g·m‒2, 2–2.7 times greater relative to the D14 treatments (267.2 to 367.7 g·m‒2) (Fig. 2). The AGR outcome for DW with D16L375 was 25.3 g·m‒2·d‒1 (R2 = 0.997) (Table 1) Fitted coefficients (Cm, Rm, and tb) of the Goudriaan–Monteith growth model (Eq. 3) for each treatment are presented in Table 2. In contrast, the dry matter content (DMC) was inversely proportional to the photoperiod and PPFD. D14 maintained the maximal DMC at 15.9% ± 0.2%, whereas D16L375 produced a significantly lower DMC rate of 13.4% ± 0.5% (p < 0.05) (Table 3). D16 induced a continuous decline in DMC at rates of –0.05% to –0.08%·d‒1 over the cultivation period.
Table 3.
Dry matter content of plants at 33 days after transplanting and coefficient of the linear relationship dry matter content of plants according to days after transplanting of Justicia procumbens L. cultivated under different light conditions in a vertical farm system
Changes in justicidin A and B contents
The concentrations of justicidin A (JA) and B (JB) per gram of DW generally declined throughout the cultivation period (Fig. 3). At five days after transplanting, the JA content was highest under D14L300 at 3.83 ± 0.11 mg·g‒1 but decreased to 2.75 ± 0.43 mg·g‒1 at 33 days after transplanting. In contrast, D16L375-treated plants demonstrated the lowest JA levels, reducing from 2.21 ± 0.22 and 1.82 ± 0.13 mg·g‒1 at five and 33 days, respectively. The JB contents followed a similar pattern, ranging from 1.27 to 1.86 mg·g‒1 at five days and declining to 0.85–1.22 mg·g‒1 by 33 days after transplanting. However, the total justicidin content per plant and unit area was continuously enhanced (Fig. 4). With D16L375, the JA content per plant increased from 4.9 ± 1.4 mg/plant at five days to 32.3 ± 15.8 mg/plant at 33 days, representing a 559% increase, whereas JB increased from 14.0 ± 2.3 to 73.6 ± 22.0 mg/plant, respectively, representing a 425% enhancement. These rates of increased exceeded those of all other treatments. On a per unit area basis, D16L375 produced JA at 1.33 ± 0.39 and JB at 0.62 ± 0.17 g·m‒2. D16L300 gave comparable values, with JA at 1.36 ± 0.29 and JB at 0.61 ± 0.12 g·m‒2. In contrast, D14L200 produced JA only at 0.60 ± 0.04 and JB at 0.29 ± 0.02 g·m‒2, corresponding to only 45% and 47% of the D16L375 levels, respectively (reductions of 55% and 53%).
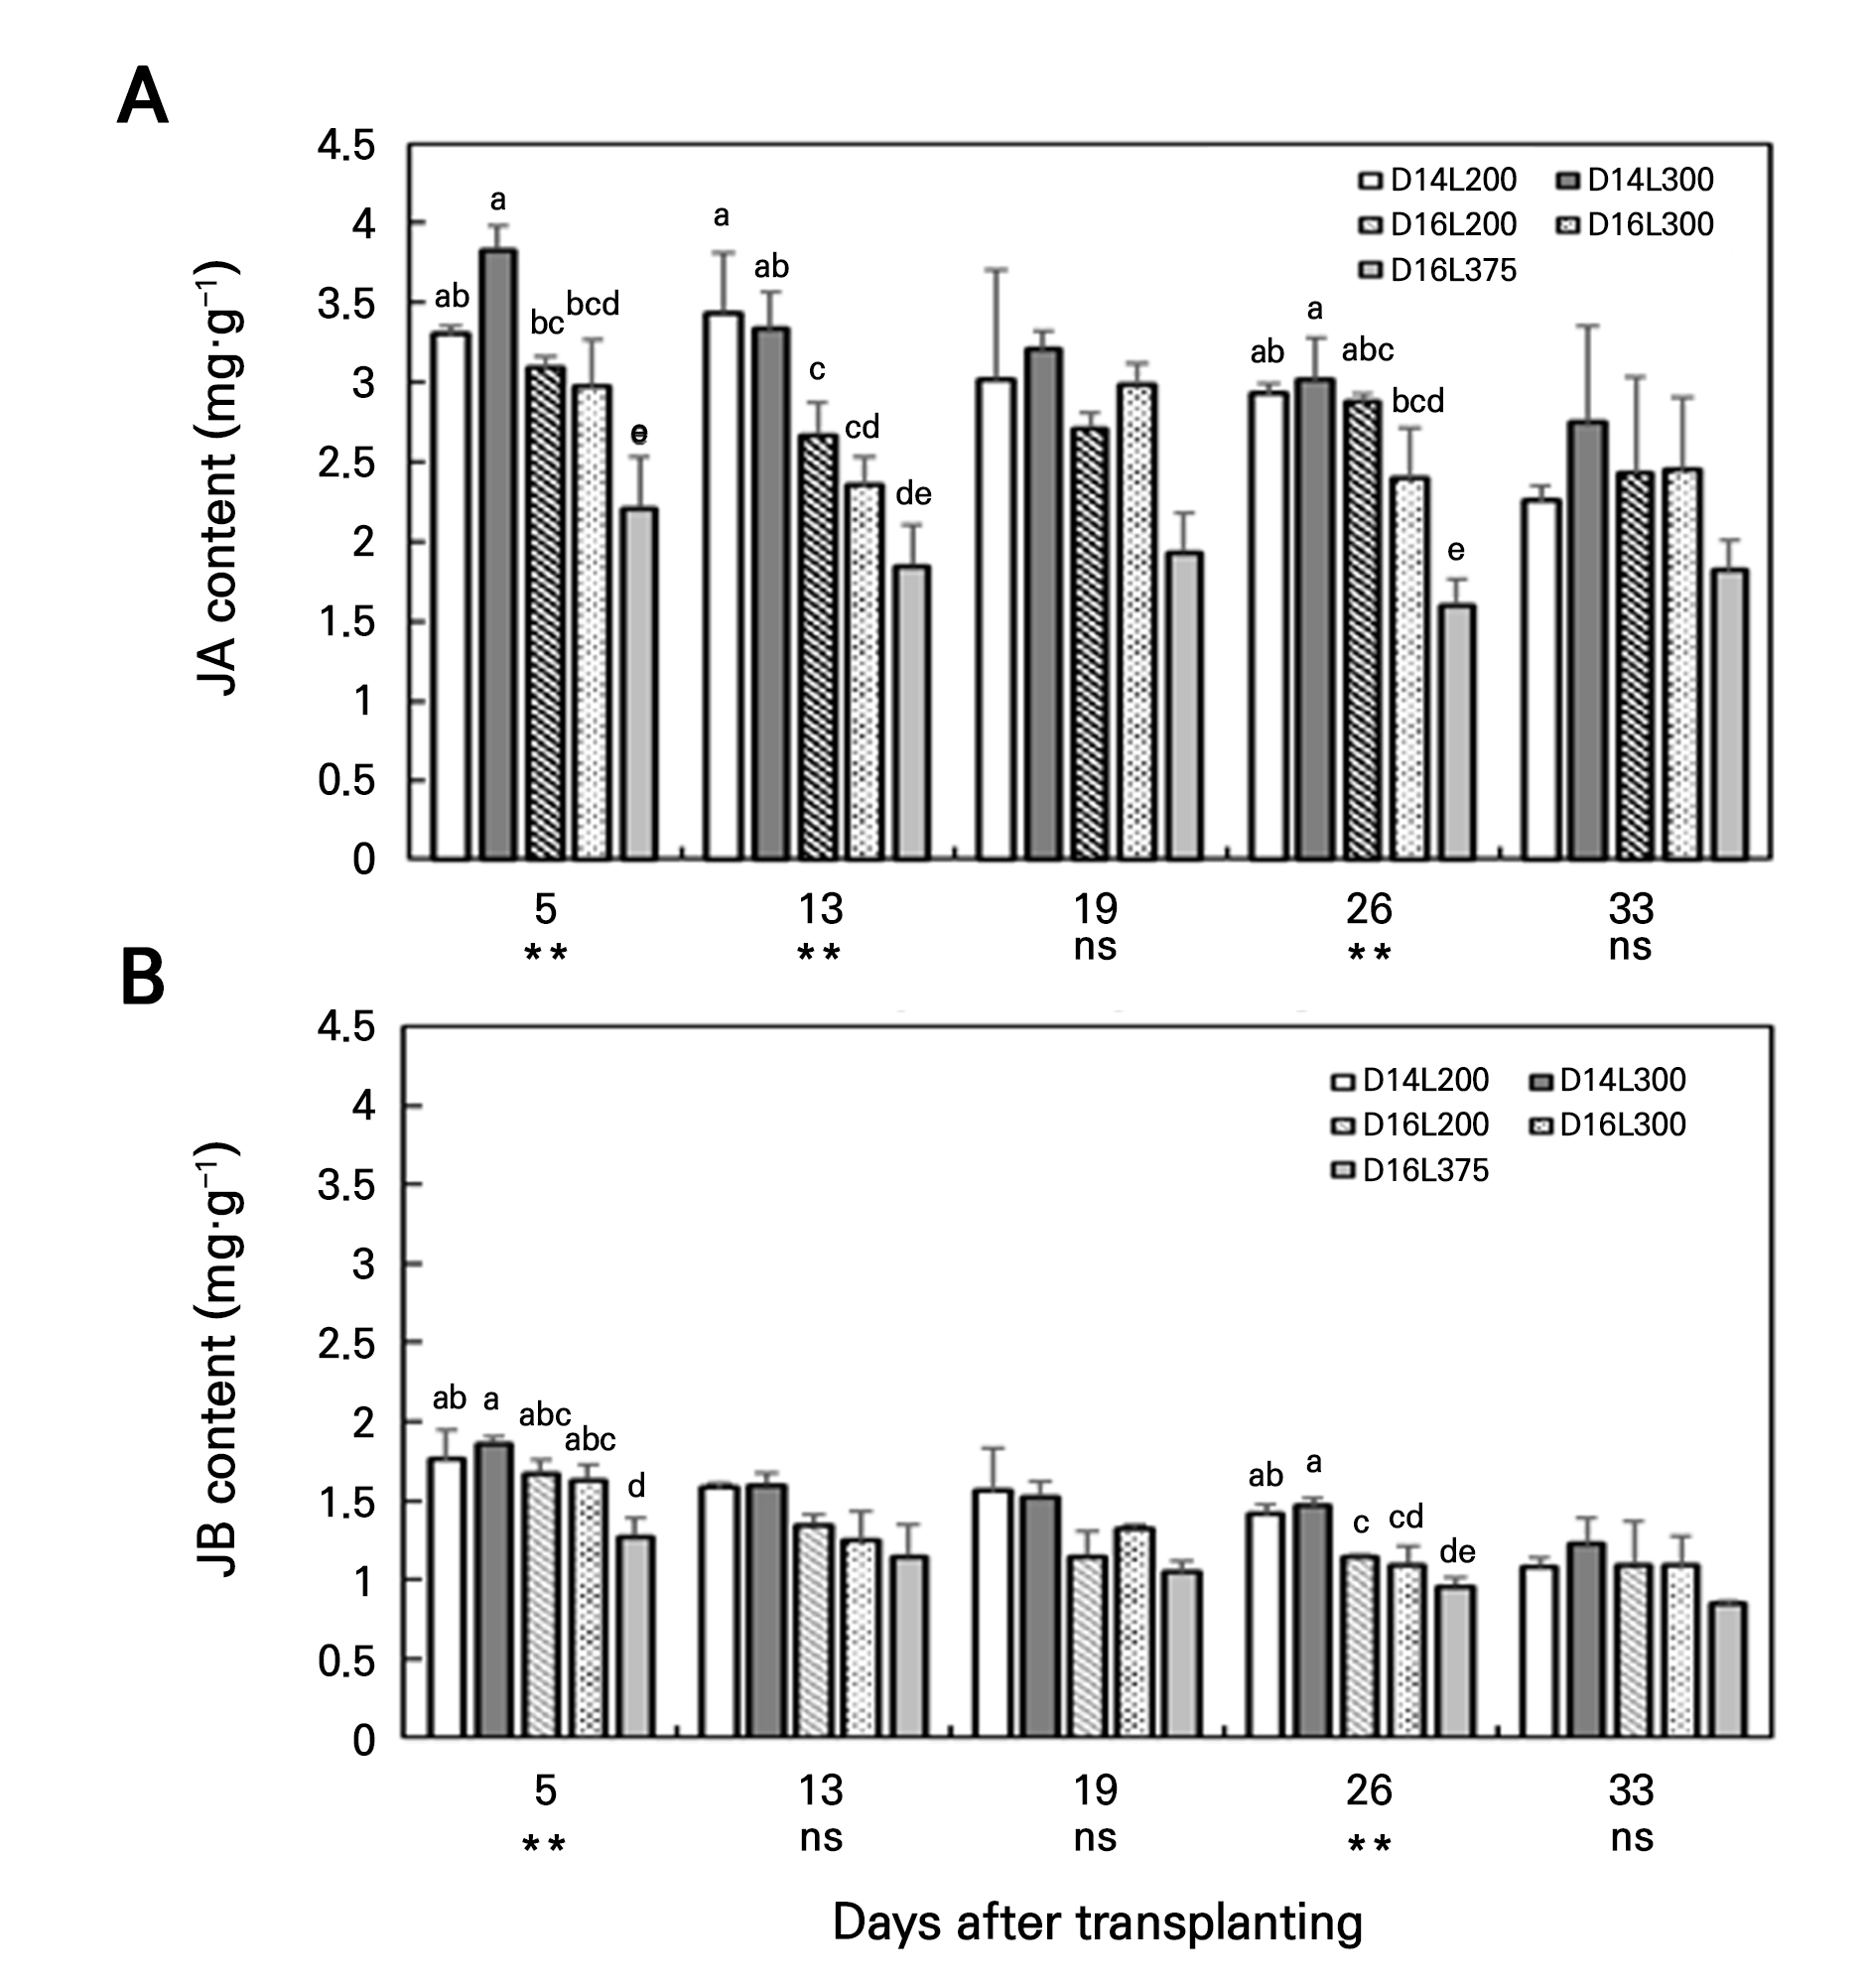
Fig. 3.
Changes in justicidin A (JA) and B (JB) contents per unit gram of Justicia procumbens L. grown under different light conditions during the cultivation period from 5 to 33 days after transplanting in a vertical farm system. Data are presented as the means ± SD. Different letters above data points at the same time point indicate significant differences among treatments (p < 0.05, ANOVA, DMRT). ns, *, **, and *** represent not significantly different or significantly different at p < 0.05, p < 0.01, and p < 0.001, respectively.
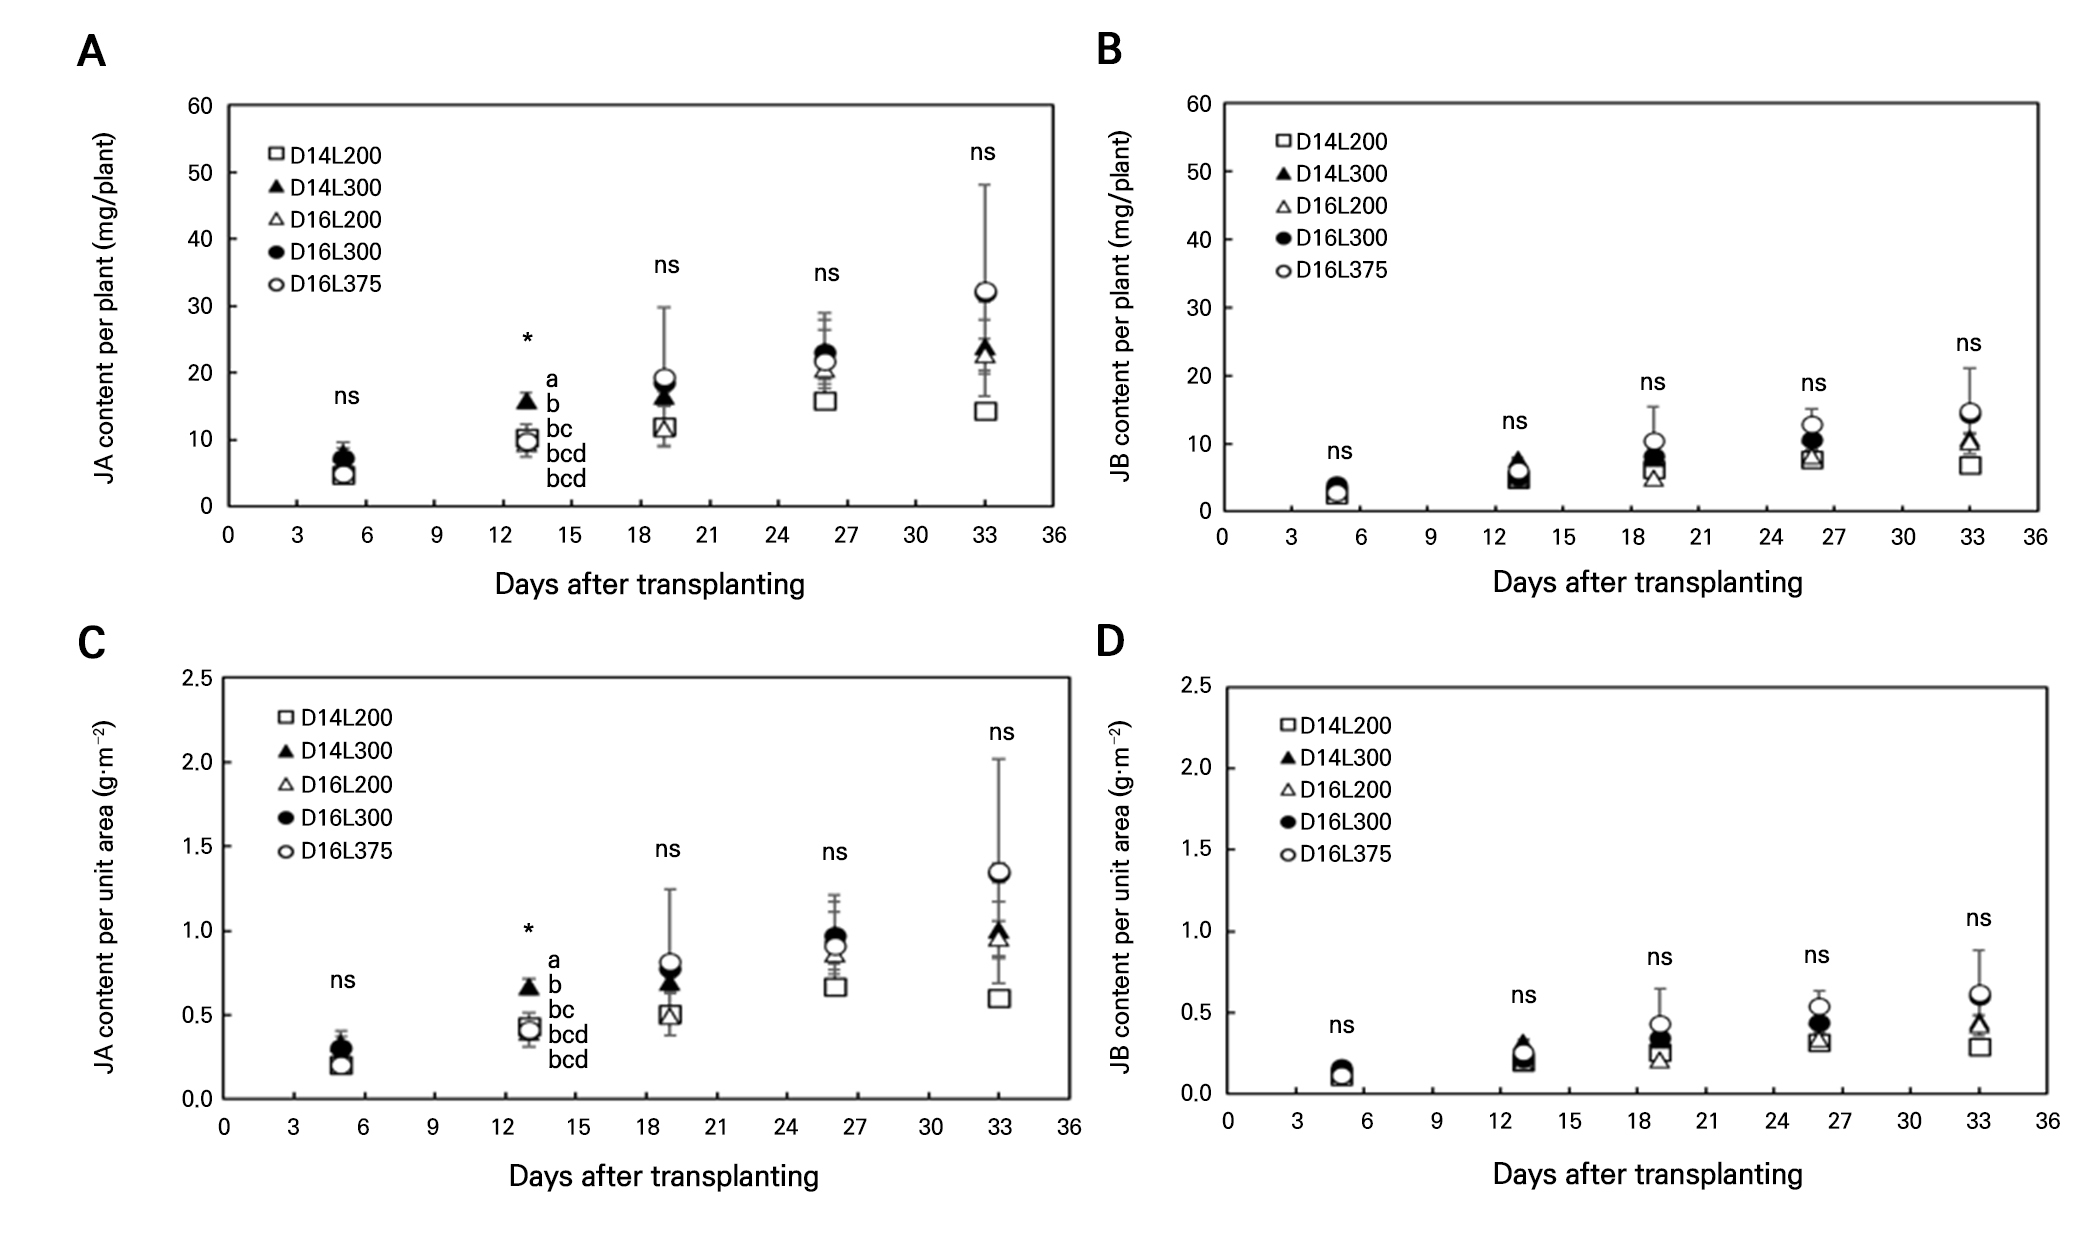
Fig. 4.
Changes in justicidin A (JA) and B (JB) content per plant (A and B) and per unit of area (C and D) under different light conditions during the cultivation period from 5 to 33 days after transplanting of Justicia procumbens L. in a vertical farm system. Data are presented as the means ± SD. Different letters above data points at the same time point indicate significant differences among the treatments (p < 0.05, ANOVA, DMRT). ns, *, **, and *** represent not significantly different or significantly different at p < 0.05, p < 0.01, and p < 0.001, respectively.
Relationship between DLI and DW
A linear regression between cumulative DLI and DW per unit area revealed robust positive correlations among all treatments (R2 > 0.8, p < 0.05) (Table 4 and Fig. 5). The regression slope coefficient was greatest with D16L375 at 1.085 g·mol‒1 and lowest under D14L300 at 0.660 g·mol‒1. The light required to produce 1 g of DW was lowest with D16L375 at 0.93 mol·g‒1 and highest under D14L300 at 1.52 mol·g‒1 (Table 4). EEUE showed similar trends, with D16L375 recording the highest efficiency at 4.323 g·kWh‒1 (R2 = 0.808, p < 0.05), whereas the D14 achieved only 2.369–2.378 g·kWh‒1 (Table 5).
Table 4.
Light use efficiency (LUE) of Justicia procumbens L. based on total dry weight (TDW) per unit area cultivated in a vertical farm system under different light treatment conditions for 33 days after transplanting
| Treatment | DLI (mol·g-1) | Constant (g·m-2) | LUEz (g·mol-1) | R2 | P-value |
| D14L200 | 1.35 | 25.953 | 0.740 | 0.988 | < 0.05 |
| D14L300 | 1.52 | 46.828 | 0.660 | 0.937 | < 0.05 |
| D16L200 | 0.99 | ‒2.461 | 1.010 | 0.942 | < 0.05 |
| D16L300 | 1.05 | ‒16.565 | 0.950 | 0.938 | < 0.05 |
| D16L375 | 0.93 | ‒44.636 | 1.085 | 0.808 | < 0.05 |
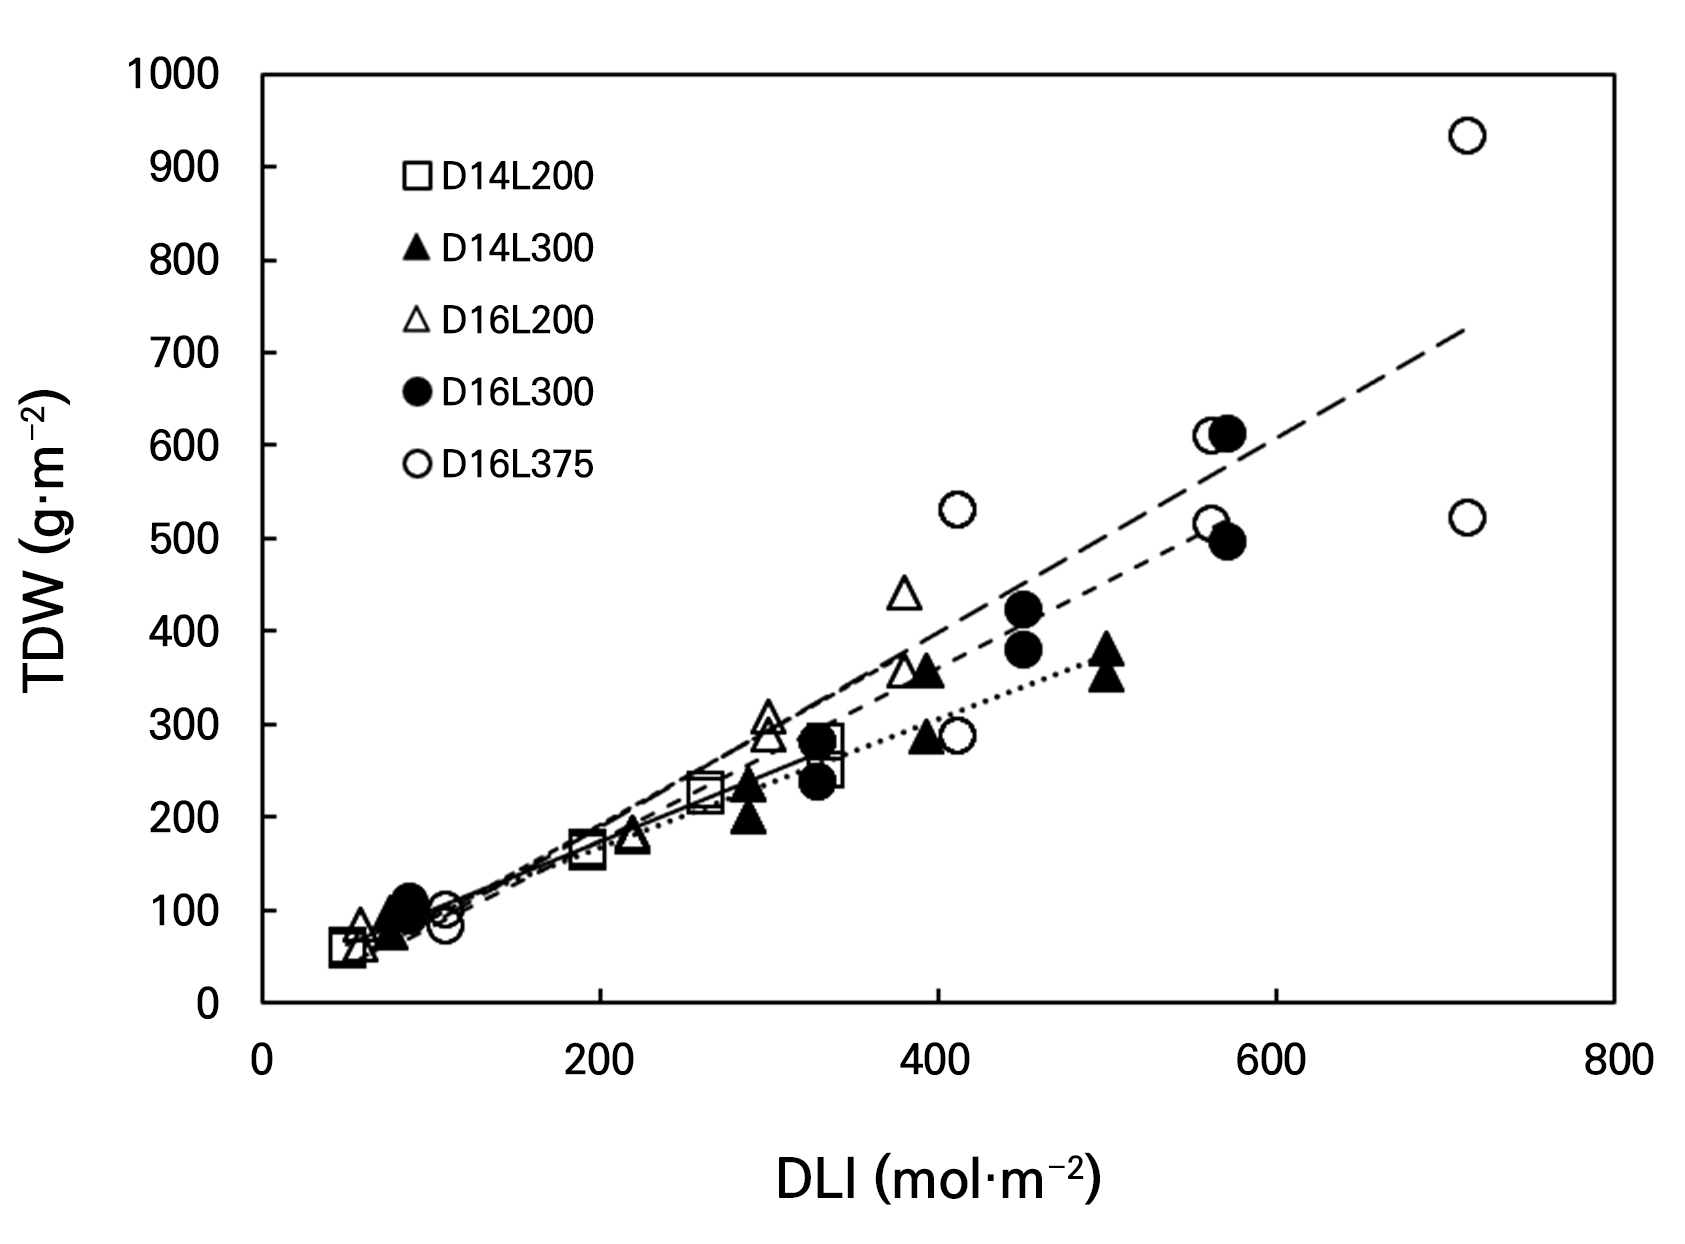
Table 5.
Electrical energy use efficiency (EEUE) of Justicia procumbens L. based on total dry weight (TDW) per unit area cultivated in a vertical farm system under different light treatment conditions for 33 days after transplanting
| Treatment | Electrical energy (kWh·g-1) | Constant (g·m-2) | EEUEz (g·kWh-1) | R2 | P-value |
| D14L200 | 0.42 | 25.953 | 2.369 | 0.988 | < 0.05 |
| D14L300 | 0.42 | 46.828 | 2.378 | 0.937 | < 0.05 |
| D16L200 | 0.31 | ‒2.461 | 3.224 | 0.942 | < 0.05 |
| D16L300 | 0.29 | ‒16.565 | 3.421 | 0.938 | < 0.05 |
| D16L375 | 0.23 | ‒44.636 | 4.323 | 0.808 | < 0.05 |
Relationship between DLI and justicidin contents
The correlations between DLI and the JA content per unit area showed varying patterns among the treatments (Table 6). D16L200 exhibited the highest JA production efficiency at 12.016 mg·mol‒1 (R2 = 0.935, p < 0.05), whereas D16L300 and D16L375 showed values of 10.983 and 9.348 mg·mol‒1, respectively. D14 demonstrated lower efficiency outcomes ranging from 7.515 to 8.000 mg·mol‒1. In contrast, JB biosynthesis was weakly associated with DLI (Table 6). Only D14L200 (R2 = 0.786, p < 0.05) and D16L375 (R2 = 0.610, p < 0.05) demonstrated statistically significant relationships, with the remaining treatments exhibiting weak correlations (R2 < 0.4, some p > 0.05).
Table 6.
Daily light integral (DLI) effects on justicidin A (JA) and B (JB) contents per unit area in Justicia procumbens L. cultivated in a vertical farm system under different light treatment conditions for 33 days after transplanting
| Compound | Treatment |
DLI (mol·g-1) |
Constant (mg·m-2) |
Co-efficiencyz (mg·mol-1) | R2 | P-value |
| Justicidin A (JA) | D14L200 | 133.1 | 946.8 | 7.515 | 0.783 | <0.05 |
| D14L300 | 125.0 | 1351.0 | 8.000 | 0.801 | <0.05 | |
| D16L200 | 83.2 | 270.3 | 12.016 | 0.935 | <0.05 | |
| D16L300 | 91.0 | 157.0 | 10.983 | 0.928 | <0.05 | |
| D16L375 | 107.0 | ‒177.4 | 9.348 | 0.677 | <0.05 | |
| Justicidin B (JB) | D14L200 | 285.4 | 497.5 | 3.504 | 0.786 | <0.05 |
| D14L300 | 1976.3 | 1005.6 | 0.506 | 0.059 | >0.05 | |
| D16L200 | 429.0 | 1062.9 | 2.331 | 0.252 | >0.05 | |
| D16L300 | 563.7 | 1531.7 | 1.774 | 0.388 | >0.05 | |
| D16L375 | 364.7 | 1247.3 | 2.742 | 0.610 | <0.05 |
EEUE for JA biosynthesis was maximal under D16L300 at 39.5 mg·kWh‒1 (R2 = 0.928, p < 0.05), followed by D16L200 and D16L375 at 38.5 and 37.4 mg·kWh‒1, respectively (Table 7). JA production efficiency with D14—24.0 to 28.8 mg·kWh‒1—was markedly lower than that under the D16 treatment. However, JB production efficiency was weakly correlated with most treatments, suggesting that environmental factors other than DLI have a greater impact on JB biosynthesis (Table 7).
Table 7.
Electrical energy use efficiency (EEUE) of Justicia procumbens L. based on justicidin A (JA) and B (JB) contents per unit area cultivated in a vertical farm system under different light treatment conditions for 33 days after transplanting
| Compound | Treatment |
Electrical energy (kWh·g-1) |
Constant (g·m-2) |
Co-efficiencyz (mg·mol-1) | R2 | P-value |
| Justicidin A (JA) | D14L200 | 41.6 | 946.8 | 24.0 | 0.783 | <0.05 |
| D14L300 | 34.7 | 1351.0 | 28.8 | 0.801 | <0.05 | |
| D16L200 | 26.0 | 270.3 | 38.5 | 0.935 | <0.05 | |
| D16L300 | 25.3 | 157.0 | 39.5 | 0.928 | <0.05 | |
| D16L375 | 26.7 | ‒177.4 | 37.4 | 0.677 | <0.05 | |
| Justicidin B (JB) | D14L200 | 89.2 | 497.5 | 11.2 | 0.786 | <0.05 |
| D14L300 | 548.5 | 1005.6 | 1.8 | 0.059 | >0.05 | |
| D16L200 | 134.0 | 1062.9 | 7.5 | 0.252 | >0.05 | |
| D16L300 | 156.6 | 1531.7 | 6.4 | 0.388 | >0.05 | |
| D16L375 | 91.2 | 1247.3 | 11.0 | 0.610 | <0.05 |
Discussion
Extended photoperiod and high-light intensity promote growth
J. procumbens plants subjected to the D16L375 treatment exhibited the highest values of all growth indicators, achieving a DW of 728.9 g·m‒2, approximately 2.7 times higher than that of D14L200 at 267.2 g·m‒2. Additionally, the photoperiod and PPFD in this case consistently enhanced the growth parameters. Therefore, it can be inferred that J. procumbens experienced superior biomass accumulation under conditions of an extended photoperiod and high light intensity, whereas growth was limited under short photoperiods. An extended photoperiod prolongs daily photosynthesis, increases carbon fixation, and promotes the accumulation of photosynthetic products for growth. Yeo et al. (2021) reported that a 16-h photoperiod markedly increased fresh and DWs compared to a 12-h photoperiod in A. rugosa, attributing this to the elevated accumulation of photosynthates. Hwang et al. (2022) also confirmed enhanced growth and greater levels of bioactive contents in A. rugosa under long-day conditions. Similarly, in this study, J. procumbens showed superior growth with an extended photoperiod, suggesting such an approach as an effective cultivation strategy for functional crops. Additionally, the D16 treatment maintained higher AGR levels from early to late growth stages, whereas D14 decreased or stagnated growth rates toward the late stage. This trend suggests that short photoperiods limit photosynthetic product accumulation and prevent full expression of the growth capacity across the cultivation period.
Increased PPFDs directly elevated DLI, thereby accelerating photosynthetic rates and promoting biomass accumulation. Under the 16-h-long photoperiod, DW was enhanced by nearly 1.8-fold as the PPFD was increased from 200 to 375 µmol·m‒2·s‒1. Li and Kubota (2009) reported a linear elevation in photosynthetic rates and biomass with an increase in PPFD during lettuce cultivation, consistent with our findings. However, the decline in DMC with an increase in DLI indicated that the water content was elevated due to rapid cell expansion under high levels of light. While this phenomenon may increase energy consumption during post-harvest drying, the remarkably greater absolute dry matter production per unit area makes it advantageous in terms of overall productivity.
DLI Is a reliable predictor of biomass accumulation
As DLI increased, DW per unit area was enhanced across all treatments, where strong linear correlations (R2 > 0.8, p < 0.05) were confirmed; D16L375 and D14L300 induced the maximal and lowest LUEs of 1.081 and 0.660 g·mol‒1, respectively. Although the optimal DLI is species-specific, a high DLI generally enhances biomass production during controlled-environment agriculture. The DLI–DW linear regression model established in this study can serve as a practical tool for predicting J. procumbens production in vertical farm systems. Goudriaan and Monteith (1990) presented a theoretical model showing that crop growth increases in proportion with cumulative light quantities. The LUE of 1.081 g·mol‒1 with D16L375 falls within the upper range of LUE values typical for leafy vegetables at 0.5–1.5 g·mol‒1 (Kang et al. 2016), indicating that J. procumbens can utilize light very efficiently in a vertical farm environment. With D16L375, the plants achieved maximum biomass production at the highest DLI, whereas production was lowest under D14L200 at the lowest DLI. Poor growth under non-optimal DLI conditions is primarily due to the insufficient accumulation of photosynthetic products.
The consistent increase in LUE when the photoperiod was extended from 14 to 16 h at the same PPFD (D14L200: 0.740 vs. D16L200: 1.010 g·mol‒1) is noteworthy. This finding suggests that prolonged light exposure improves photosynthetic efficiency beyond simply increasing the cumulative light quantity. Plant circadian rhythms are regulated by the photoperiod, which affects the expression of photosynthesis-associated genes and the activities of related enzymes. Under extended photoperiods, increases in the chlorophyll content, improved photosystem II efficiency, and enhanced carbon metabolism-related enzyme activity have been reported (Poorter et al. 2019). Therefore, maintaining DLI >20 mol·m‒2·d‒1 through prolonged photoperiods and an elevated PPFD is recommended to maximize productivity in J. procumbens in a vertical farming system.
It should be noted that the experimental design was not the full factorial type (D14L375 was not included), and no iso-DLI treatment pairs were established across photoperiods. Consequently, although the LUE comparison at a fixed PPFD (200 µmol·m‒2·s‒1) between 14- and 16-h photoperiods suggests a photoperiod-specific effect, the confounding effect between the photoperiod and DLI cannot be fully resolved with the present dataset. Future studies incorporating iso-DLI comparisons across photoperiods are needed to isolate the independent effects of the photoperiod from the cumulative light quantity. In addition, because each treatment was applied to a single lighting unit, the five plants sampled per treatment represent subsamples rather than independent replicates; treatment effects should therefore be interpreted with this design constraint in mind.
High light levels maximize total justicidin production despite lower concentrations
Justicidin A and B concentrations per gram of DW declined during the cultivation period, with lower levels observed particularly under high-light treatments. This pattern represents a typical growth–defense trade-off between growth and secondary metabolite production. Plants must allocate limited resources (carbon, nitrogen, and energy) between primary metabolism (growth) and secondary metabolism (defense compound production); they tend to allocate more resources to the former under optimal growth conditions (Herms and Mattson 1992; Hou and Xu 2025). Weng et al. (2004) reported that the phenylpropanoid pathway—through which ANL is biosynthesized—is activated under stress conditions. Jin et al. (2014) also found that UV-B and environmental stress increase ANL contents. Therefore, the higher justicidin concentration per unit DW observed with the D14 treatments, where light was relatively low and growth was limited, can be interpreted as part of this stress response mechanism.
However, despite the lower concentrations per unit DW, the two high-DLI treatments, D16L375 and D16L300, yielded the highest total justicidin production per unit area owing to their much greater biomass; D16L375 produced 2.2- and 2.1-fold more JA and JB than D14L200. From a commercial perspective, total production per unit area is more crucial than concentration per unit dry weight. Chen et al. (1996) and Asano et al. (1996) reported anticancer, antiviral, and anti-inflammatory activities of justicidin A and B, manifesting above certain dose levels. Therefore, securing sufficient quantities of raw materials by maximizing total production is essential for functional food or pharmaceutical applications.
Differential light responses between justicidin A and B
Interestingly, JA and JB showed different response patterns to varied light conditions. JA showed strong linear correlations with DLI (R2 = 0.677–0.935) across most treatments, whereas JB was weakly associated (R2 < 0.4, some p > 0.05) in most treatments, apart from D14L200 and D16L375. Additionally, D16 consistently enhanced JA production efficiency more than D14. Therefore, it can be inferred that JA biosynthesis is more responsive to the quantity of light, whereas JB production may be influenced by other environmental or physiological factors. According to Weng et al. (2004), ANLs are synthesized from phenylalanine and tyrosine through condensation, cyclization, and substitution, with specific enzymes required at each stage. Although JA and JB are structurally similar, variations in substituent positions and types suggest that enzymes catalyzing final reactions may differ and may be differentially expressed or regulated according to environmental conditions.
These results indicate that light optimization was most effective for JA production, as D16L200 induced the highest LUE for JA at 12.016 mg·mol‒1. Similarly, D16L300 showed the highest EEUE for JA production at 39.5 mg·kWh‒1. However, as JB was weakly correlated with light in most treatments, further studies investigating other environmental factors affecting JB biosynthesis are necessary. Accordingly, integrated cultivation strategies considering multiple environmental parameters may be needed to simultaneously maximize JA and JB production.
EEUE determines economic viability
As electrical energy consumption increased, DW production per unit area increased across all treatments. D16L375 produced an EEUE rate of 4.323 g·kWh‒1, approximately 1.8 times higher than D14 (2.369–2.378 g·kWh‒1). Although the cumulative power consumption with D16L375 (178.20 kWh·m‒2) was close to 71% greater than that under D14L200 (103.95 kWh·m‒2), production was 2.7 times higher, resulting in superior productivity per unit power. Although the optimal energy efficiency varies by crop species and cultivation objectives, elevated EEUE levels generally indicate favorable economic viability in vertical farming systems. Considering that electricity costs account for a large proportion of operating expenses, EEUE is a key indicator determining commercial success. Poor economic performance under low light is primarily due to insufficient biomass production relative to energy input. Therefore, high light conditions must be prioritized when the objective is to maximize raw material production for commercial applications. It should also be noted that the EEUE values reported here reflect only the electrical energy consumed by LED lighting and do not account for other facility energy loads (e.g., HVAC, pumps); thus, the present discussion of economic viability should be interpreted as reflecting lighting-specific, rather than whole-system, energy efficiency.
Interestingly, D16L300 slightly enhanced the EEUE outcome for JA production (39.5 mg·kWh‒1) compared to D16L375 (37.4 mg·kWh‒1). This variation suggests that power efficiency for bioactive compound production can be optimized at moderate PPFD levels (300 µmol·m‒2·s‒1) without needing maximum intensity levels (375 µmol·m‒2·s‒1). Photosynthetic rates increase proportionally with light at low intensities but gradually reach saturation above certain thresholds. In conclusion, among the conditions tested, the greatest biomass was obtained under a 16-h photoperiod with a PPFD of 375 µmol·m‒2·s‒1 (D16L375). Because dry weight and JA increased linearly without reaching saturation, the true optimum may lie beyond the range examined here. However, to balance energy cost reduction with productivity for commercial operations, D16L300 may serve as a reasonable alternative. These results provide fundamental guidelines for designing optimal light environments for large-scale medicinal plant cultivation using vertical farming systems.
