

Introduction
Materials and Methods
Plant Materials
FT Measurement
Soluble Sugar Analysis
Statistical Analysis
Results and Discussion
Seasonal Variations in Daily Air Temperatures
FT of Sweet Persimmons
FT Comparison of Year 1 Versus Year 2
Soluble Sugars of Sweet Persimmons
Introduction
In recent years, a continuous increase in average annual temperatures and unseasonable temperature changes has led to crop loss. Particularly, unpredictable frost injury has frequently occurred in the spring season. When the temperature dips below zero, ice crystals form in the extracellular space due to a higher freezing point. As ice crystals grow with the descending temperature, intracellular water moves to the extracellular space by the water potential gradient (Thomashow, 1999). In general, in response to temperature changes, cells are repeatedly dehydrated and expanded to maintain equilibrium. However, when the temperature exceeds the limit, cells die due to intracellular ice formation (Burke et al., 1976).
Woody plants survive in subzero temperatures through cold acclimation (CA). CA is induced mainly by gradual exposure to low temperatures and short days (Thomashow, 1999; Vitasse et al., 2014). As CA progresses, plants suffer various biochemical changes, such as increases in fatty acids, soluble sugars, and dehydrins, as well as gene expression changes (Guy, 1990). After the chilling requirement is met, endodormancy of plants is broken down and freezing tolerance (FT) is lost in response to gradually rising temperatures in the spring. This is called deacclimation (DA) (Vitasse et al., 2014).
Increases of soluble sugars such as sucrose, glucose, and fructose have been reported during CA in many woody plants (Flinn and Ashworth, 1995; Palonen, 1999; Turhan and Ergin, 2012; Shin et al., 2015). Soluble sugars stabilize cell membranes and protect cells from freezing injury (Xin and Browse, 2000). They can also mitigate the toxicity of reactive oxygen species caused by abiotic stresses (Couée et al., 2006). When peeled lower epidermis of Arabidopsis is treated with exogenous sucrose, COR78 (cold-responsive gene expression) gene transcript abundance was increased at 4°C and in the dark condition (Cowie et al., 2008). Exogenous fructose inhibits the activation of superoxides in pea leaves with low-temperature treatment (Bogdanović et al., 2008). Exogenous maltose treatment significantly increases antioxidant (ascorbate peroxidase and catalase) activities and total soluble sugars in wheat leaves under water stress (Ibrahim and Abdellatif, 2016). Glucose and sucrose can be used as precursors for the synthesis of ascorbate, an antioxidant that limits reactive oxygen species (Noctor and Foyer, 1998; Couée et al., 2006).
Electrolyte leakage analysis is a universal method for measuring damage to cell membranes due to abiotic stresses (Lindén et al., 2000). The LT50 value, defined as tissue ion leakage injury to 50% (Burr et al., 1990; Lim et al., 1998), has been used to evaluate FT in many studies (Arora et al., 1992; Pagter et al., 2008; Sun et al., 2020; Yu and Lee, 2020).
Sweet persimmon (Diospyros kaki Thunb.) exhibits insufficient FT in comparison with other temperate fruit trees. It is grown mainly in southern areas of Korea, such as Gyeongnam and Jeonnam, because its cultivation is only possible if the annual average temperature is more than 13°C. Recently, cultivation regions of sweet persimmon have spread north with temperature elevation of the winter season due to global warming. At the same time, frost damage of sweet persimmon has increased because of unseasonably warm spells followed by freezing temperatures in early spring. In general, FT research about sweet persimmon is limited. Although a positive correlation between FT and total soluble sugar in sweet persimmon has been reported (Kim and Kang, 2006), information about the quantification of specific soluble sugars during CA and DA is scarce.
Therefore, the objective of this study was to evaluate seasonal variations in FT and soluble sugars of three sweet persimmon cultivars, ‘Fuyu’, ‘Taishuu’, and ‘Romang’, during two successive years. Our results provide fundamental information for breeding freezing-tolerant cultivars or selecting proper cultivation sites for sweet persimmon.
Materials and Methods
Plant Materials
To measure FT of three sweet persimmon cultivars (‘Fuyu’, ‘Taishuu’, and ‘Romang’), after fruit harvest of each cultivar (in November), current-year shoot tips (5-cm long) with similar diameters from 8-year-old sweet persimmon trees were collected at the end of each month during two successive years (Year 1, November 2017 to April 2018; Year 2, November 2018 to April 2019) at the Pear Research Institute, National Institute of Horticultural Herbal Science, Korea (35°01'27.4"N, 126°44'44.5"E). These shoot samples were randomly collected from 10 and 12 trees of each cultivar. Some samples were immediately used to measure FT. The remaining samples were promptly immersed in liquid nitrogen and stored at -80°C for soluble sugar analysis.
FT Measurement
FT of sweet persimmon cultivars was estimated using the electrolyte leakage analysis method described by Arora et al. (1992) and Shin et al. (2015) with slight modifications. Briefly, samples (21 shoot tips per each cultivar) were rinsed under cold running tap water for 15 s. One shoot tip was then placed in a 15-mL conical tube containing 1 mL distilled water for ice formation. Tubes were then incubated in a refrigerating bath circulator (RW-2040G, Jeio Tech, Daejeon, Korea) equipped with a temperature controller and cooled at a rate of 5°C/h until the target temperature was reached. The starting temperature was 0°C for the freezing test. At the target temperature, tubes were taken out (three conical tubes for a target temperature), kept on ice overnight, and thawed at 2°C. Seven target temperatures (0, -15 to -40°C from November to February; 0, -10 to -35°C in March; and 0, -5 to -30°C in April) during the two successive years were selected based on results of our previous peach freezing tolerance study (Shin et al., 2015).
After freezing treatment, each shoot was cut into 1-cm-long fragments and placed in 15-mL conical tubes containing 8 mL of distilled water. Tubes were shaken at 180 rpm using a precise shaking incubator (WIS-20R, Daihan Scientific co., Ltd., Seoul, Korea) at 25°C for 20 h. Electrical conductivity (EC) of the aliquot was then measured using an EC meter (CP-50N, Istek Inc., Korea). After samples were autoclaved at 120°C for 30 min, EC was measured again. To calculate quantitative values of FT, LT50 values (temperatures that resulted in 50% injury) were estimated using the Gompertz function (Lim et al., 1998).
Soluble Sugar Analysis
In this study, the most freezing-tolerant ‘Romang’ and the most freezing-susceptible ‘Taishuu’ cultivars were selected for soluble sugar analysis. Samples (15 shoot tips per cultivar) were ground to fine powders using a TissueLyser II (Qiagen, Duesseldorf, Germany). Ground powders (200 mg) were placed in 15-mL conical tubes (four replications per each month). These sample tubes were filled with 10 mL of 80% ethanol and incubated at 25°C for 1 h using an ultrasonic extractor. After centrifugation at 1,500 ×g for 10 min at 4°C, the supernatant was collected and then evaporated using a nitrogen evaporator (EYELA MG-2200, EYELA Co., Tokyo, Japan). Extracted sugars were dissolved with 2 mL of HPLC water and filtered with a C18 Sep-Pak cartridge (Waters Associates, Milford, MA, USA) and a 0.45-µm nylon syringe filter (Adventec, Toyo, Japan). Soluble sugar analysis was performed using an HPLC (Alliance 2695, Waters Associates, Milford, MA, USA) connected to a detector (2420 ELSD, Waters, Milford, MA, USA). Filtered extracts (10 µL) were injected to a Sugar-Pak column (Shodex NH2P-50, Showa Denko, Tokyo, Japan). Distilled water was used as a solvent at a flow rate of 1.5 mL·min-1. Glucose, fructose, sucrose, and maltose (Sigma-Aldrich Co., St. Louis, MO, USA) were used as standards.
Statistical Analysis
Statistical differences were determined with analysis of variance (ANOVA) using the SAS 9.4 software package (SAS Institute Inc., Cary, NC, USA). Data analysis was performed using SigmaPlot 12.5 (Systat Software, Inc., San Jose, CA, USA).
Results and Discussion
Seasonal Variations in Daily Air Temperatures
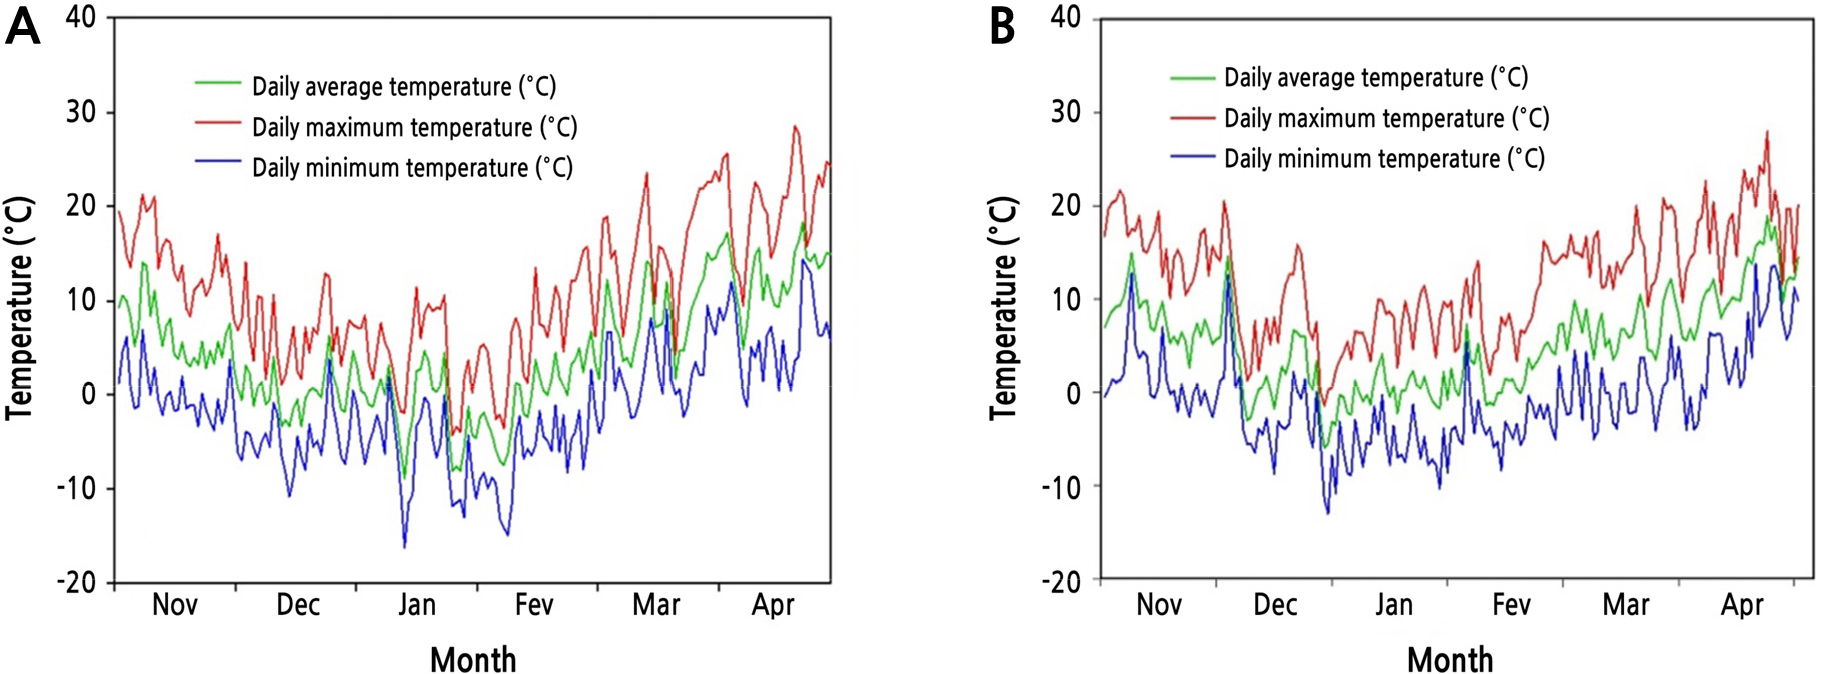
Fig. 1 shows seasonal changes of average, maximum, and minimum daily air temperatures from November to April during two successive years (Year 1 and Year 2) at the experimental site. Daily air temperatures gradually decreased from November 2017 (Fig. 1A). The lowest temperature occurred in the middle of January 2018 (-16.2°C). Thereafter, the temperatures increased steadily until April 2018. Daily air temperatures during Year 2 reached the lowest on December 29, 2018 (-13°C) (Fig. 1B). Overall temperature patterns of the 2 years were similar.
FT of Sweet Persimmons
FT was quantified for the three sweet persimmon cultivars during Year 1 and Year 2 using LT50 values (Fig. 2). FT of the three cultivars increased steadily from November 2017, reaching the maximum in December 2017 to January 2018 (Fig. 2A). The same patterns of FT were also observed during Year 2 (Fig. 2B). CA is a phenomenon induced by gradual low temperatures (Thomashow, 1999). It enables plants to survive in winter at subzero temperatures. In this study, FT of all sweet persimmon cultivars (‘Fuyu’, ‘Taishuu’, and ‘Romang’) increased steadily between November and December (both years). This means that these cultivars were in the process of CA. Thereafter, FT of ‘Fuyu’ was the highest in January 2018 (LT50 = -23.4°C), while FT of ‘Taishuu’ (LT50 = -21.7°C) and ‘Romang’ (LT50 = -26.2°C) was the highest in December 2018 during Year 1 (Fig. 2A). FT of ‘Fuyu’ (LT50 = -23.2°C), ‘Taishuu’ (LT50 = -22.6°C), and ‘Romang’ (LT50 = -23.9°C) was the highest in December 2018 during Year 2 (Fig. 2B).
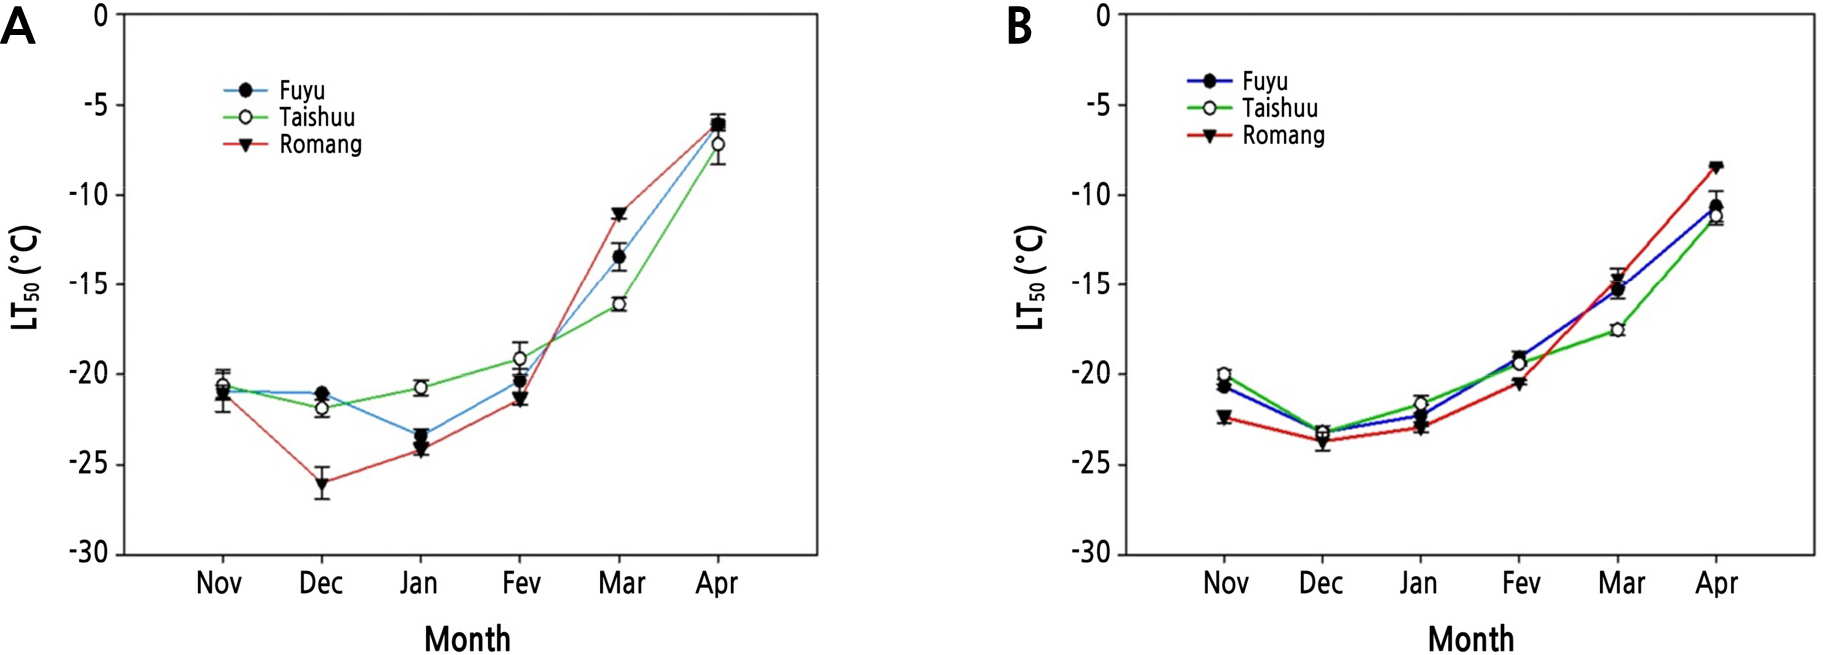
Fig. 2.
Seasonal fluctuations of freezing tolerance estimated as the temperature at which 50% injury occurs (LT50) in current-year shoots of 8-year-old ‘Fuyu’, ‘Taishuu’, and ‘Romang’ sweet persimmon trees from November 2017 to April 2018 (A) and from November 2018 to April 2019 (B). LT50 values were assessed by electrolyte leakage analysis.
On the other hand, FT of the three persimmon cultivars decreased by DA starting in February (both years), becoming the lowest in April (both years). LT50 values in April 2018 for ‘Fuyu’, ‘Taishuu’, and ‘Romang’ with the lowest FT were -6.1, -6.8, and -6.1°C, respectively (Fig. 2A). During Year 2, LT50 values in April 2019 for ‘Fuyu’, ‘Taishuu’, and ‘Romang’ were -10.7, -11.2, and -8.4°C, respectively (Fig. 2B). DA refers to plants losing FT in response to raising temperatures in the spring season after satisfying the low-temperature requirement and breaking down endodormancy (Pagter et al., 2011; Vitasse et al., 2014). Such FT changes happen similarly in many other woody plants (Jones et al., 1999; Shin et al., 2015).
FT Comparison of Year 1 Versus Year 2
FT of ‘Romang’ was the highest in midwinter during Year 1 (Fig. 2A). The difference in maximum FT was -4.5°C between the highest freezing-tolerant cultivar ‘Romang’ (-26.2°C) and the lowest freezing-tolerant cultivar ‘Taishuu’ (-21.7°C). However, FT of these three cultivars was similar in the same period during Year 2 (Fig. 2B). According to Szalay et al. (2010), LT50 values of peach flower buds are lower in years with lower temperatures, and cold tolerance of outdoor peach flower buds is better than that of indoor ones. Therefore, cold resistance varies depending on the temperature even for the same species. In this study, the average air temperature was 0.4°C in December 2017 and 1.9°C in December 2018 at the experimental site (Fig. 1). Thus, average air temperature of Year 1 was 1.5°C lower than that of Year 2. The ‘Romang’ cultivar acquired higher FT through CA with lower temperatures during Year 1. However, it did not acquire such FT during Year 2 (Fig. 2). In addition, the average air temperature in April 2019 was 1.2°C lower than that in April 2018 (Fig. 1). For that reason, FT of April 2019 would be higher than that in April 2018 for all cultivars (Fig. 2). Particularly, FT of ‘Romang’ was higher than that of ‘Taishuu’ in the CA period (December to January), whereas its FT was lower than that of ‘Taishuu’ in the DA period (March to April) for both years (Fig. 3). For several temperate fruit trees, such as blueberry and peach, some cultivars show relatively higher FT in midwinter but lose FT faster during DA compared to other cultivars with relatively lower FT in midwinter. Therefore, the FT of the investigated cultivars is not correlated between midwinter (CA) and spring (DA) (Rowland et al., 2005; Oh et al., 2017). Our results are consistent with these findings.
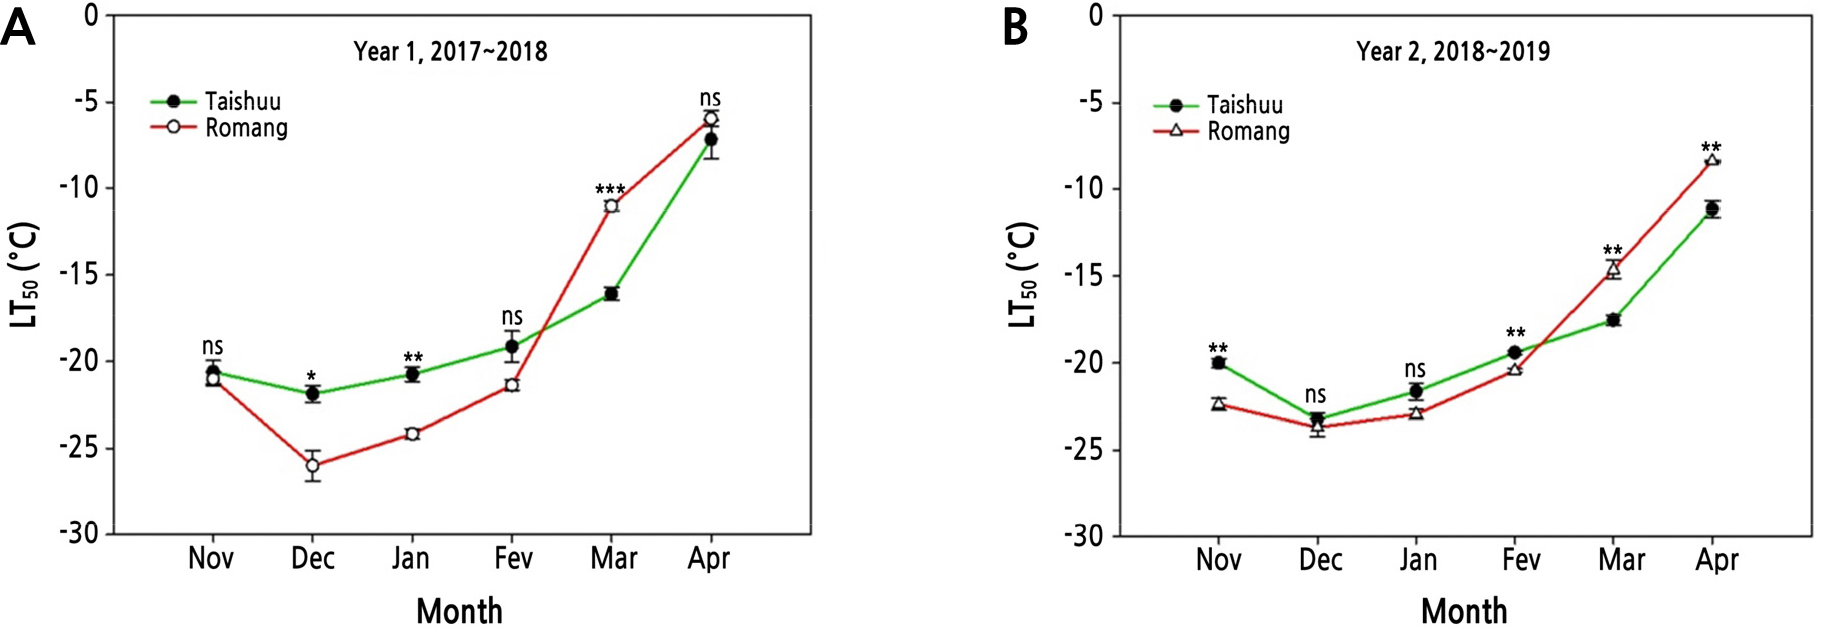
Fig. 3.
Comparison of freezing tolerance estimated as the temperature at which 50% injury occurs (LT50) in current-year shoots of 8-year-old ‘Taishuu’ and ‘Romang’ sweet persimmon trees from November 2017 to April 2018, Year 1 and from November 2018 to April 2019, Year 2. LT50 values were assessed by electrolyte leakage analysis. ns, *, **, and *** non-significant, significant at p < 0.05, p < 0.01, and p < 0.001 between two sweet persimmon cultivars at the sampling date by t-test (n = 3).
Soluble Sugars of Sweet Persimmons
Soluble sugars such as fructose, glucose, sucrose, and maltose are known to stabilize the cell membrane and protect plants from low temperatures (Xin and Browse, 2000). Reactive oxygen species (ROS) are harmful substances caused by abiotic stress. They can produce lipid peroxidation substances, causing damage to cell membranes (Noctor and Foyer, 1998). Fructose reduces ROS in pea leaves (Bogdanović et al., 2008). Maltose mitigates water stress injury in wheat leaves (Ibrahim and Abdellatif, 2016). It has been reported that antioxidant substances known to inhibit ROS are increased when glucose is used to treat wheat seedlings (Hu et al., 2012). Glucose and sucrose are precursors for the synthesis of ascorbate, an antioxidant (Noctor and Foyer, 1998; Couée et al., 2006).
‘Taishuu’ and ‘Romang’, which showed the most FT differences throughout our experimental periods among three sweet persimmon cultivars, were selected for soluble sugar analysis. Their shoot samples were collected during the second year (November 2018 to April 2019). Total soluble sugar content of ‘Taishuu’ was the highest in December 2018 due to CA. It started to decrease in January 2019 and decreased steadily until April 2019 due to DA (Table 1). Fructose and glucose contents of ‘Taishuu’ showed the same pattern as total soluble sugar. Meanwhile, a minor amount of sucrose of ‘Taishuu’ was detected throughout the whole experimental period. It was not detected in December and January. Maltose was only detected minimally in ‘Taishuu’ in March and April.
Table 1.
Contents of total soluble sugar, fructose, glucose, sucrose, and maltose in current-year shoots of 8-year-old ‘Taishuu’ and ‘Romang’ sweet persimmon tress from November 2018 to April 2019
| Month | Soluble sugar (mg·mL-1)z | |||||||||||||
| Total soluble sugar | Fructose | Glucose | Sucrose | Maltose | ||||||||||
| ‘Taishuu’ | ‘Romang’ | ‘Taishuu’ | ‘Romang’ | ‘Taishuu’ | ‘Romang’ | ‘Taishuu’ | ‘Romang’ | ‘Taishuu’ | ‘Romang’ | |||||
| Nov | 1.1 abx | 1.3 b | 0.6 a | 0.7 b | 0.5 b | 0.6 b | 0.1 | N.D | N.D | N.D | ||||
| Dec | 1.3 a | 1.7 a | 0.7 a | 0.9 a | 0.6 a | 0.8 a | N.Dy | N.D | N.D | N.D | ||||
| Jan | 1.1 ab | 1.2 b | 0.6 a | 0.4 c | 0.5 c | 0.3 c | N.D | 0.5 | N.D | N.D | ||||
| Feb | 0.8 bc | 0.8 c | 0.4 b | 0.4 c | 0.3 c | 0.3 c | 0.2 | 0.2 | N.D | N.D | ||||
| Mar | 0.5 dc | 0.7 cd | 0.2 c | 0.3 cd | 0.1 c | 0.2 c | 0.1 | 0.1 | 0.1 | 0.1 | ||||
| Apr | 0.5 d | 0.5 d | 0.1 c | 0.1 d | 0.1 c | 0.2 c | 0.1 | 0.1 | 0.1 | 0.1 | ||||
Total soluble sugar, fructose, and glucose contents of ‘Romang’ exhibited the same patterns as those of ‘Taishuu’, showing increases during CA but decreases down during DA (Table 1). On the other hand, sucrose of ‘Romang’ was detected in a small amount from January to April, and maltose of ‘Romang’ was only detected in March and April.
For both ‘Taishuu’ and ‘Romang’ cultivars, contents of soluble sugars were increased during CA but decreased during DA (Table 1). An increase in soluble sugars during CA has been reported in canes and buds of Rubus idaeus (Palonen, 1999), bark tissues of sweet cherry (Turhan and Ergin, 2012), shoots of Prunus persica (Shin et al., 2015), and flower buds of Forsythia taxa (Flinn and Ashworth, 1995). The extent of each soluble sugar in response to CA is different depending on plant species. For sweet persimmon shoots investigated in this study, fructose and glucose were the most abundant, similar to results of canes and buds of Vitis vinifera (Jones et al., 1999) and bark tissues of Prunus sp. (González-Rossia et al., 2008).
Generally, sucrose is one of the main sugars related to CA. However, it was not detected or it was detected in too small amount compared to fructose and glucose in our study (Table 1). Such reduction of sucrose is considered an increase of sucrose hydrolysis activity for two reasons. First, many ripened fruits of astringent and non-astringent persimmon cultivars accumulate more fructose and glucose than sucrose. The ratio of fructose/glucose ratio is close to 1 (Daood et al., 1992; Del Bubba et al., 2009; Giordani et al., 2011; Novillo et al., 2016). In our study, because fruits of the three sweet persimmon cultivars were harvested from October to November, a large amount of sucrose would be mobilized while fruits ripen. Second, some studies have reported that the activity of invertase that is in charge of sucrose hydrolysis is increased by low temperatures. According to Palma et al. (2014), when ‘Netura’ zucchini fruits (Cucurbita pepo L.) that are more tolerant to low temperature are refrigerated at 4°C for 14 d post-harvest, the activity of invertase is increased by 25%. This leads to decreased sucrose and increased fructose and glucose. However, invertase activity is decreased when ‘Netura’ zucchini fruits are stored at 20°C (Palma et al., 2014). In addition, when roots of sweet potato are stored at 4.5°C, invertase activity and contents of fructose and glucose are increased. On the other hand, invertase activity and contents of fructose and glucose are decreased with increasing temperature (Huang et al., 1999). Thus, the enhancement of glucose and fructose during CA is related to low temperature.
Maltose is known to have a positive effect against environmental stresses (Ibrahim and Abdellatif, 2016). However, it was only detected in trace amounts in this study. In poplar trees, maltose began to accumulate in August. Its content decreased significantly in winter after peaking in October. This is in contrast with the increase in the winter season for sucrose and galactosides. In other words, maltose appears to be involved in the regulation of the transfer of large amounts of hexose required for the synthesis of sucrose and galactosides (Sauter and Van Cleve, 1993).
‘Romang’ showed higher FT during CA (Fig. 3). It has higher soluble sugar contents than ‘Taishuu’ (Table 1). Many studies have shown that cultivars with relatively higher soluble sugars have better FT (Palonen, 1999; Turhan and Ergin, 2012; Shin et al., 2015). Our results were consistent with the findings of these studies. However, soluble sugar content of ‘Taishuu’ that was higher in March and April (during DA) was lower than ‘Romang’ (Table 1).
Taken together, our results revealed that in both years, FT was the highest from December to January for the three persimmon cultivars. It began to decline in February, becoming the lowest in March and April. Meanwhile, contents of total soluble sugar, fructose, and glucose were highly and positively correlated with FT of the two cultivars (Table 2, p < 0.001). Significantly, in midwinter, FT of ‘Romang’ was the highest, while FT of ‘Taishuu’ was the lowest during Year 1 and Year 2. However, in the spring season, FT of ‘Romang’ was the lowest, while FT of ‘Taishuu’ was the highest in both years. Thus, ‘Taishuu’ would be adaptable in cultivation areas to avoid extreme low temperatures in the winter season. Because ‘Romang’ is more sensitive to temperature changes, it could lose FT more rapidly in response to an abnormal rise in temperature in the spring season.
Table 2.
Correlation coefficients between freezing tolerance estimated as the temperature at which 50% ion leakage (LT50) occurs and contents of different carbohydrates in current-year shoots of 8-year-old ‘Taishuu’ and ‘Romang’ sweet persimmon trees from November 2018 to April 2019
| Carbohydrate | Correlation coefficient (r) | |
| ‘Taishuu’ | ‘Romang’ | |
| Total soluble sugar | -0.745*** | -0.809*** |
| Fructose | -0.800*** | -0.752*** |
| Glucose | -0.720*** | -0.640*** |
