

Introduction
Materials and Methods
Crop cultivation and temperature treatment conditions
Investigation of wheatgrass growth characteristics
Analysis of the isoorientin content in wheatgrass
Development of a model based on different temperature conditions
Verification of the model based on different temperature conditions
Results and Discussion
Changes in wheatgrass growth characteristics based on different temperature conditions
Changes in the isoorientin content of wheatgrass based on different temperature conditions
Verification results of the quadratic curve model based on different temperature conditions
Introduction
Sprout vegetables are characterized by the absence of the development of true leaves within seven days of germination. Seed germination requires a significant amount of energy, and the fats and carbohydrates stored in the seeds are broken down to supply energy, causing a decrease in their content (El-Adawy 2002). However, once nutritional growth begins after germination, substances such as vitamins, which are not observed in the seeds, are biosynthesized, thereby enriching the nutritional content of seedlings (Kim and Lee 2010). Vitamins produced after seed germination increase the antioxidant capacity of sprouting vegetables (Frias et al. 2005). Additionally, sprout vegetables that have undergone germination have been reported to have increased levels of amino acids, such as leucine and valine, compared to those that have been heat-treated (Khalil 2001). Based on these characteristics, health-conscious consumers consume sprouted vegetables as health foods, and the ability to grow them at home without the use of pesticides in an environmentally friendly manner is considered an advantage (Ebert 2022).
Wheat, a widely consumed staple food crop worldwide, is used as a vegetable sprout. Wheatgrass has superior antioxidant capabilities and contains relatively more bioactive substances than those found in wheat seeds (Islam et al. 2020). The germination process of wheat activates several endogenous enzymes, including tyrosinase, that produce these bioactive substances (Nagaoka 2005), which act on the human body to inhibit the proliferation of leukemia cells through antioxidant activity (Aydos et al. 2011). Moreover, substances such as phenolic acids reportedly exhibit preventive effects on gastrointestinal cancers, including colorectal cancer (Adom and Liu 2002). Specifically, isoorientin, a natural C-glycosylflavone found in wheatgrass, protects liver tissues and the vascular endothelium, improves lipid metabolism, enhances the defense system via antioxidant functions, and regulates the secretion of inflammatory cytokines, preventing hyperlipidemia and conferring liver protection (Yuan et al. 2016). The interest in the value of wheatgrass has led to various studies of its use as a sprout vegetable.
In China, the characteristics and distribution of winter wheat cultivation areas depending on climatic conditions have been comprehensively reported (Jing-Song et al. 2012). Similarly, in Pakistan, there has been research on the growth characteristics of wheat under future climate change conditions from the 2010s to the 2060s (Janjua et al. 2010). However, although the cultivation conditions for wheat as a traditional food crop have been established through various studies, research on its use as a sprouting vegetable is lacking. Studies of the effects of light quality on vegetative parameters and on the oxidative status of wheatgrass have been conducted, relying on light-emitting diodes (LEDs) as artificial light sources under which to grow wheatgrass (Bartucca et al. 2020). Other research has attempted to enhance the antioxidant capacity and the content of the bioactive substances of wheatgrass under organic soil conditions when subjected to a salicylic acid treatment (Islam et al. 2021a). However, researchers have not attempted to establish cultivation conditions for increasing the isoorientin content in wheatgrass.
The growth characteristics and bioactive substance contents of sprout vegetables are mainly influenced by the temperature conditions under which the crops are grown (Rasul et al. 2011; Kim et al. 2018; Seo et al. 2020). Studies involving spinach have reported that the isoorientin content is affected by the temperature (Watanabe and Ayugase 2015). Recently, modeling techniques have been used to express the responses of crops to changes in environmental factors quantitatively (Medina-Ruíz et al. 2011). As the enzyme activity within plants changes with temperature fluctuations, quadratic regression models are widely used to express the responses of crops to different temperature conditions (Jung et al. 2017). The quadratic regression model has the disadvantage of being symmetric with respect to its maximum value, but its simplicity of form makes it widely used to quantify plant responses to different temperatures. In this study, we aimed to establish a quadratic regression model capable of quantitatively expressing the growth characteristics of wheatgrass and the corresponding isoorientin content under different temperature conditions.
Materials and Methods
Crop cultivation and temperature treatment conditions
Wheat seeds of the ‘Keumkang’ variety (Triticum aestivum L. cv. ‘Keumkang’) obtained from Wheat Coop (Seoul, Korea) were used in the experiments here. The seeds were washed with tap water and immersed in a 5% NaOCl solution for 24 h. An acrylic chamber (39 cm × 72 cm × 72 cm) equipped with a temperature-controllable Peltier element was used to cultivate wheatgrass under the different temperature conditions. The wheatgrass specimens were grown in a medium containing coir and perlite at a ratio of 6:4 (Sunshine Mix 4; SunGro Horticulture, Agawam, MA, USA) for seven days. Watering was conducted using the bottom irrigation method to maintain the moisture content of the medium at the field capacity (pF: –1.8) at 100 mL once a day throughout the cultivation period. The light intensity required for wheatgrass cultivation was 150 µmol m-2 s-1, provided using white LED lights (T5 LED Batten; Philips, Amsterdam, Netherlands), with the photoperiod set to 12 h. The temperature inside the chamber was held in the range of 18–32°C using the installed Peltier device, with this setting applied across 38 different segments. The wheatgrass was harvested seven days after sowing it using trays conforming to the 406 standard.
Investigation of wheatgrass growth characteristics
Growth characteristics were investigated by randomly selecting three samples from crops grown under identical temperature conditions and dividing a 406 tray into three compartments. Following the Agricultural Science and Technology Research and Analysis Standards of the Rural Development Administration (RDA 2012), the growth characteristics of wheatgrass, in this case the plant height, leaf area, shoot fresh weight, and root fresh weight, were measured seven days after sowing. A leaf area meter (LI-3100; LI-COR, Lincoln, NE, USA) was used to measure the leaf area. Subsequently, the shoot and root parts of the harvested wheatgrass were dried for seven days in an 80°C oven (C-DO Dry-oven; Changshin Science, Seoul, Korea) to measure the dry weights of both parts.
Analysis of the isoorientin content in wheatgrass
Isoorientin was extracted from the wheatgrass samples using 50% ethanol, after which it was concentrated and analyzed using a high-performance liquid chromatography (HPLC) device (1260 Infinity II; Agilent, Santa Clara, CA, USA). A YMC-Triart C18 column (YMC, Kyoto, Japan) was utilized for HPLC, with the mobile phase consisting of 0.1% formic acid (solvent A) and acetonitrile (solvent B) applied at ratios of A (85%) to B (15%) for 0–25 min, A (65%) to B (35%) for 25–30 min, A (0%) to B (100%) for 30–36 min, and A (85%) to B (15%) for 36–40 min. The flow rate of the mobile phase was set to 0.8 mL min-1, and 10 µL was injected over 40 min. The isoorientin content was analyzed using a diode array detection device. Additionally, the dry weight of wheatgrass and its isoorientin content (3',4',5,7-tetrahydroxy-6-C-glucopyranosyl flavone) were multiplied to calculate the isoorientin content per sample.
Development of a model based on different temperature conditions
The following quadratic equation was selected to represent a model expressing the growth characteristics of wheatgrass and the corresponding isoorientin content under various temperature conditions:
Here, G represents the growth characteristics (plant height, leaf area, shoot fresh and dry weights, and root fresh and dry weights) and the isoorientin content; T represents the temperature (°C); and a, b, and c are regression coefficients. A nonlinear regression analysis was conducted using the SPSS statistical package (IBM, Amonk, NY, USA) on the measured wheatgrass growth characteristics and isoorientin contents at different temperatures. The precision of the model was determined by calculating the coefficient of determination (R2) and the root mean square error (RMSE). A quadratic curve model was then used to calculate the temperature conditions that maximized each growth characteristic and isoorientin level.
Verification of the model based on different temperature conditions
For model verification, wheatgrass was cultivated under different temperature conditions for seven days. All cultivation conditions were identical to those used for model selection and construction, and 38 samples were randomly selected from the cultivated crops. For verification, crop growth characteristics and isoorientin contents were measured using the methods used for model selection and construction. The measured data were regressed against the data predicted by the quadratic curve model on a 1:1 basis to calculate the R2 and RMSE values.
Results and Discussion
Changes in wheatgrass growth characteristics based on different temperature conditions
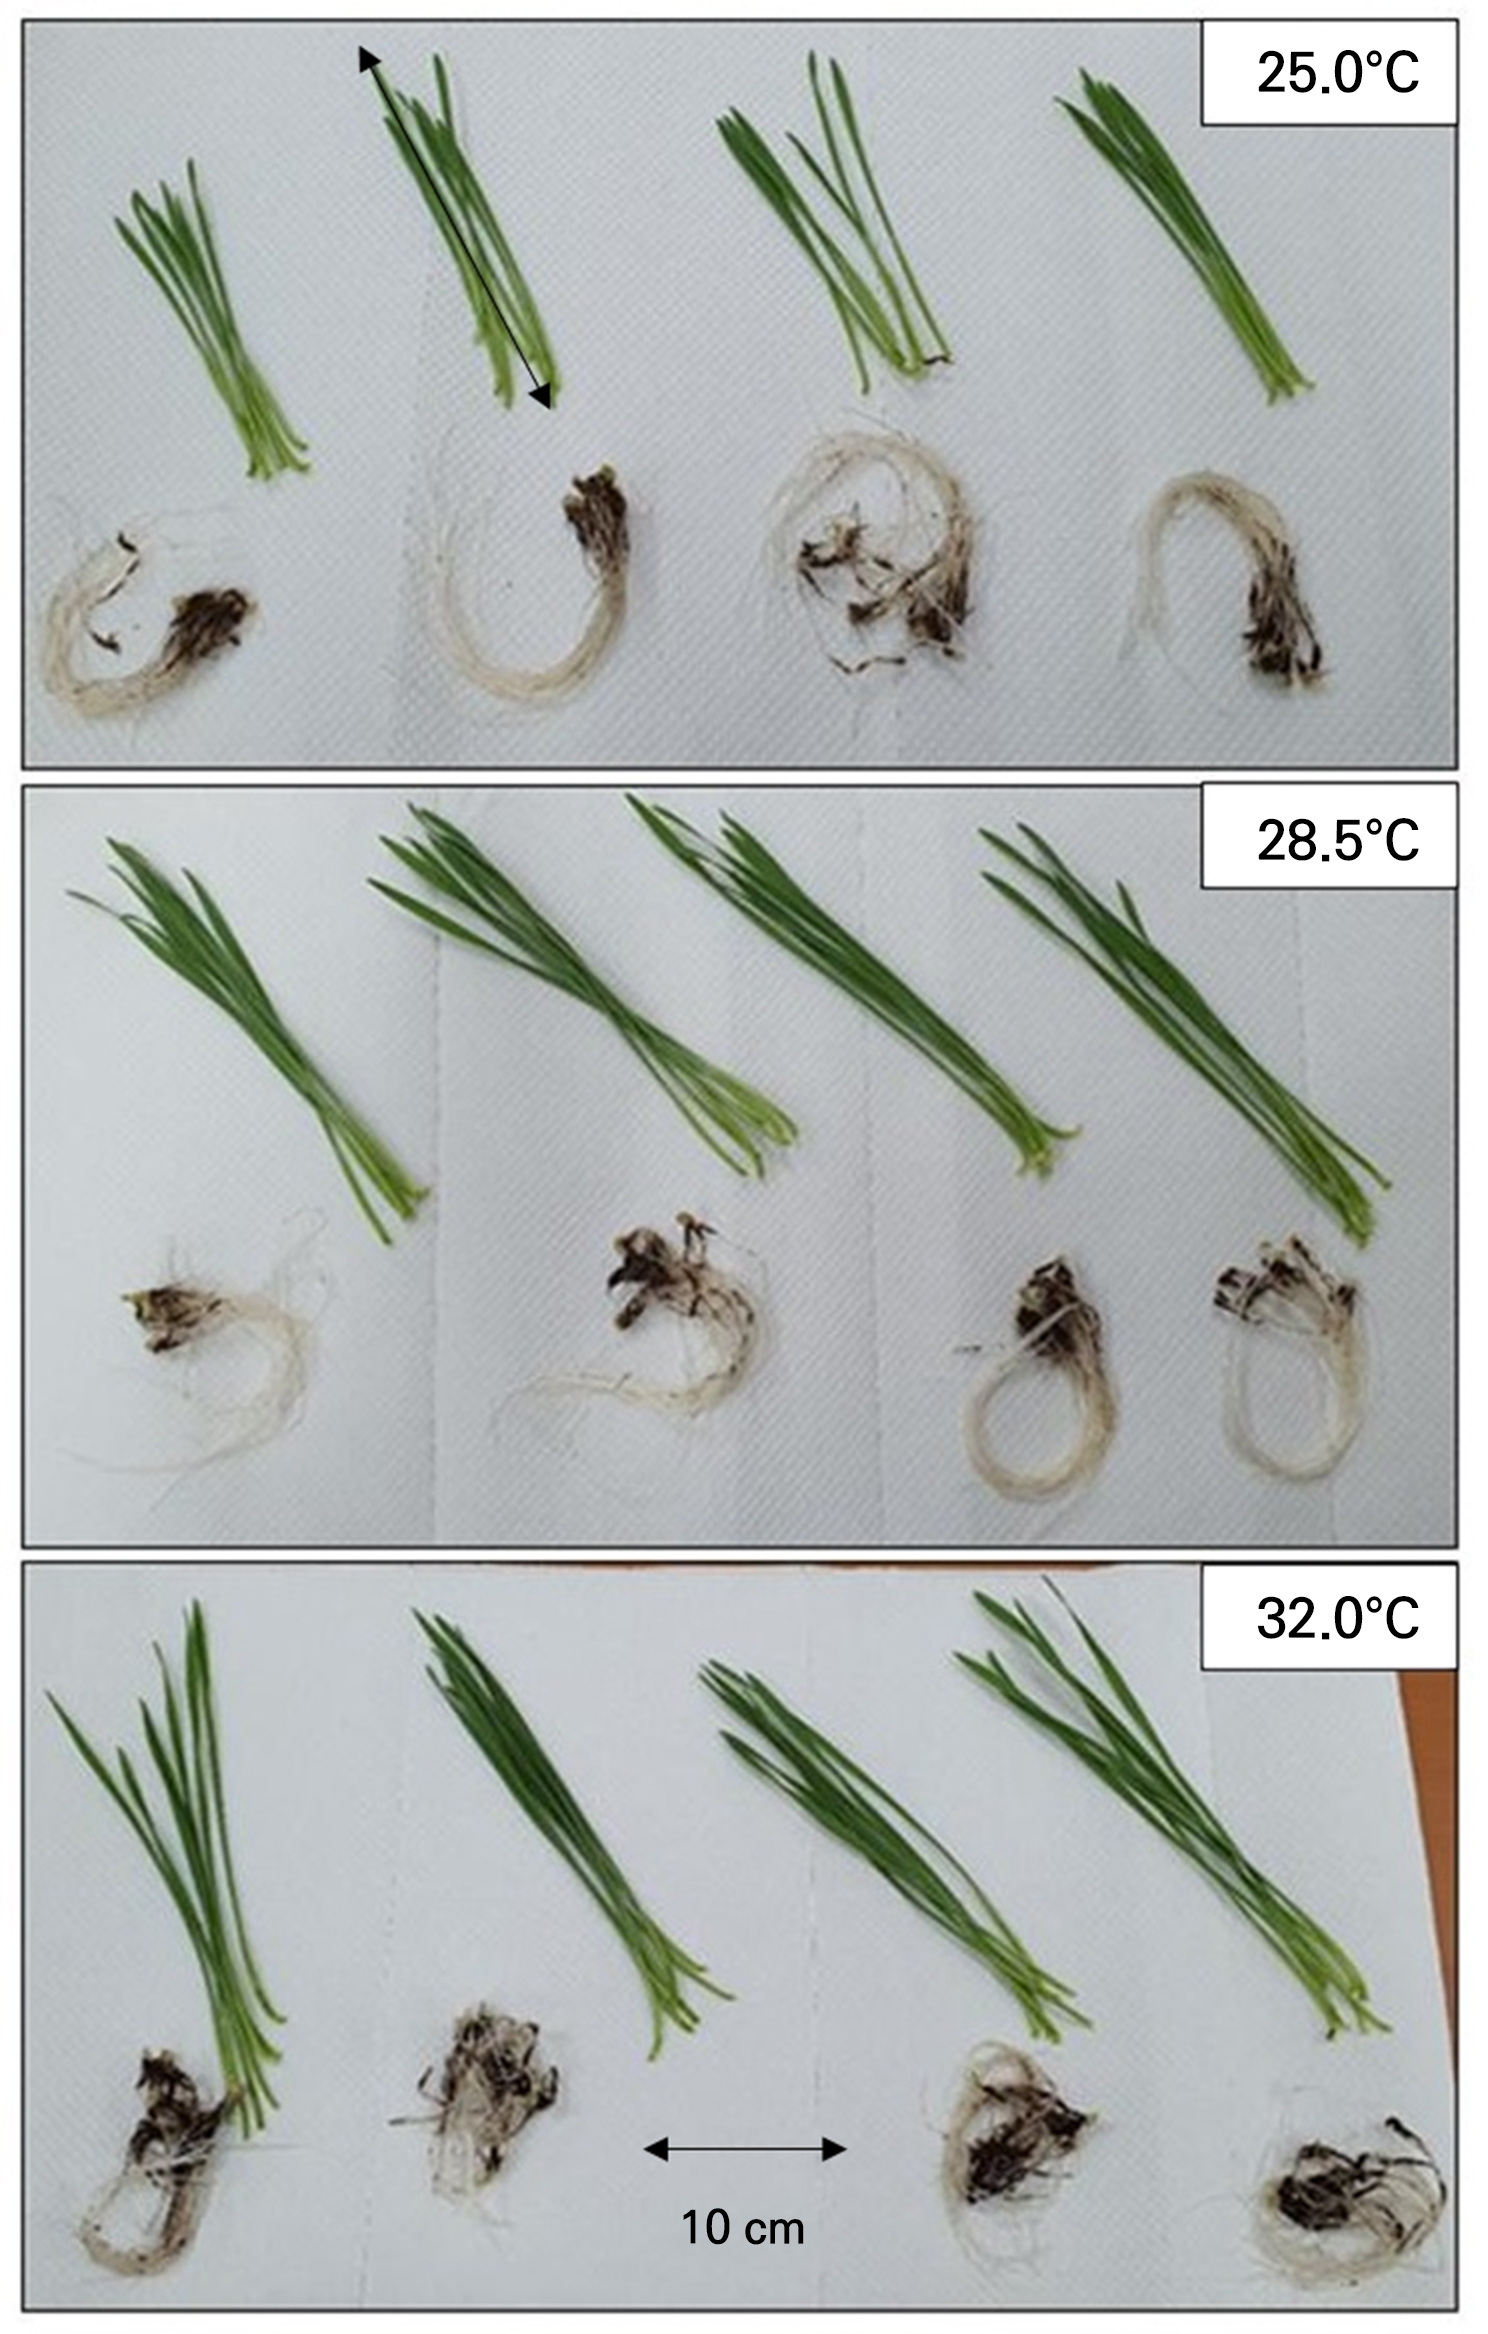
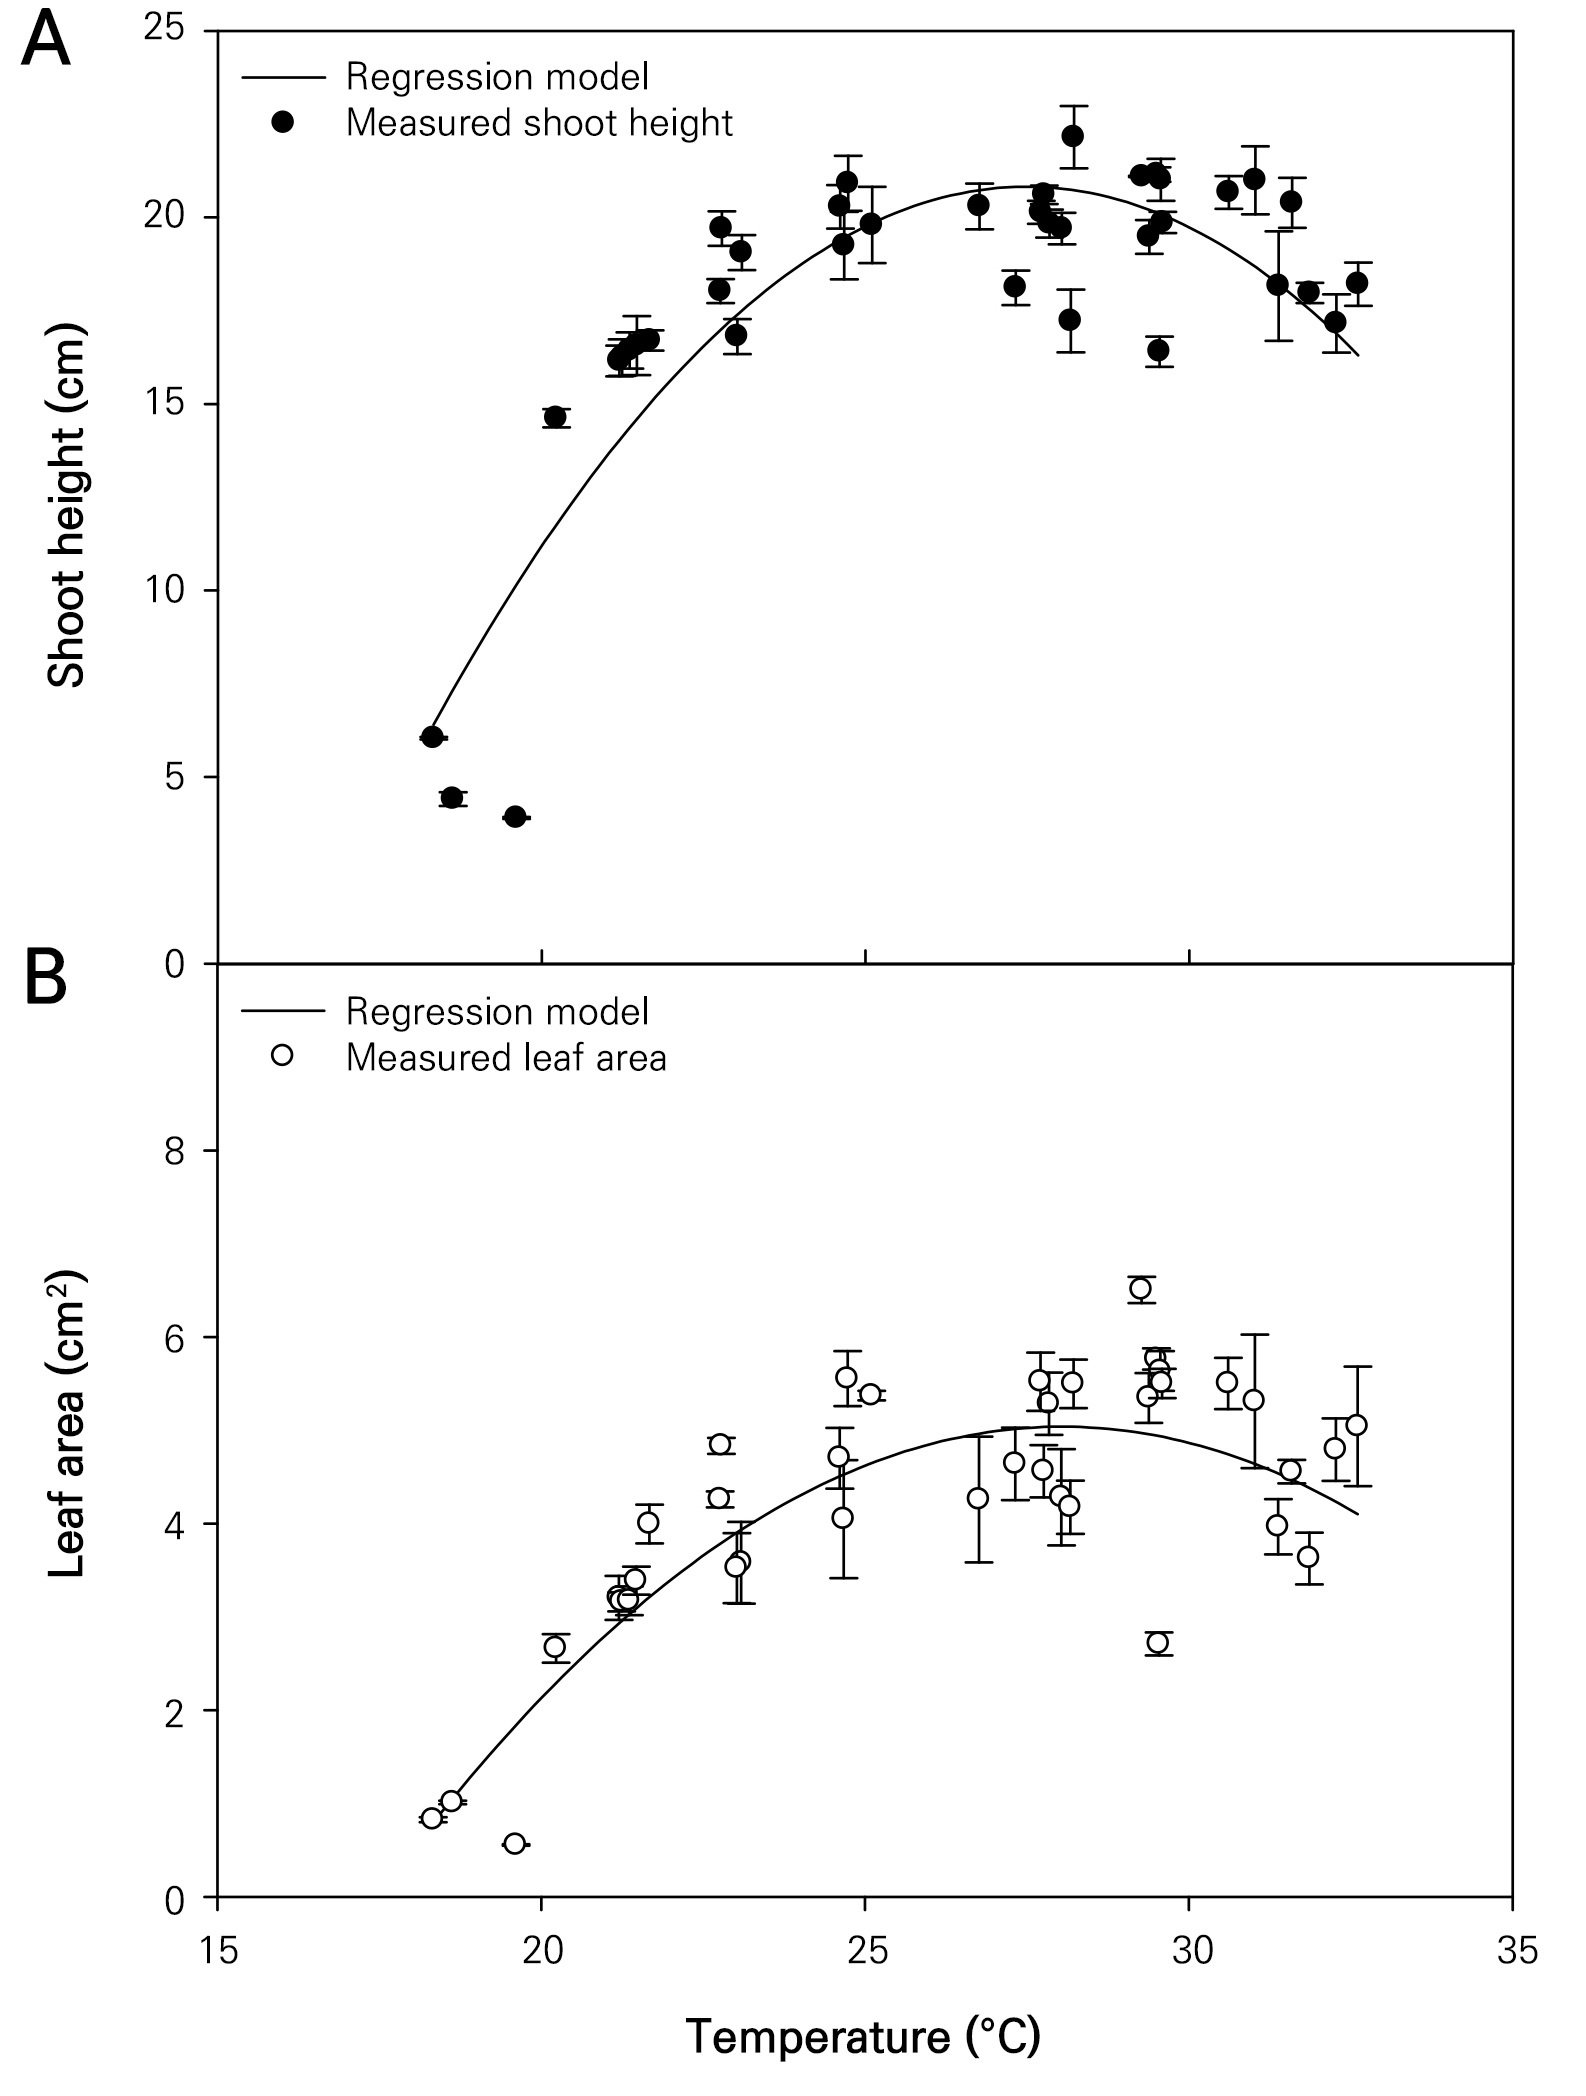
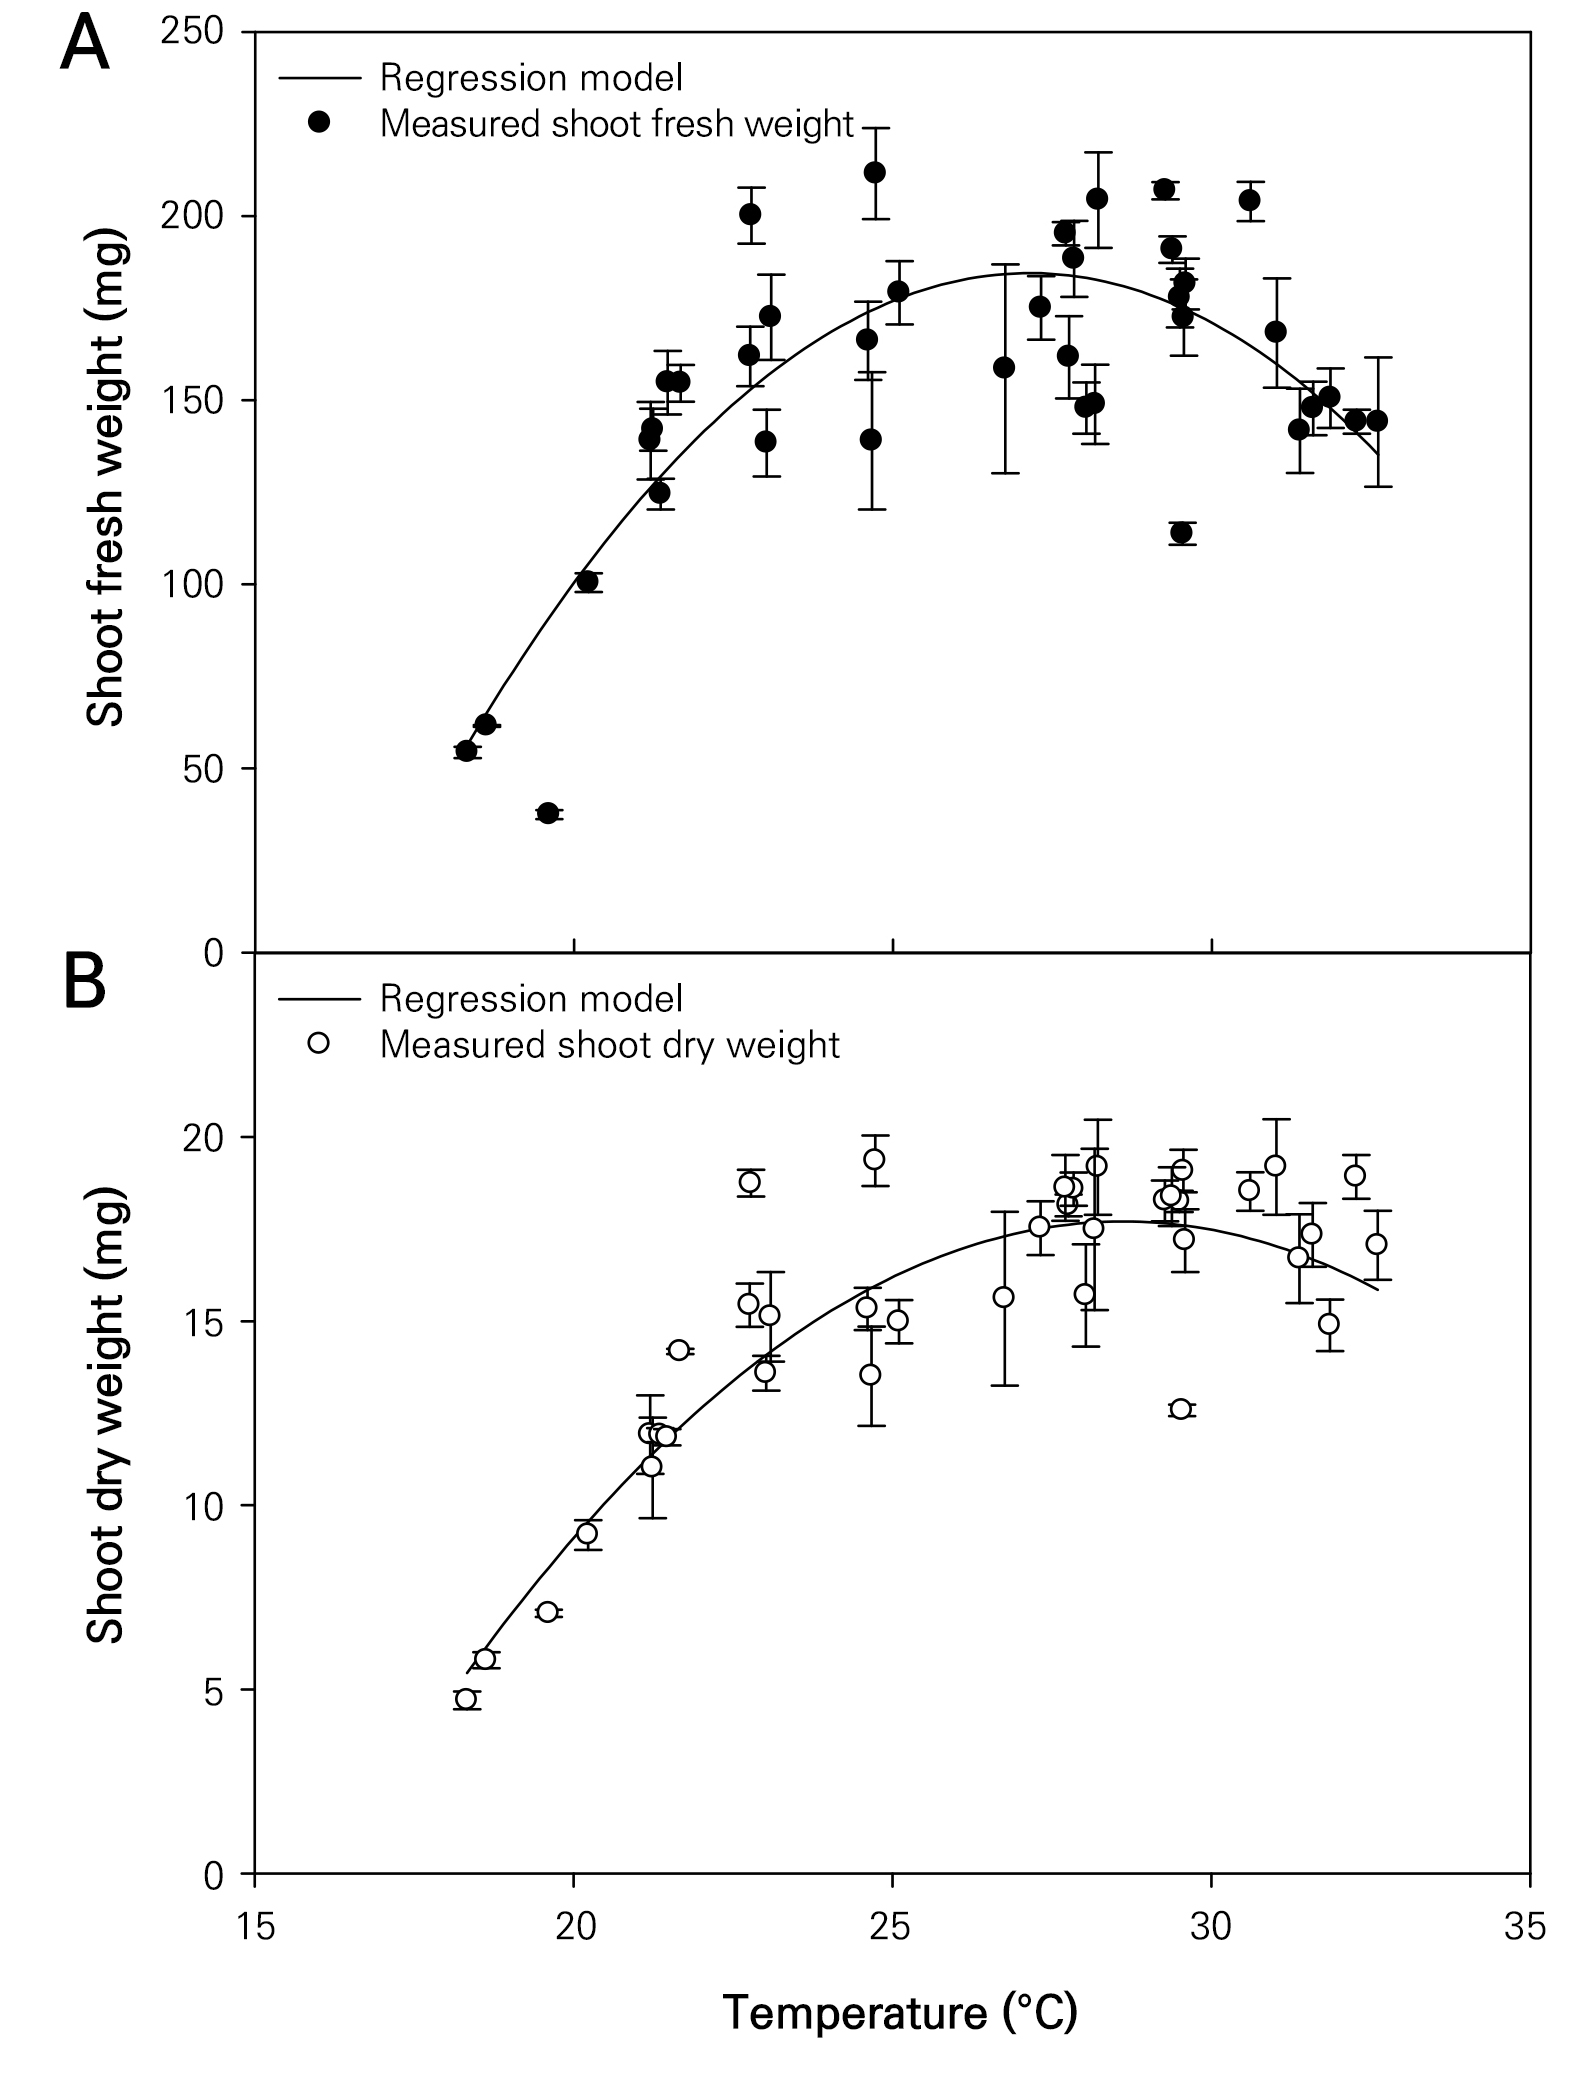
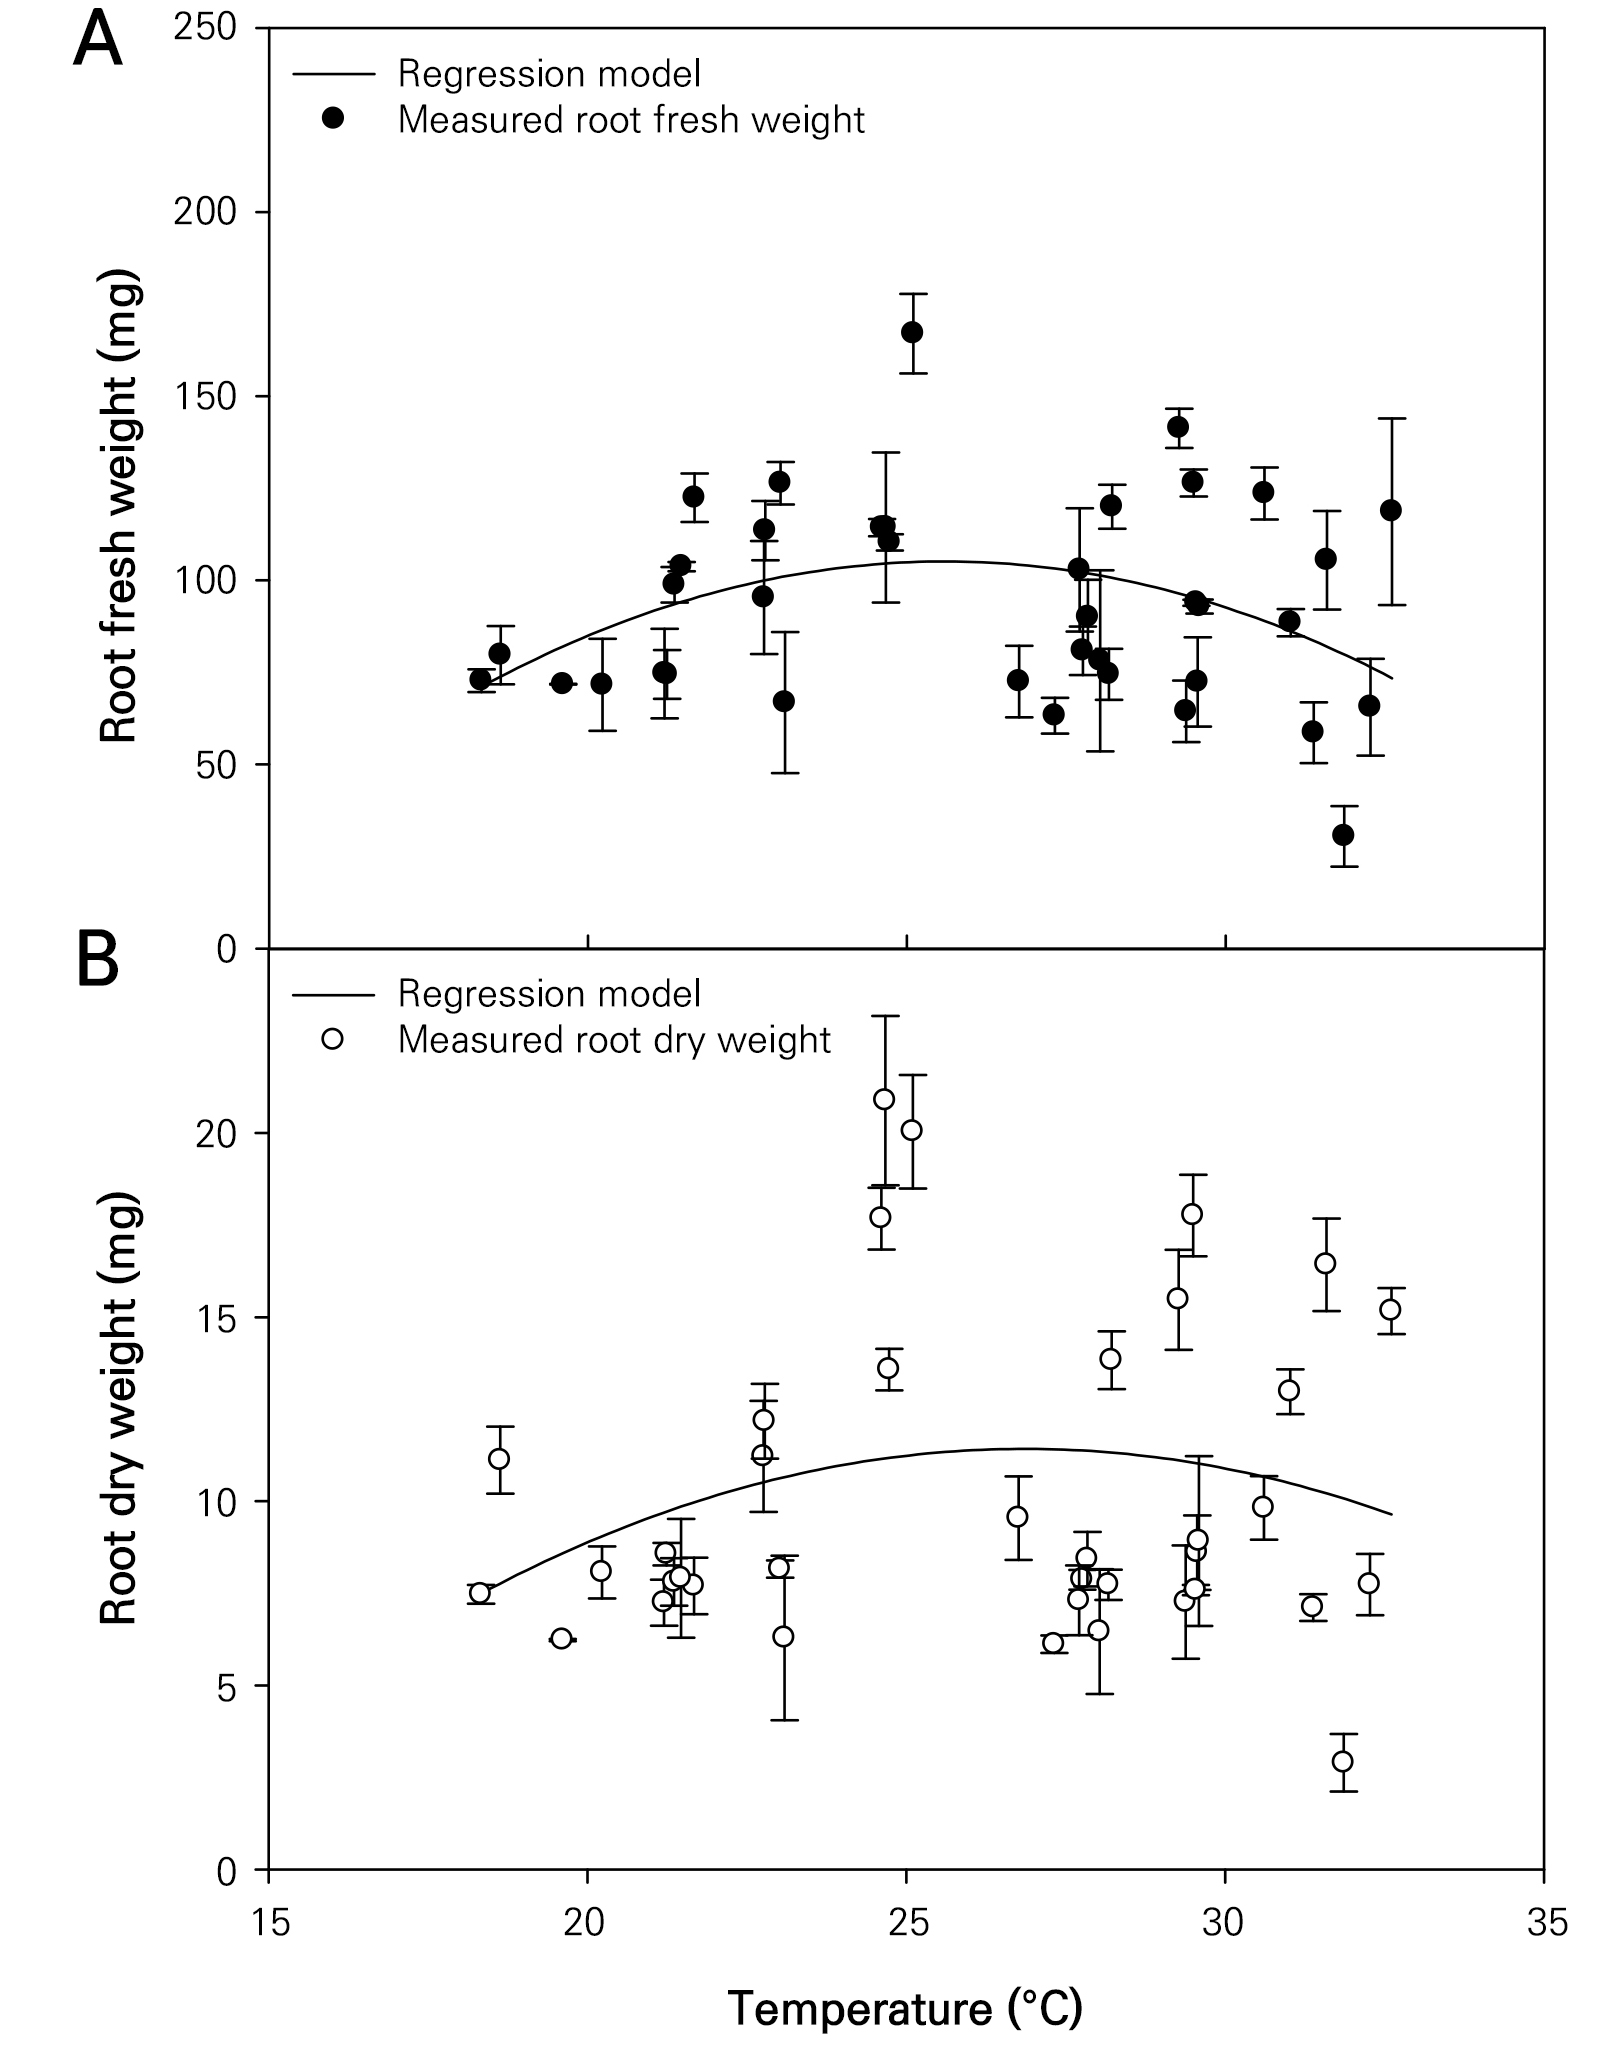
The growth characteristics of the wheatgrass cultivated and observed seven days after sowing under varying temperature conditions were investigated (Fig. 1). The plant height and leaf area of the wheatgrass specimens ranged from 3.89 to 23.04 cm and from 0.546 to 6.668 cm2, respectively (Fig. 2). These findings are comparable to those of the plant heights reported on the seventh day after germination across seven varieties of wheatgrass in a previous study (Kim et al. 2022). The coefficients of determination (R2) for the quadratic regression models representing the wheatgrass plant height and leaf area based on different temperature conditions were 0.772 and 0.687, respectively, indicating high reliability of the models (Table 1). The optimal temperatures for maximizing the wheatgrass plant height and leaf area were recorded as 27.486 and 28.044°C, respectively. The shoot fresh and dry weights of the wheatgrass specimens were distributed between 36.50 and 225.29 mg and between 4.43 and 20.00 mg, respectively (Fig. 3). The coefficients of determination for the quadratic regression models representing the shoot fresh and dry weights of wheatgrass based on different temperature conditions were 0.625 and 0.770, respectively, indicating high model reliability (Table 1). The optimal temperatures for maximizing the shoot fresh and dry weights of wheatgrass were recorded as 27.142 and 28.612°C, respectively. A previous report suggested that the optimal temperature for maximizing the fresh weight of the ‘Baekjung’ wheatgrass variety was 20°C (Islam et al. 2021b), but the study was limited to temperature treatments of 10, 20, and 30°C, thereby failing to determine the optimal temperature. The root fresh weight and dry weight of the wheatgrass specimens were between 25.47 and 177.14 mg and 2.43 and 23.32 mg, respectively (Fig. 4). The coefficients of determination for the quadratic regression models representing the fresh and dry root weights of the wheatgrass based on different temperature conditions were 0.111 and 0.047, respectively, indicating no significant differences in the root growth due to the temperature conditions (Table 1). Therefore, the quadratic regression model was deemed unsuitable for representing wheatgrass root growth.
Changes in the isoorientin content of wheatgrass based on different temperature conditions
The isoorientin content per gram of dry weight and per wheatgrass plant were in the ranges of 0.171–3.261 mg g-1 and 0.002–0.046 mg plant-1, respectively (Fig. 5). Similar to the results obtained in this study, a previous study of the ‘Baekchal’ wheatgrass variety grown under various LED light sources for seven days reported isoorientin levels of 0.8–2.5 mg g-1 (Muthusamy et al. 2020). The coefficients of determination for the quadratic regression models representing the isoorientin content per gram of dry weight and per wheatgrass plant based on different temperature conditions were 0.566 and 0.572, respectively, indicating high model reliability (Table 1). The optimal temperatures for maximizing the isoorientin content per gram of dry weight and per plant of wheatgrass were recorded as 23.636 and 25.119°C, respectively. Although there have been reports on the total flavonoid content in various wheat varieties (Adom et al. 2005), no study has proposed the optimal temperature conditions for maximizing the isoorientin content in wheatgrass. However, several studies have noted that plant growth responses to temperature follow a quadratic curve (Jung et al. 2017). Accordingly, utilizing the quadratic equation to express the isoorientin content has shown useful results. Also, quadratic curves are well suited for analyzing the maximum isoorientin level because they are mathematically clear and make it easy to find the maximum. However, it may be appropriate to use a different model equation that is asymmetric to extend the temperature range in the experiment.
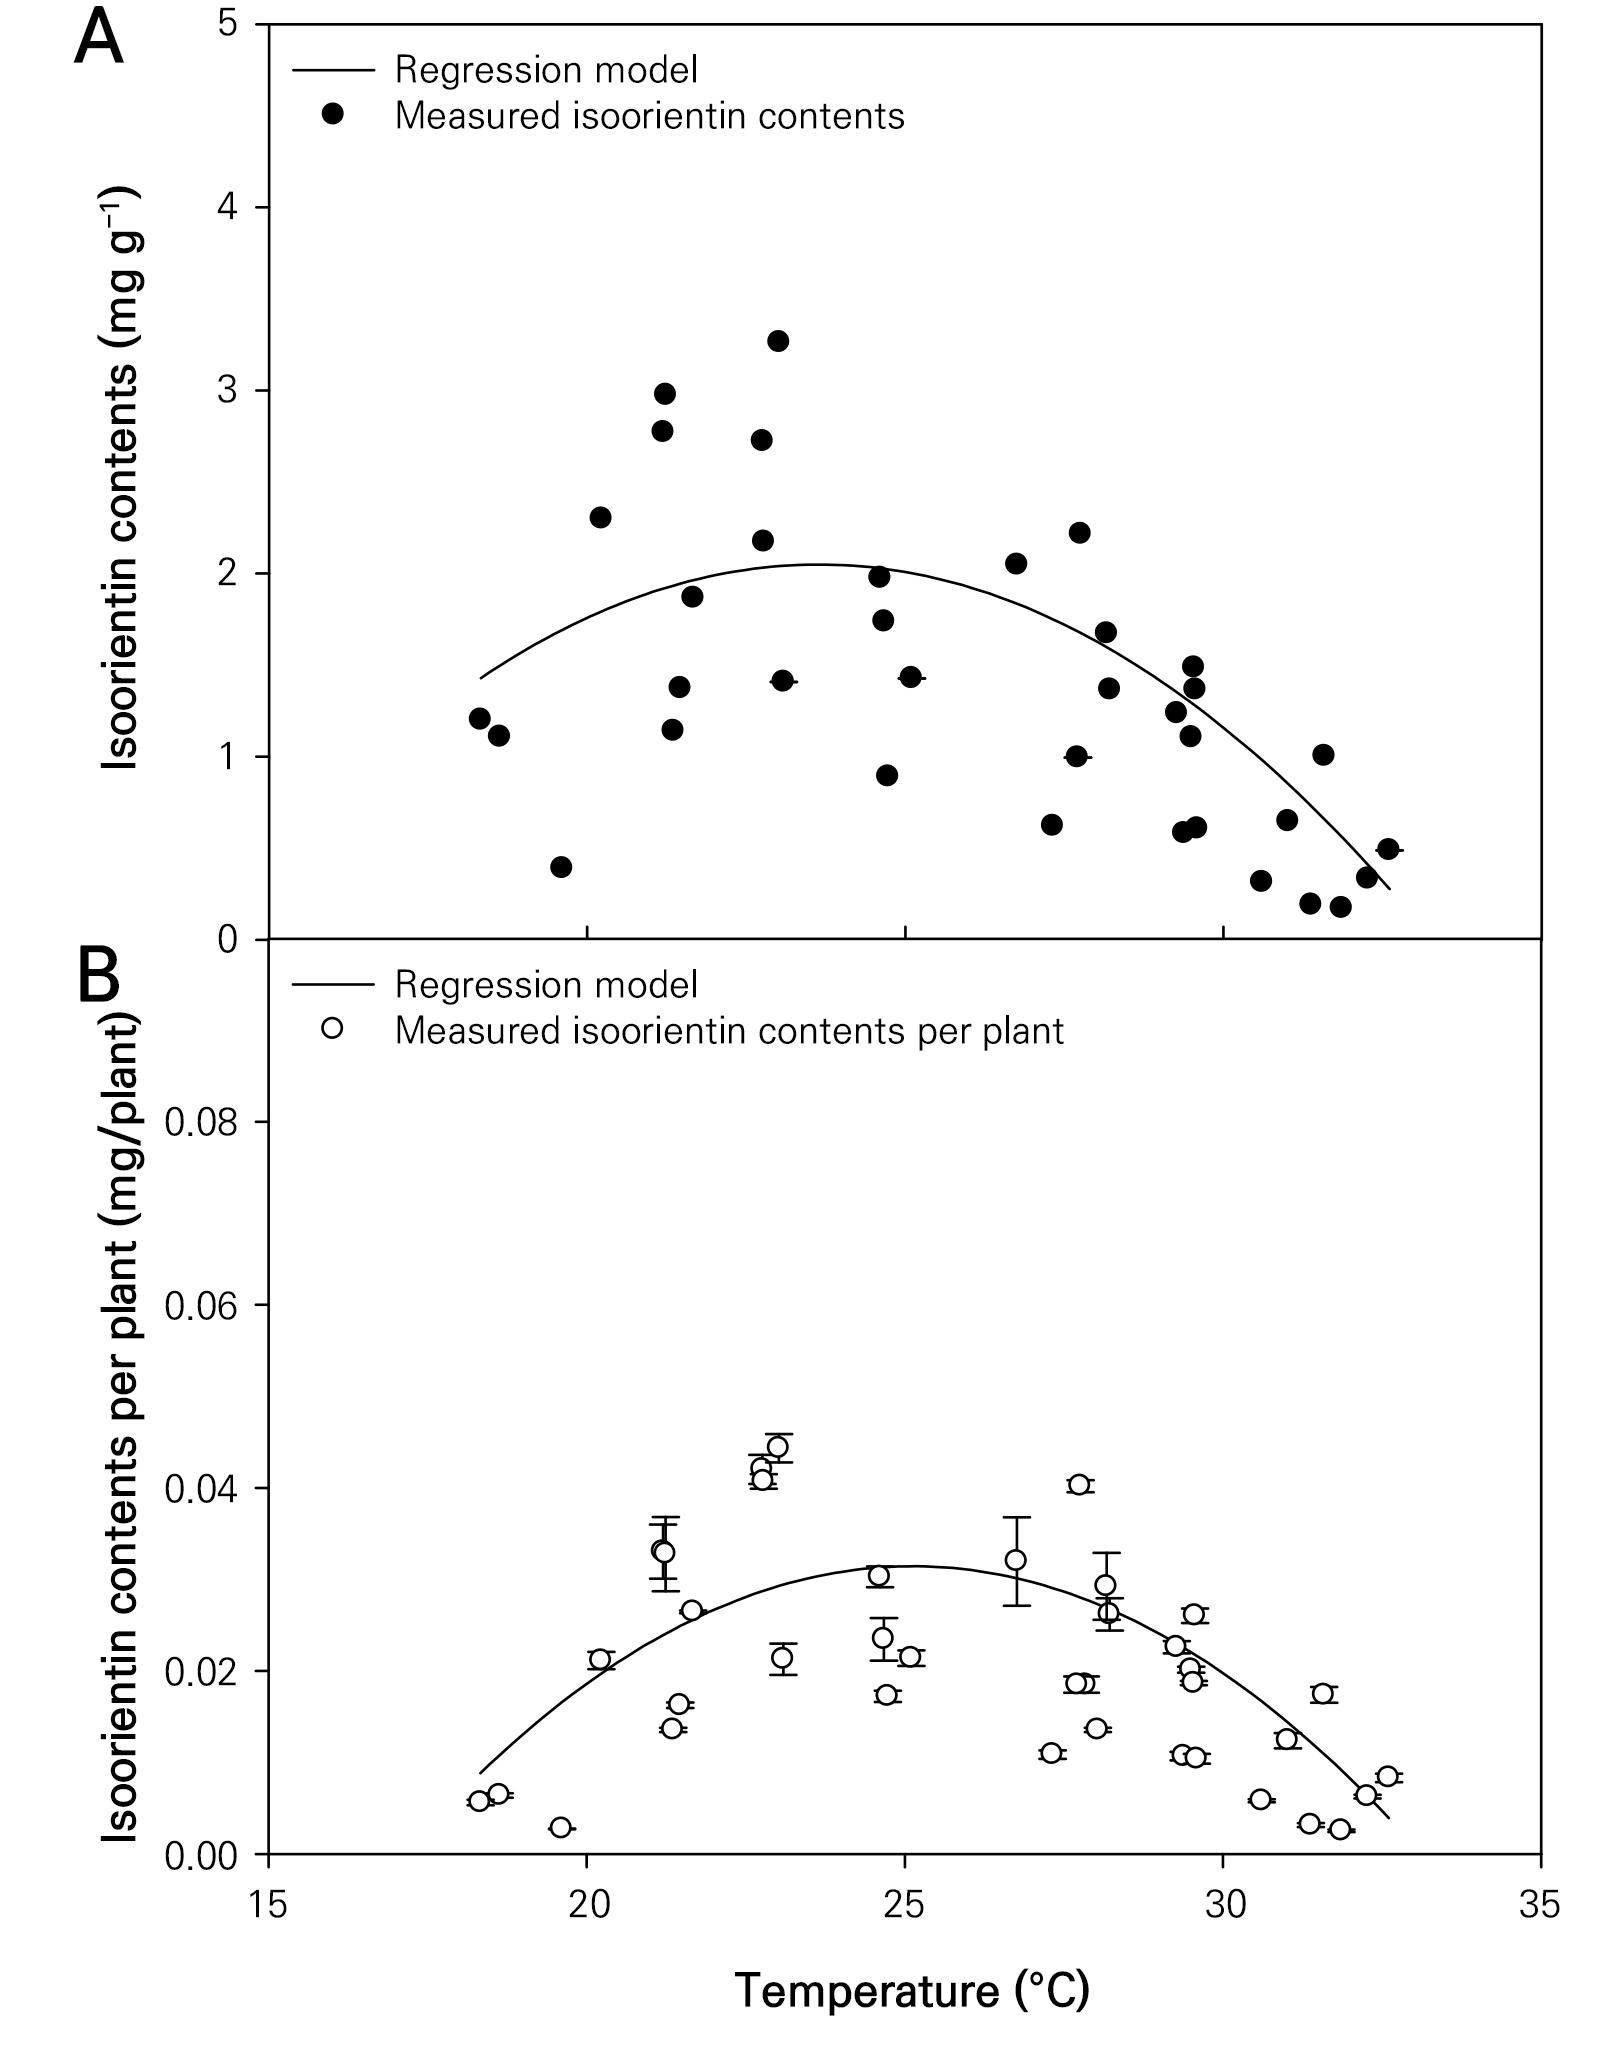
Table 1.
Regression coefficients (a, b, and c), determination coefficient (R2), root mean square error (RMSE), and optimal temperatures for quadratic regression models to estimate the growth characteristics and isoorientin contents of wheatgrass seedlings seven days after sowing
Verification results of the quadratic curve model based on different temperature conditions
The verification results of the quadratic curve model established to represent the growth characteristics of wheatgrass and the corresponding isoorientin content based on different temperature conditions showed that the highest coefficient of determination for the plant height was 0.641 (Table 2). Similar to the model establishment phase, the models estimating the fresh and dry root weights of wheatgrass were unsuitable, with coefficients of determination of 0.037 and 0.029, respectively. In contrast, the quadratic curve models representing the isoorientin content per gram of dry weight and per plant based on different temperature conditions showed high model reliability, with values of the coefficients of determination of 0.525 and 0.563, respectively.
Table 2.
Determination coefficient (R2) and root mean square error (RMSE) of validation of the quadratic regression models to estimate the growth characteristics and isoorientin contents of wheatgrass seedlings seven days after sowing
The content of isoorientin, a C-glycosylflavone, has been reported to decrease as barley sprouts grow beyond 13 days after sowing (Park et al. 2015). Moreover, the content of C-glycosylflavones has been reported to be specific to the crop and influenced by the light quality, with red light wavelengths shown to increase the isoorientin content in wheatgrass (Muthusamy et al. 2020). Moreover, it is possible to determine the cultivation conditions that maximize the isoorientin content in wheatgrass by applying the optimal light quality conditions during the growth period and the optimal growth temperature conditions obtained in this study. In conclusion, cultivating at a temperature of approximately 25°C is most suitable to maximize the isoorientin content per plant in wheatgrass. In the future, if experiments are conducted on other environmental factors that can maximize the isoorientin content, it may be possible to mass-produce isoorientin using wheat sprouts.
