

Introduction
Materials and Methods
Plant Material
Determination of Microspore Developmental Stage
Histological Observation of Anthers
Statistical Analysis
Results
Discussion
Introduction
The use of haploid and doubled haploid plants is beneficial in breeding programs particularly for the generation of homozygous lines within a short timeframe. Such plants can either be produced via the culture of microspores or anthers; however, several factors contribute towards successful haploid plant regeneration. Different plant species, or even different genotypes within the same species, respond differently to particular anther culture conditions. This phenomenon has been reported previously, such as in tomato (Solanum lycopersicum; Gresshoff and Doy, 1972; Zagorska et al., 1998), rice (Tang et al., 1998), Capsicum (Olszewska et al., 2014), and wheat (Ghaemi et al., 1993; Al-Ashkar, 2013). Thus, the innate variability of anther culture means that it is necessary to optimize the protocol/methodology for each genotype of interest as opposed to directly using a protocol/methodology that works for a different species/genotype.
One of the crucial parameters for anther culture optimization is the development stage of the microspores contained inside the anther at the time of culture (Germanà, 2011). In tomato, microspores at meiosis stage are optimal for successful haploid plant regeneration (Brasileiro et al., 1999; Bal and Abak, 2007). Furthermore, Seguí-Simarro and Nuez (2005) delimited the most responsive microspore development stages for high-level callus induction and haploid plant regeneration to between metaphase I and telophase II. Additionally, the study by Seguí-Simarro and Nuez (2007) showed that vacuolated microspores, when isolated and cultured in vitro, were suitable for direct embryogenesis. However, despite a good understanding of the microspore developmental stages suitable for culture, it remains unclear how to select appropriate tomato floral buds (FBs) with anthers containing such suitable microspores. It is possible to dissect and microscopically analyze anther from each FB prior to microspore culture; however, this approach is tedious and unpractical. Hence, a more efficient approach is to identify the genotype–specific FB morphology that is associated with the desired microspore developmental stages. Such association would also be useful for selecting FBs/flowers to carry out successful cross- and self-pollination practices as similar study on Jeju Citrus has been reported earlier (Pok et al., 2015).
The association of FB size to microspore developmental stage has been previously analyzed in a number of tomato genotypes (Summers et al., 1992; Shtereva et al., 1998; Lauxen et al., 2003; Seguí-Simarro and Nuez, 2005) and several other plant species such as soybean (Ivers et al., 1974; Lauxen et al., 2003), kenaf (Mahmood Ibrahim et al., 2014), apple (Zhang et al., 2013), pepper (Barroso et al., 2015), and tobacco (Sood et al., 2013). In tomato, a study carried out by Summers et al. (1992) showed that despite a comparable correlation between anther length and microspore development stage among different genotypes, there was a predominantly genotype-dependent association of microspore development stage to FB length. Therefore, following up on our preliminary study (Adhikari et al., 2016), here we present a more detailed study of the association of both FB size and anther length to microspore developmental stage in the commercial tomato hybrid Campari.
Campari is a cocktail tomato variety developed in Europe, which is popular worldwide among both farmers and consumers. Campari is renowned for the juiciness, high-level sugar content, low-level acidity, and lack of mealiness in its fruits. The development of homozygous lines from a
heterozygous plant is useful because it allows the analysis of plant growth, development, and economic yield. In self-pollinating crops such as tomato, F1 hybrids are developed initially and the gene recombination in its male gamete can be fixed by producing doubled haploids (Snape, 1989).
The finding of our study can be directly used to harvest Campari tomato FBs with anthers containing microspores at particular developmental stage(s) that are suitable for anther/microspore culture in order to regenerate haploid/doubled haploid plants.
Materials and Methods
Plant Material
F1 seeds of the commercial tomato cultivar ‘Campari’ were sourced from Mifko Co. Ltd. Seoul, sown in a plug-tray, and grown in pots in a glasshouse at Kangwon National University. Established seedlings were transplanted to 30 × 27 × 17 cm3 size pots filled with horticultural soil (High, Punong, Korea). Plants were watered daily and the soil was supplemented with greenhouse fertilizer, namely Poly-Feed® (11:8:34 NPK and additional 2% Mg), as required. Plants were maintained, trained, and pruned regularly to maintain a single stem morphology, and mature plants were supported by overhead strings. FBs of various lengths were collected for analysis once they began to develop.
Determination of Microspore Developmental Stage
FBs/flower length was measured from the base of the calyx to the tip of the FB. FBs/flowers, 3–19 mm in length, were collected in the early morning (7–9 am). Closed FBs were collected in bulk according to their length once open and flowers, on the verge of opening, were collected individually in microtubes (2 mL capacity). FBs/flower base diameter and anther length were also measured for the collected FBs and their corresponding anthers. Collected tissue was fixed in carnoy’s fixative (3:1 absolute ethanol and glacial acetic acid) for 6 h followed by two washes with distilled water twice and incubation in 1% acetocarmine staining solution, where it was maintained at 4°C for a minimum of 24 h. Stained tissue was then used for microscopic study of microspores (pollen grains) contained inside anthers as follows: anthers were excised and gently pressed onto a microscope slide in the presence of acetocarmine drops, then anther tissue was removed and a coverslip was placed over the remaining microspore–containing solution. The slide was then slightly heated over a lamp and gently pressed down. Prepared specimens were observed using a Leica DM1000 microscope and measurements were made at 21 different microspore developmental stages were recorded, namely interphase, leptotene, zygoneme, pachytene, diploneme, diakinesis, metaphase I, anaphase I, telophase I, prophase II, metaphase II, anaphase II, telophase II, coenocytic tetrad, tetrad, young microspore, mid microspore, vacuolated microspore, young pollen, mid pollen, and late pollen. For 4–8 mm FBs, a minimum of 19 were analyzed per defined length, whereas a minimum of three FBs were analyzed for those longer than 8 mm. The microspore developmental stage in anthers of defined lengths was assessed via observing specimens on microscope slides in three different observation fields at 400X magnification.
Histological Observation of Anthers
Freshly collected FBs were fixed in FAA (formaldehyde : glacial acetic acid : ethanol : dH2O = 4 : 5 : 50 : 41) for 12 h. Fixed tissue was washed with distilled water and excised anthers were dehydrated via a series of washes with TBA/ethanol solutions of increasing and decreasing TBA and ethanol concentrations, respectively. A final wash with 100% TBA was repeated twice. The dehydrated anthers were embedded in blocks of paraplast plus (Sigma P3683), which were cut into 8 micron sections using a Leica Reichtert-jung 2030 Rotary Microtome. Paraffin was removed from sections via a series of xylene and alcohol washes. Sectioned tissue was then stained according to the Johansen’s Safranin-O and Fast Green FCF protocol (Johansen, 1940).
Statistical Analysis
The recorded data for each of the 21 microspore developmental stages from interphase to late pollen stage were reduced that from six FBs to simplify the statistical analyses (Fig. 2). Data for the following individual developmental stages were combined to form grouped data sets: the sub-stages of prophase I, metaphase I to telophase II, coenocytic tetrad and tetrads, the three different microspore stages, and the three different pollen stages. However, for regression and correlation analysis, data for each of the individual 21 microspore developmental stages were used (Fig. 3). Due to the heterogeneity of the data, it was square root transformed before DMRT analysis (Data for Fig. 2). Additionally, separate boxplots were prepared to broadly illustrate the nature of the data (Fig. 2). The analyses were carried out using IBM SPSS version 22.0.
Results
During this study, we observed a set of 21 different microspore developmental stages, as described in the Materials and Methods, for which 18 representative stages are presented in Fig. 1. The progression of microspore development with increasing FB/anther size was obvious (Figs.1, 2, and 3); however, in comparison, FB diameter appeared to be a less reliable morphology for predicting microspore developmental stage. Although the data for FB diameter was limited, boxplot analysis revealed nominal to extreme outliers (Fig. 2).
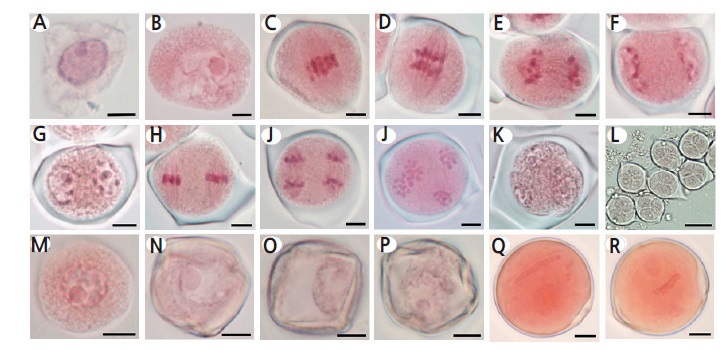
Fig. 1.
Representative images of Campari tomato microspore/pollen developmental stages. (A) Interphase, (B) Prophase I (Diakinesis), (C) Metaphase I, (D) Early Anaphase I, (E) Late Anaphase I, (F) Telophase I, (G) Prophase II, (H) Metaphase II, (I) Anaphase II, and (J) Telophase II. Tetrad: (K) Coenocytic Tetrad and (L) Tetrad. Microspore: (M) Young Microspore, (N) Mid Microspore, and (O) Vacuolated Microspore. Pollen: (P) Young Pollen, (Q) Mid Pollen, and (R) Late Pollen. Scale bars=5 μM (A–K, M–R) or 30 μM (L).
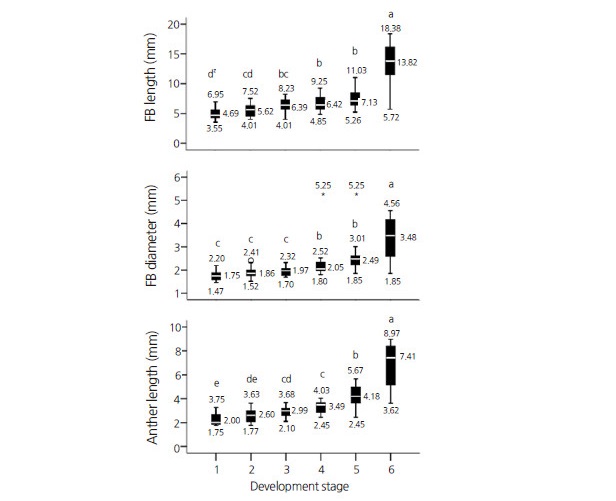
Fig. 2.
Distribution of floral buds (FBs)/anthers of different sizes within microspore/pollen developmental stages. Boxplot whiskers represent the data 5th and 95th percentiles, and the box represents the data 25th percentile, median, and 75th percentile. Median, maximum, and minimum values are shown in the graph and the latter two are italicized. Development stages: 1=pre-mitotic stage (interphase), 2=prophase I, 3=metaphase I to telophase II, 4=tetrad, 5=microspore, and 6=pollen.
Microspore development stages were identified based on cellular characteristics such as cell shape, cell number, nucleus type and position in the cell, and state of the chromosomes. Representative images of microspores at different developmental stages are depicted in Fig. 1. The end of the meiotic cycle was defined by the presence of four distinct groups of chromosomes that were not separated by membranes (Fig. 1J). Coenocytic tetrads were characterized by cell plate formation and furrowing between chromosome groups (Fig. 1K). In the tetrad developmental stage, four independent microspores with well-developed membrane structures was observed encased by callose walls (Fig. 1L), which bursts open upon microspore release. Young microspores possessed a smooth round shape (Fig. 1M) which developed into polygonal structure with a denser exine wall and a sustained central nucleus (Fig. 1N). The late microspore developmental stage was characterized by a large central vacuole that resembled an empty space (Fig. 1O). Until the late microspore developmental stage, FBs remained closed. The majority of FBs that contained young pollen grains with two round nuclei displayed an open calyx cone. The FBs of flowers with a fully opened calyx and an unfolding corolla were found to contain pollen grains at mid to late developmental stages. The mid– to late–pollen developmental stages possessed long generative nuclei whereas pollen at the late developmental stage displayed a centered generative nucleus and a denser cytoplasm (Fig. 1P, Q).
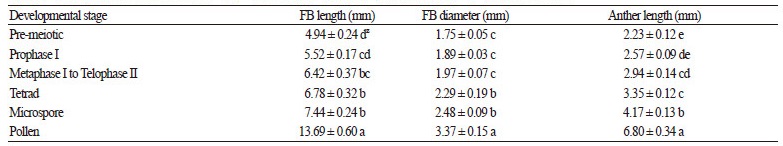
Average measurements of the FB and anther size parameters associated with particular microspore developmental stage(s) are shown in Fig. 2. Duncan’s multiple range test (DMRT) analysis of the data showed that FB diameter categorized the developmental stages into three distinct groups, whereas FB and anther length resulted in four and five significantly distinct groups, respectively (p ≤ 0.05, DMRT; Fig. 2). This difference in developmental stage categorization may be the results of the smaller values for FB diameters as compared to those for FB and anther length. Though the average values were different, no statistical difference was observed between the measured FB/anther size parameters associated with pre-meiotic microspores and those at prophase I. This result may have occurred because the data does not represent FBs shorter than 3 mm. Furthermore, no significant differences was observed between the measured FB/anther size parameters associated with prophase I and metaphase I to telophase II groups. However, as opposed to FB diameter, significant differences were observed for both FB length and anther length associated with microspores at pre-meiotic and metaphase I to telophase II developmental stages. Average FB and anther length at the latter stage was 6.42 mm and 2.94 mm, respectively. Similarly, their respective median values were 6.39 mm and 2.99 mm (Fig. 2A, C), which is similar to the aforementioned mean values. On the other hand, an equal mean and median value of 1.97 mm resulted for FB diameter associated with the same developmental stages. Boxplot analysis also shows the presence of some nominal to extreme outliers for FB diameter which were not observed for FB and anther length.
The study also showed that the maximum FB length/diameter and anther length values for microspores at the pre-meiotic developmental stage remained higher than the respective average values for microspores at the tetrad developmental stage (Fig. 2). This may be because anthers of a particular length contain microspores at different developmental stages (maximum of 4 subsequent developing stages per anther) and the data were of a non-parametric nature. However, except for microspores at the pre-meiotic developmental stage, the proportion of those exhibiting individual development stages in FBs and anthers of a certain size was highest around their mean and median values (data not shown).
Due to the presence of microspores at different developmental stages in the same anther, histological observation was carried out. This revealed that microspores at different developmental stages in longitudinal sections (LSs) but not transverse sections (TSs; Fig. 3). Moreover, LSs showed that developing microspores situated in the middle of the anther were more mature than those at either anther extremity.
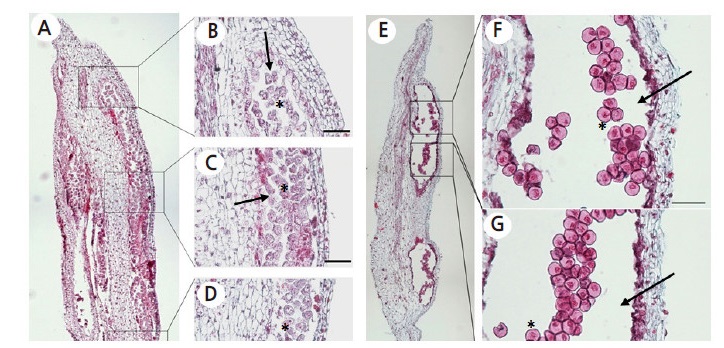
Fig. 3.
Observation of spatial variation in microspore development within an anther. (A) Longitudinal section of a tomato anther from a 5 mm floral bud (FB), depicting microspores at pre-meiotic interphase to prophase I. (B and D) Microspore mother cells (MMCs) at interphase. (C) MMCs at interphase to different stages of prophase I. (E) Transverse section of a tomato anther from a 9 mm FB, depicting microspores exclusively at vacuolated stage (F and G). Anther sacs are indicated with arrows and representative microspores are marked with asterisks.
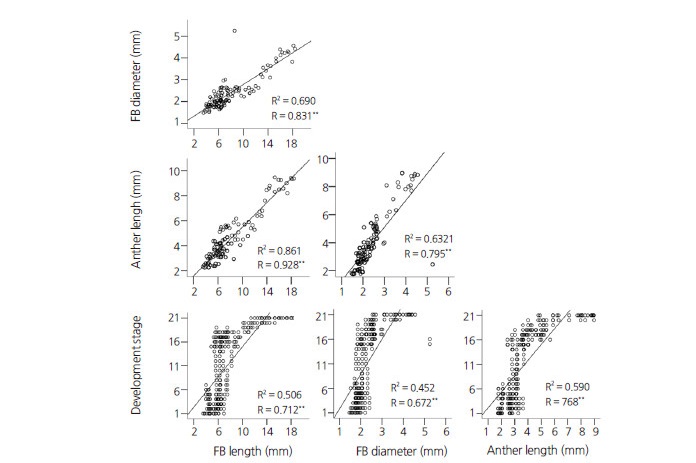
Fig. 4.
Regression (R2) and correlation (R) between flower/anther characteristics and microspore development. Respective R2 and R values are depicted in each graph. For the analysis, floral bud (FB) and anther size data for each of 21 microspore developmental stages were used. The stages observed were 1=pre-meiotic stage (interphase), 2=leptotene, 3=zygoneme, 4=pachytene, 5=diploneme, 6=diakinesis, 7=metaphase I, 8=anaphase I, 9=telophase I, 10=prophase II, 11=metaphase II, 12=anaphase II, 13=telophase II, 14=coenocytic tetrad, 15=tetrad, 16=young microspore, 17=mid microspore, 18=vacuolated microspore, 19=young pollen, 20=mid pollen, and 21=late pollen. n ≤ 145, **p ≤ 0.001.
Further regression and correlation analysis revealed a linear relationship and a strong positive correlation (p ≤ 0.001, Fig. 4) between the studied size parameters and the progression of microspore development. However, unlike other FB and anther length, severe outlier data points were associated with FB diameter, even though the data pool for FB diameter was comparably less. The greater representation of lower size measurements in the data was primarily because more FBs/anthers were collected in that size range. A greater number of smaller FBs/anthers were collected because multiple microspore developmental stages were observed within a narrow size ranges (Fig. 4).
Discussion
The regeneration of haploid and doubled haploid plants via anther/microspore culture results in homozygous lines within a shorter time period and with less labor and cost requirement as compared to the conventional practice of inbreeding and selection (Snape, 1989; Maluszynski et al., 2003). For successful androgenesis, the fate of microspores/pollen grains is altered, and induced to develop following a sporophytic rather than the usual gametophytic pathway. Thus, identifying responsive microspore/pollen developmental stages is crucial for successful anther culture.
In tomato anther culture, it has been proposed that the most ideal microspore developmental stage for callus induction is between metaphase I and telophase II (Seguí-Simarro and Nuez, 2005). In an additional study, Seguí-Simarro and Nuez (2007) also reported that vacuolated microspores were responsive androgenesis treatments, and that direct embryogenesis resulted following their isolation and in vitro culture. Hence, the collection of anthers harboring microspores at these defined developmental stages is crucial for successful haploid/doubled haploid regeneration. Here, our results with Campari tomato revealed a strong positive correlation between the studied FB/anther size parameters and the progression of microspore development. Additionally, this correlation was strongest for anther length followed by FB length and finally FB diameter, which indicates that anther length is the optimal predictor of microspore developmental stage. FB diameter is the least reliable morphological predictor of microspore development because of a number of nominal to extreme outliers that were revealed following box plot analysis. Previously, Summers et al. (1992) also reported that anther length was a better predictive trait compared to FB length in three different tomato cultivars. That study also showed that microspore development commenced (prophase I stage) and ended (late microspore stage) in FBs and anthers with a short range of length (5.62–7.13 mm and 2.60–4.38 mm, respectively). However, our earlier preliminary study that employed a smaller sample size showed that FBs approximately 4, 5, and 6 mm in length encompassed microspores at metaphase I, tetrad, and young microspore developmental stages (Adhikari et al., 2016). Since the box plot analysis in this present study clearly indicates that FBs 4.01–8.25 mm, 4.85–9.25 mm, and 5.26–11.05 in length can contain microspores at specific developmental stages, our current larger data set does not contradict our earlier results, but rather expands the range of FB sizes associated with each microspore developmental stage.
Assuming that metaphase I to telophase II is the ideal microspore developmental stage for indirect regeneration during tomato anther culture, the optimal average values for Campari tomato FB length, FB diameter, and anther length are approximately 6.42, 1.97, and 2.94 mm, respectively. However, our anther culture study showed that anthers from 4–5 mm Campari FBs were more responsive compared to those FBs of alternate lengths (Adhikari et al., 2016). In light of the results from present study, Campari anthers containing microspores at the prophase I developmental stage are apparently are more responsive. This may be the result of either the disparity in FB anther collection in terms of size during the anther culture experiment or because the phrophase I microspore responsiveness in Campari tomato is different than that of other genotypes. This latter hypothesis is supported by an earlier study by Summers et al. (1992), which also reported that prophase I was the responsive development stage for callus induction using anthers from three different tomato genotypes. Furthermore, in another study using different tomato genotypes, including hybrids, Motallebi-Azar (2010) reported indirect regeneration from anthers containing microspores at developmental stages ranging from prophase I to metaphase.
Additionally, our histological observations of anther longitudinal sections showed that microspore development in the middle of the anther was more advanced than that at either anther extremity. This is in agreement with the earlier report of Moens (1964) who also reported a similar disparity among developing microspores within a single anther, with further developed microspores located at the anther center compared to those at the anther ends. This phenomenon explains our observations that various microspore developmental stages were present in FBs/anthers of a particular size. Conversely, no such variation in microspore development was observed in anther transverse sections. This suggests that microspores from the same anther may possess a varied responsiveness concerning indirect regeneration which would depend on their developmental stage.
Overall, the correlation between FB size and microspore developmental stage in Campari tomato that we observed in the present study is in agreement with previous similar reports focused on different tomato genotypes (Seguí-Simarro and Nuez, 2005; Summers et al., 1992; Shtereva et al., 1998). Whereas the specific size parameters may vary between genotypes (Summers et al., 1992; Zagorska et al., 1998), our findings can be applied to identify similar associations between FB/anther morphology and optimal microspore developmental stages in other commercial and non-commercial heterogeneous tomato varieties and cultivars, including market-class tomatoes. As tomato is recalcitrant to androgenesis (Seguí-Simarro et al., 2011), and the selection of FBs harboring microspores at optimal developmental stages is crucial for this process (Shtereva et al., 1998; Seguí-Simarro and Nuez, 2005), our findings may improve the efficiency of such endeavors. The techniques we used to establish the association between the microspore development stages and FB size may also be useful to narrow down the stages of pollen degeneration in male sterile plants. Such practice has earlier been reported in eggplant (Khan et al., 2015).
An association between microspore developmental stage and quantifiable morphological traits is imperative for practical anther culture. The present study demonstrated a strong correlation between FB/anther size and the progression of microspore developmental. Moreover, the study showed that anther length predicted the microspore developmental stage more reliably than other FB size parameters. These findings can be directly applied for the specific collection of Campari tomato FBs/anthers harboring microspores at particular developmental stages. Hence, application of this novel knowledge while performing anther/microspore culture or any other tissue analysis may make tomato breeding programs more economical regarding both time and cost.
