

Introduction
Material and Methods
Research Site
Plant Culture
Experimental Design
Observation and Data Collection
Biochemical Assessments
Statistical Analysis
Results
Yield and Mean Fruit Weight
Effect of Within-row Plant Spacing on Fruit Quality
Effect of the Treatments on Fruit Quality
Discussion
Introduction
Rockmelon (also known as cantaloupe or muskmelon; Cucumis melo L.) is a member of the Cucurbitaceae family. Its fruit are rich in beta-carotene, vitamin C, and bioactive compounds that are beneficial to human health (Lester and Hodges, 2008). Rockmelon was first introduced in Malaysia in 2000. Since then (2006 to 2011), a more than 4-fold increase in arrearage land (from 335.2 to 1,492 ha) was used for rockmelon plantations (source from Department of Agriculture, Peninsular Malaysia, 2011). Rockmelon cultivation started to gain attention in Malaysia due to its high demand in local and international markets. The ‘Glamour’ rockmelon (known locally as ‘Golden Langkawi’) is the most popular type in Malaysia.
The yield of crops can be increased by elevating the plant population by means of plant spacing and density. In a recent study on sweet corn by Williams II (2012), higher-yielding hybrids generally performed best at higher plant densities. Baron et al. (2006) showed that hybrid, population density, and row spacing interacted to influence whole-plant yield. Subsequently, in a study on pumpkin (Cucurbita spp.), increasing plant populations from 4,780 to 9,560 plants per ha resulted in greater fruit number and yield for all tested genotypes (El-Hamed and Elwan, 2011). The planting density of rockmelon has a large influence on yield, quality, and fruit size. Studies have shown that 1 to 3 plants per m is the optimal density to obtain the highest return from a muskmelon fruit (Zahara, 1972; Nerson et al., 1984; Maynard and Scoot, 1998). As the plant density increased from 3,074 to 10,764 plants per ha, the yield and number of muskmelon fruit per ha generally increased (Maynard and Scott, 1998). Similarly, a study by Bhella (1985a) on Classic and Burpee Hybrid muskmelons in Indiana, USA reported that with increased plant spacing from 25 cm to 100 cm, yield per plant, number of fruits per plant, fruit weight, and soluble solids increased, whereas dry matter and marketable fruit per ha decreased.
The effects of plant density on fruit yield are well documented and have been the subjects of ample mathematic modelling. However, these descriptive models cannot be accurately used in predictions for high-yielding varieties, which are morphologically different compared to older varieties (Maynard and Scott, 1998). Moreover, recommendations for rockmelon field populations differ by region. The In Europe, the recommended planting density for melons is higher, ranging from 13,000 to 16,000 plants per ha, while in America, planting densities in the range of 4,000 to 9,000 plants per ha (Davis and Meinert, 1965; Brinen et al., 1979) are optimal for high fruit yield. The concentration of soluble solids (sugar) is extremely important for the sweetness quality of rockmelon fruit. According to the standard of the US Department of Agriculture (USDA), a high quality rockmelon fruit has between 9% to 11% of soluble solids (Rubatzky and Yamaguchi, 1997). A negative correlation has been observed between soluble solids content and plant density. Bhella (1985a) reported a decrease in soluble solids content when plant spacing decreased from 1.0 to 0.25 m (3,600 to 14,500 plants/ha). Similarly, the content of soluble solids in muskmelon decreases when grown at higher densities, in the range of 2.0 to 8.0 plants per m2 (Mendlinger, 1994). On the other hand, Kultur et al. (2001) reported no difference in soluble solids content of muskmelon fruit grown at 3.6 and 7.3 plants per m2.
In Malaysia, melons (rockmelons, watermelons, and honeydew) are best planted at soil temperatures between 25°C and 32°C in two seasons, from March to May, and July to September (Muhammad and Nik Mohd Masdek, 2016). Melon production occupied almost 7.1% of agro-food land in Malaysia (equivalent to 13,814 ha), producing about 220,226 metric tons in 2014 Should be (MAAI, 2015). However, the demand for melon in Malaysia is relatively high and rockmelon production is insufficient to meet this demand, especially in the states of Perak and Selangor (Rasmuna et al., 2015). The declaration of the National Agro-food Policy in Malaysia on September 2011 emphasized on the exploitation of potential fruits and the strengthening of market networks. Melons can be commercially produced for export, and have the potential to be expanded to new markets. In Malaysia, the majority of melon farmers are still operating with outdated technology in terms of postharvest handling, fertilizer, cultivation, water management, and agronomic management practices. Cultivating rockmelons through fertigation in Malaysia is gaining popularity, which involves a system of delivering nutrients dissolved directly into the irrigation lines into a soilless media for the improvement of melon quality and yield.
Although studies on the effect plant spacing has on the yield of rockmelon have been reported, studies using drip irrigation in a commercial ventilated greenhouse with fixed fruit setting have not been reported. Therefore, the present study was designed to determine the influence of within-row plant spacing and fruit set position and number of fruits on yield in ‘Glamour’ rockmelon. In addition, we also analysed fruit quality using various nutritional and biochemical assays.
Material and Methods
Research Site
The experiment was conducted in a greenhouse located in a commercial farm (2°56'N, 101º54'E) at Broga, Negeri Sembilan, Malaysia from November 2014 to January 2015. ‘Glamour’ rockmelon plants were grown using fertigation in a soilless medium (coco peat) in an enclosed greenhouse (250 m2) equipped with a ventilating fan.
Plant Culture
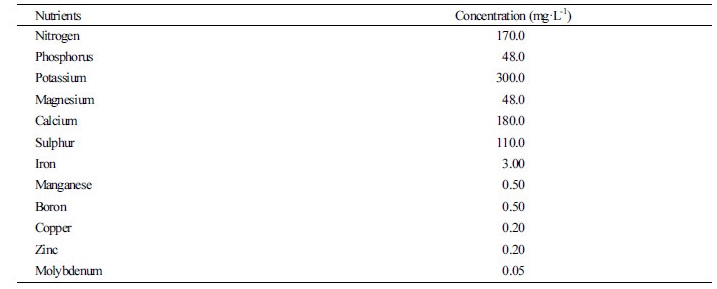
Rockmelon seeds (Cucumis melo L ‘Glamour’) were sown individually in peat moss in seedling trays. Trays were watered twice daily until 10% leakage from the tray to ensure healthy seed germination and growth. Fourteen-day-old seedlings were transplanted into 25-cm diameter white polyethylene bags on 18 November, 2014 with coco peat medium. The polyethylene bags were arranged at 1.57 m between rows. After transplanting, plants were drip irrigated every day with modified Steiner Nutrient Solution (the nutrient composition is shown in Table 1). The irrigation schedule was programmed using an electronic timer. Irrigation was applied 6 times per day with about 333.35 mL every 4 hours. Seedlings were drip irrigated with 2 L of nutrient solution every day. Additional water was applied via drip irrigation as a supplement for plants during hot weather (about 35-40°C).
Experimental Design
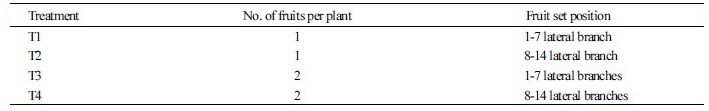
Three different within-row spacings were used, 0.15, 0.30, and 0.60 m, which were equivalent to plant densities of 4, 2, and 1 plants per m2, respectively (El-Hamed and Elwan, 2011; Maynard and Scoot, 1998). Plant density treatments were arranged in a split-plot design. Fruit set position and number of fruits per plant were fixed and categorized into 4 different treatments (Table 2). Treatment 1 (T1): Fruit set was positioned at 1st - 7th nodes on a lateral branch and one fruit per plant was retained. Treatment 2 (T2): Fruit set was positioned at 8th - 14th nodes on a lateral branch with only one fruit per plant. Treatment 3 (T3): Fruit set was positioned at 1st - 7th nodes on a lateral branch and two fruits per plant were retained. Treatment 4 (T4): Fruit set was positioned at 8th - 14th nodes on a lateral branch and two fruits per plant were retained. All other lateral branches were removed after fruit set.
Table 2. Four different treatments used on the plants grown at three different within-row plant spacings (0.15, 0.30, and
0.60 m)
 |
Observation and Data Collection
Melons were harvested when the fruit ripened and were easily detached from the vines (Paris et al., 2012). To maintain the consistency of the experimental data, all rockmelon fruits were harvested on 31January, 2015, after approximately 2.5 months after being transplanted onto the coco peat media. After harvesting, the fruit yield per ha was measured. Fruit fresh weight, dry weight, total soluble solids (TSS), pH, electrical conductivity (EC), titratable acidity (TA), ascorbic acid content, calcium content, total phenolic content, total carbohydrate content, and protein (%) were determined. Three melons from each treatment were used for analysis. The juice of rockmelons was extracted using a handheld plant sap press (Spectrum Technologies, Inc., USA). All analyses were performed in triplicate.
Biochemical Assessments
Prior to analysis, the fruit were divided into fresh samples and dried samples. Fresh samples were used to determine TSS, TA, pH, EC, ascorbic acid content, and calcium content, while dried samples were used for total phenolic content, total carbohydrate content, and protein analysis. For dried samples, fruit were cut into small cubes and dried in an oven at 80°C for 48 h to a constant weight. Dried samples were then ground to a powder using a mortar and pestle. Dry weight (DW) percentage was calculated using the formula shown below (Lee and Coggins, 1982):
Dry weight percentage = | weight of dried fruit plus container (g) – weight of container | × 100% |
weight of fresh fruit plus container (g) – weight of container |
TSS was measured with a hand-held refractometer (Model REF 113ATC, Spectrum Technologies, Inc., USA). A few drops of rockmelon juice were placed on the glass surface of the refractometer and the refractive index (°Brix) was measured. The pH was measured with a twin compact pH meter (Horiba, Japan). A compact conductivity meter (Model B-173, Horiba, Japan) was used for the EC measurement. A LAQUA twin compact calcium ion meter (Model B-751) was used to measure the calcium content in rockmelon fruit juice.
TA was assayed by potentiometric titration, whereby 10 mL of rockmelon juice was titrated with 0.1 mol·L-1 NaOH until the end point reached pH 8.2. TA was expressed as percentage of citric acid. Vitamin C content was determined by the 2,6-dichloroindophenol titrimetric method. One g fresh sample was ground in 10 mL of meta-phosphoric acetic acid solution. The mixture was filtered and centrifuged and sample extracts were immediately used for ascorbic acid determination. Two mL of the extract and 5 mL of meta-phosphoric acetic acid were mixed and titrated with 2,6-dichloroindophenol dye solution until a light rose-pink colour persisted for 5 s. The ascorbic acid content was expressed as mg/100 g on a fresh weight basis.
Total carbohydrate content was determined using the anthrone method as described by Dubios et al. (1956). Approximately 0.5 g of dried rockmelon sample was ground with liquid nitrogen and 10 mL of 1 N sulphuric acid was added. The mixture was heated in an oven at 100°C for 4 h. Then, 1 mL of the mixture was chilled and 2 mL of 75% sulphuric acid solution was added and mixed by vortexing. Lastly, 4 mL of chilled anthrone reagent was added and mixed well. The solution was then transferred immediately to a 95°C water bath for 15 minutes and allowed to cool to room temperature. Absorbance was measured at 578 nm. The total carbohydrate content was expressed as glucose equivalent in g GE 100 g-1 on a dry weight basis.
The total phenolic content was determined using Folin-Ciocalteu’s Reagent (FCR) and calculated using gallic acid as a standard. The total phenolic content was determined according to Norrizah et al. (2012) with some modifications. Approximately 0.3 mL of sample was mixed with 1.5 mL 50% FCR. Then, 1.2 mL of 20% sodium carbonate was added and mixed well and allowed to stand in the dark for 2 h. Absorbance was measured at 765 nm and the total phenolic content was expressed on a dry weight basis as mg/100 g gallic acid equivalent (GAE).
Total nitrogen concentration of rockmelon was analysed by the Kjeldahl method. The protein conversion factor 6.25 was used to calculate the protein content as shown in the equation below (Douglas et al., 2000):
Protein (%) = protein N × 6.25
Statistical Analysis
All data collected were subjected to analysis of variance (ANOVA) using IBM SPSS Statistics Software, Version 22.0, New York, USA. Means of the different treatments were separated by Tukey's honestly significant difference (HSD) test set at p≤0.05 to determine statistical significance.
Results
Yield and Mean Fruit Weight
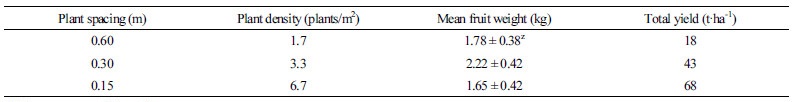
Within-row plant spacing showed a clear and significant effect on total yield, indicating that total yield per ha increased linearly with decreasing plant spacing (Table 3). The within-row plant spacing of 0.15 m resulted in the highest total yield with 68 t·ha-1 as compare to 0.60 m with only 18 t·ha-1.
The within-row plant spacing in rockmelon showed a significant effect on mean fruit weight. The average fruit weight increased linearly as plant spacing increased from 0.15 m to 0.30 m, but dropped at 0.60 m. The average fruit weight ranged from 1.65 ± 0.42 kg to 2.22 ± 0.42 kg. According to Cabello et al. (2009), melon fruits are considered marketable if there are no visual defects and the fruit weigh more than 1 kg. Thus, all three within-row spacings used in this study produced marketable yields with > 1.5 kg per fruit.
Table 3. Effects of within-row plant spacing on fruit yield and mean fruit weight
 | |
zValues are mean ± SD, n=12. Three fruits were measured for each treatment (T1, T2, T3, and T4) at each plant spacing. | |
Effect of Within-row Plant Spacing on Fruit Quality
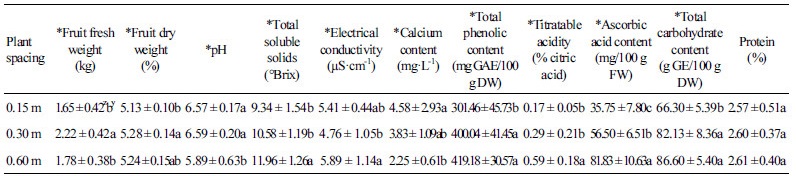
Plant spacing significantly (p ≤ 0.05) affected all of the fruit quality measurements except for protein percentage (Table 4). TSS, EC, ascorbic acid content, total carbohydrate content, and total phenolic content increased linearly as within-row plant spacing increased. Fruit from the 0.60-m spacing exhibited the highest TSS (11.16 ± 1.26°Brix), followed by 0.3 m (10.58 ± 1.19°Brix), and 0.15 m (9.34 ± 1.54°Brix). On the other hand, the 0.60-m within-row plant spacing produced good fruit quality in term of EC (5.89 ± 1.14 ms), pH (5.89 ± 0.63), dry weight (5.24 ± 0.15%), total carbohydrate content (86.60 ± 5.40 mg/100 g DW), and total phenolic content (419.18 ± 30.57 mg/100 g DW). Within-row plant spacing at 0.60 m produced the highest ascorbic acid content (81.83 ± 10.63 mg/100 g FW). On average, the ascorbic acid content of rockmelon increased by about 50% from the 0.15-m spacing to the 0.60-m spacing.
Effect of the Treatments on Fruit Quality
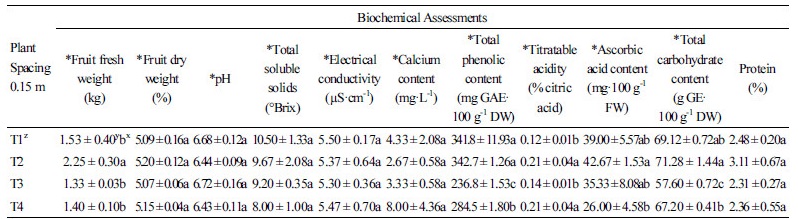
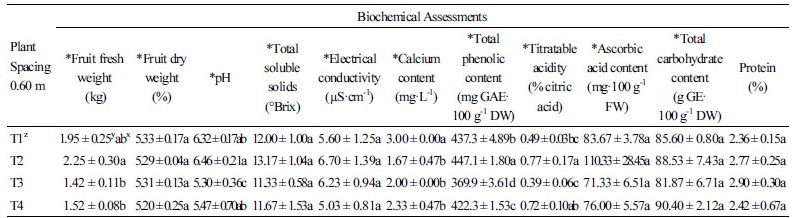
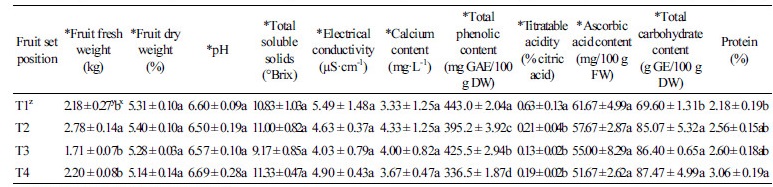
The interaction of 0.30-m plant spacing with treatments 1, 2, 3, and 4 is shown in Table 5 (for the interaction between 0.15-m and 0.60-m plant spacing with the treatments, refer to Table S1 and Table S2, respectively). Average fresh fruit weight, total phenolic content, TA, total carbohydrate content, and percentage of protein were significantly affected by the interaction between within-row plant spacing and the 4 different treatments. The mean fresh fruit weight increased significantly (p ≤ 0.05) from T1 to T2 and from T3 to T4. T2 had a higher average fruit weight compared to T1, T3, and T4 (Table 5). T2 had the highest average fruit weight of 2.78 ± 0.14 kg compared to the other three treatments. T2 showed that one fruit per plant in a higher fruit-set position produced a higher average fruit weight. However, T4 produced two fruits with an average fresh fruit weight of 2.20 ± 0.08 kg/fruit, is more economical and beneficial to farmers.
For total phenolic content, T1 produced the highest amount of 443.0 ± 2.04 mg GAE/100 g DW, followed by T3, T2, and T4. This result revealed that the accumulation of total phenolic content is affected by the location of fruit set (1-7 lateral branch > 8-14 lateral branch) more than the number of fruits per plant. For TA, T1 had the highest percentage of citric acid (0.63 ± 0.13%), followed by T2, T3, and T4, with no significant difference among them. On the other hand, total carbohydrate content was higher in fruit in T2, T3, and T4, as compared to T1. The highest protein percentage was found in T4 at 3.06 ± 0.19%. No significant differences were found in term of dry weight (%), pH, TSS content, EC, calcium content, and ascorbic acid content among the different treatments.
Discussion
The yield and quality of ‘Glamour’ rockmelon were affected by within-row plant spacing (0.60, 0.30, and 0.15 m). The within-row plant spacing affects many attributes of rockmelon quality such as mean fruit weight, dry weight percentage, pH, TSS, EC, calcium content, total phenolic content, TA, vitamin C content, and total carbohydrate content. In this study, the highest total yield of rockmelon was observed at the 0.15-m spacing with 68 t·ha-1, demonstrating that as within-row plant spacing decreased, yield per ha increased. These results coincided with the report of Ban et al. (2006) who obtained a higher yield of melon with decreased plant spacing. Greater yield per ha at narrower spacing was a result of more plants per unit area. However, Bhella (1985b) reported that plant density only slightly effected yield per ha on vining-type muskmelons. According to his study, as within-row plant spacing increased from 25 cm to 100 cm, the number of fruits per plant increased, but the fruit fresh weight increased only slightly, which had little effect on yield per ha.
According to Knavel (1988) and Kultur et al. (2001), when abiotic factors, such as temperature, light, and water, were fulfilled, cultivar type seldom influenced vegetative growth, which mainly depends on planting distance. The differences among plants are only observable when plants are fully developed, when there is more competition for nutrients and water. Decreasing within-row plant spacing (or increasing plant density) resulted in an increased number of plants per unit area but reduced yield (t·ha-1) (Kultur et al., 2001; Ban et al., 2006). Although most of the studies showed that increased plant density resulted in little effect on yield; nevertheless, in the present study, yield was the highest at a within-row plant spacing of 0.15 m. This might be due to the fixed-fruit setting used in this study, which limited the number of fruits per plant in all treatments.
‘Glamour’ rockmelon showed significant differences in mean fruit weight in all 3 plant spacings used (0.15, 0.30, and 0.60 m; Table 4). The 0.3-m plant spacing is considered moderate, and produced the highest mean fresh weight (2.22 ± 0.42 kg). Although Kulter et al. (2001) stated that wider spacing (70 cm) between plants reduces plant competition and produces greater mean fruit weight, our study showed that the 0.30-m within-row spacing obtained better fruit weight than the 0.60-m spacing, and no significant effect on fruit weight was observed between 0.15-m and 0.6-m within-row plant spacing. In higher plant densities, upper leaves shade the lower leaves, presumably reducing the plant’s photosynthetic capacity, leading to some noticeable chlorosis. When the number of leaves in rockmelon plants is reduced, smaller fruit is produced due to a lower ability to produce photosynthates. At narrower plant spacing, the area available for plant development is smaller; hence, plants compete with each other for nutrients, water, and light, leading to the development of smaller fruits (Davis and Meinert, 1965; Knavel, 1988; Maynard and Scott, 1998).
The within-row plant spacing of 0.6 m (low plant density) in this study was expected to produce the highest mean fruit weight, but this was not the case. Kanvel (1988) demonstrated that as within-row plant spacing of short-internode muskmelon increased from 45 cm to 90 cm, the fruit number and yield per plant increased. Similarly, a few studies also showed that as within-row spacing increased, yield per plant, number of fruits per plant, weight per fruit, and percentage of soluble solids similarly increased (Bhella, 1985b; Mendlinger, 1994; Maynard and Scott, 1998). According to Rodriguez et al. (2007), the mean fruit size of ‘Galia’ muskmelon was not affected by plant density during the fall, but was reduced linearly during the spring as the plant density increased.
In our experiment, the nutrient solution (Table 1) was supplied using drip irrigation in a coco peat medium. We observed that the number of leaves, the length of lateral branches, and the overall biomass of the plants at the 0.60-m spacing were higher compared to the 0.30-m or 0.15-m spacing. Therefore, although the 0.60-m spacing reduced plant competition, the photoassimilates produced were not directed to produce heavier fruit, but an increase in the total plant biomass was observed. This study demonstrated that when nutrients and water were in good supply, the plants diverted the photoassimilates towards overall plant growth rather than to conserve the nutrients for the fruit.
When within-row plant spacing was fixed at 0.3 m and the effects of different treatments were analysed, plants with one fruit set at 8-14 lateral branch (T2) gave the heaviest mean fruit weight of 2.78 ± 0.14 kg (Table 5). When compared to T1 and T2 with only one fruit per plant, T3 and T4 produced two fruits per plant with an average of 1.71 ± 0.07 kg and 2.20 ± 0.08 kg per plant, respectively. No significant difference in fresh weight per fruit was observed among T1, T3, and T4, demonstrating that the fresh weights of fruits are independent of nodal location and the number of fruits per lateral branch. Kamiya (1969) reported that the size and quality of melon fruit is greatly affected by the position of fruit set. Fruit grown at the lower position of the stems were smaller and sweeter compared to those on the higher position. Seabra et al. (2003) reported that the competition between vegetative and reproductive tissues for sugar increased when the fruit set position was near the base of plant, especially if the leaf area was smaller during fruit set. Thus, a higher fruit setting position reduces the competition between vegetative and reproductive growth, and consequently increases the assimilation of sugar in the fruit (Syn et al., 1991).
Many markets prefer large rockmelon fruit. One fruit per plant had a heavier fruit weight (T2) as compared to two fruit per plant when fruits were set at 8–14 lateral branches (Table 5). Fagan et al. (2006) found that ‘Torreon’ cantaloupe with one fruit per plant had a larger fruit diameter as compared with plants with two fruit. According to the authors, the demand for nutrient assimilation in the fruit was strongly increased and the competition between fruit was higher as the density of fruit per plant increased. Moreover, the newly emerged fruit competes with the existing fruit for assimilation (Valantin et al., 1999). Additionally, in a study by Higashy et al. (1999) on histological analysis of fruit development, the size of fruit is determined by cell division, where a plant with two fruit had smaller sized fruit due to the lower number of cells formed in the pericarp tissue during cell division to reduce the competition for assimilates. The mean fruit weight was higher when the location of fruit set was at 8-14 lateral branch, regardless of the number of fruits fixed in the experiment (T2 and T4) (Table 5); demonstrating the advantages of fruit setting at a higher location. According to Barni et al. (2003), plant cultivation with one fruit at a higher fruit set position (15to 18 nodes) provides greater leaf area per fruit and lowers the competition for photosynthates between vegetative organs, which increases the assimilation of nutrients from leaves to fruit and hence, increases fruit mass.
For fruit quality, wider plant spacing (0.6 m) produced fruit with better nutritional values. Total phenolic content was the highest at the 0.6-m within-row plant spacing and no significant difference was observed between the 0.6-m and 0.3-m plant spacing. For fruit set position, total phenolic content was higher at the lower fruit set position (T1 and T3) as shown in Table 5. Bangerth and Ho (1984) reported that during the normal development of fruit, the sink strength of proximal fruit is greater than that of distal fruit in tomato. Hence, this might explain why fruit from T1 and T3 had higher total phenolic content.
Plant spacing and fruit set position had a significant effect on TA. In this study, wider plant spacing (0.6 m) and lower position of fruit set (1st - 7th nodes on a lateral branch) resulted in fruit with greater TA. The result obtained in this study was similar to de Queiroga et al. (2008), in which cantaloupe fruit set between nodes 5–8 had greater total TA in a greenhouse setting. The higher TA observed in fruit grown in wider spacing may be due to reduced interplant competition, resulting in a higher production of photoassimilates directed to the fruit (sink). In our study, the size and number of leaves and the total biomass of the plants were larger at the 0.60-m spacing compared to the 0.30-m and 0.15-m spacings. In plant, the metabolism and accumulation of malic and citric acids in mesocarp cells are under the control of both genetic and environmental factors (Etienne et al., 2013). Although numerous studies have been conducted on the influence of agro-environmental factors, such as the source:sink ratio, mineral fertilization, temperature, and water supply (Etienne et al., 2013), very limited study has been conducted on the effect of fruit set position on TA.
For ascorbic acid content, a significant difference was observed between the within-row plant spacings. The highest ascorbic acid content was observed in plants grown at the 0.60-m spacing. Tabasi et al. (2013) reported that increasing light penetration to the plants leads to increased ascorbic acid content in tomato. It can be postulated that a 0.60-m within-row plant spacing allows more area for the leaves, thereby reducing shading of the lowermost leaves and consequently increased ascorbic acid content in the fruit.
Rockmelon fruit is often consumed as a dessert where its sweetness is extremely important. The content of TSS reflects the amount of soluble sugars in fruit and is a basic parameter in evaluating fruit quality. In the present study, TSS was significantly affected by plant spacing. TSS content increased at higher plant spacing, probably due to less interplant competition for light. Fruits require photoassimilates from the leaves for sugar accumulation during ripening, thus wider spacing probably provides larger canopies which provide more photoassimilates. This result was similar to Zahara (1972) where the concentration of soluble solids increased when within-row spacing was increased. However, the number of fruits and the fruit set position did not have a significant effect on TSS, but did have a significant effect on the total carbohydrate content. Valantin et al. (2006) observed a reduction in TSS content of Talma cantaloupe when the experiment was conducted with two fruit per plant compared to plants with one fruit. This was probably due to the larger availability of leaf area per fruit.
Melons have high sugar content. The main sugars present in melons are glucose, fructose, and sucrose. In this work, fruit set at 8-14lateral branches had high total carbohydrate contents regardless of the number of fruits per plant (T2 and T4). Total carbohydrate content at the widest plant spacing (0.6 m) was the highest independent of the position of fruit set. The sucrose concentration is lower in melon fruits with reduced leaf area per fruit. Hubbard and Pharr (1990) reported that the metabolism of sucrose in cantaloupe fruit during the ripening stage is influenced by leaf area. Wider plant spacing provides a larger area for plant development and increases the leaf area. According to Valantine et al. (1998), the sink strength of growing cantaloupe fruit was related to the number of fruits per leaf area and photosynthetic activity. These authors observed that plants with a single fruit produced more leaves, but these plants did not store more assimilates in the fruit than plants with unrestricted fruit loads. In our study, two fruit per plant had higher total carbohydrates as compared to one fruit plant.
In Malaysia, rockmelon fruit is sold by weight. Cabello et al. (2009) stated that melon fruit are considered marketable if there are no visual defects and the fruit weighs more than 1 kg. Rockmelon fruit greater than 1.5 kg are categorized as Grade A fruit, which have a higher market price. Therefore, the average fruit weight and number of fruits per ha are important yield criteria. Here, we suggest that the optimum conditions to produce premium quality fruit in ‘Glamour’ rockmelon are a within-row plant spacing of 0.30 m with two fruits per plant, where the fruits are fixed to set at 8-14 lateral branches.
