

Introduction
Materials and Methods
Experimental Materials and Kimchi Production
Quality Characteristics
Sensory Evaluation
Analysis of Antioxidant Activity
Quality Characteristics of Microorganisms
Statistical Analyses
Results
Trimming Loss Rate and Yields of Salted Kimchi cabbage and Kimchi
Kimchi pH, Salinity, and Hardness
DPPH Radical-Scavenging Act
Total Content of Phenols and Flavonoids
Number of Lactic Acid Bacteria
Discussion
Introduction
Kimchi is a leading Korean food made with fermented vegetables. It has drawn global attention as a health food because of its abundant lactic acid bacteria, vitamin, carotene, and acetate contents that have outstanding anti-cancer, anti-inflammatory, and anti-mutagenic effects (Bae et al., 2009). The kimchi cabbage (Brassica compestris L. ssp. pekinensis), one of the main ingredients for making kimchi, is a biennial leafy green of the family Cruciferae (Jung et al., 2009). Every year, two million tons of kimchi cabbage are produced in Korea, accounting for 25% of national vegetable consumption (Kim et al., 2014). The cruciferous vegetable is rich in plant secondary metabolites such as glucosinolate, flavonoid, phenol, and sulfur compounds (Cho et al., 1993). The kimchi cabbage is particularly known for its abundant contents of antioxidative flavonols such as hydroxy benzoic acid, hydroxy cinamic acid, kaempferol, and quercetin (Ku et al., 2007). The kimchi cabbage is the fundamental ingredient, alongside white radish, scallions, and chili, to make kimchi, meaning that kimchi quality heavily depends on the variety of kimchi cabbage as well as growth time, climatic condition, cultivation method, and other environmental factors (Lee et al., 2008). The kimchi cabbage is large in size and has soft tissue, which creates difficulties for its storage and distribution. Thus, the price and supply of the kimchi cabbage vary substantially according to the season (Han et al., 2000). In the past, most kimchi was made with kimchi cabbage available in November. However, in current times, advanced breeding technology has made kimchi cabbage available to the market year round. The quality and processing suitability of kimchi cabbage are affected not only by the specific variety and genetic factors, but also by pre-harvest variables such as soil quality and time of cultivation and by post-harvest factors such as storage period and conditions. Subsequently, these same factors greatly influence the quality of kimchi made from the kimchi cabbage (Lee et al., 2013). The diversification of dietary choices resulting from recent social changes in Korea has increased the number of consumers purchasing kimchi cabbage regardless of season. The growth of kimchi export markets has also boosted the use of spring kimchi cabbage, because kimchi manufacturers need to sustain production year round. However, there is still a poor understanding of how properties of spring kimchi cabbage affect the quality characteristics of kimchi (Cho et al., 2016). Therefore, the objective of this study was to establish optimal conditions for storing spring kimchi cabbage by analyzing kimchi made from cabbages that had been through various pre-treatment and storage conditions.
Materials and Methods
Experimental Materials and Kimchi Production
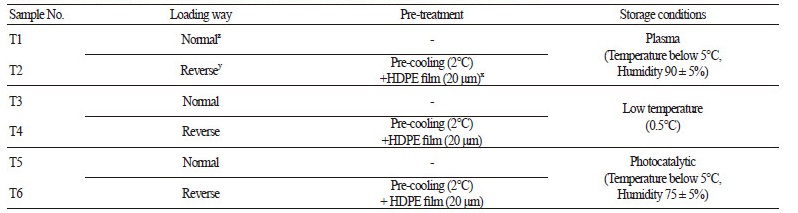
The spring kimchi cabbage ‘Chunkwang’ used in these experiments was sourced from a kimchi cabbage–growing district (Pyeongchang) where a certain quantity can be supplied, pretreated, and stored in early July. Immediately after the harvest, kimchi cabbage were treated and stored following one of six regimes, as described in Table 1. Specifically, kimchi cabbage was placed in plastic containers (55 × 37 × 32 cm) either in an upright or upside down orientation. Containers containing upside down cabbages were pre-cooled at 2°C and covered with HDPE film (20 mm) to prevent water loss. Cabbages were then placed in either plasma curing storage (temperature below 5°C, humidity 90 ± 5%; Water Link Co., Gyeonggi, Korea), low temperature storage (0.5°C), or photocatalytic storage (temperature below 5°C, humidity 75± 5%; Wizfresh Co., Seoul, Korea) to maintain freshness and prevent disease.
Prior to conducting the experiments, the kimchi cabbage was stored in the various conditions for six weeks at a storeroom within the shipment control facilities of Daegwallyeong Horticultural Nonghyup. Each kimchi cabbage was cut in half, soaked in brine with 15% salt (Solar Salt, Shinan, Korea) content for 17 hours, washed three times, and dried for two hours. Following this, seasoning was made by mixing 4.5 g of red pepper powder (Sun Dried Red Pepper, Goesan), 2.0 g of garlic (Seosan), 1.0 g of ginger (Seosan), 5.0 mL of anchovy sauce (CJ Cheiljedang, Korea), and 0.5 g of white sugar (Beksul, Korea) per 100 g of salted kimchi cabbage, which was according to the recipe for general kimchi seasoning of the Rural Development Administration. In addition, 10 g of white radish (Jeju) and 5 g of onions (Muan) were ground and added to the seasoned kimchi cabbage (RDA, 2013). The final kimchi product was sealed in vacuum-packed polyethylene bags (200 × 300 × 55 mm) and allowed to ripen at 4°C for eight weeks. In the meantime, experiments were carried out that analyzed the differences between each kimchi type regarding quality and sensual properties.
Quality Characteristics
Trimming loss rate and yields of salted kimchi cabbage and kimchi
To maintain the freshness of spring Kimchi cabbage and tap the possibility of commercializing kimchi, we calculated a trimming loss rate by measuring the weights of original kimchi cabbage and kimchi cabbage whose unusable outer leaves were removed because they were too dry or rotten. In addition, the weights of salted kimchi cabbage and kimchi were measured using the measurement method commonly used by kimchi manufacturers to determine each sample’s potential for becoming quality kimchi. Then the weight of salted kimchi cabbage was converted against that measured after selection into a percentage to calculate the yield of salted kimchi cabbage. For the yield of kimchi, we converted the total weight of kimchi against that of raw materials into a percentage as shown below.
Trimming loss rate (%) =Weight of raw materials - Weight measured after selection/Weight of raw materials × 100
Yield of salted kimchi cabbage (%) = Weight of salted kimchi cabbage/Weight measured after selection × 100
Yield of kimchi (%) = Weight of kimchi/Weight of raw materials× 100
Measurement of pH, salinity and hardness
We took approximately 100 g of samples from each kimchi stored for various periods and made juice with juicer (Do9901, Dongaoscar, Korea) to measure pH and salinity. The pH was measured by an automatic titrator (Titroline easy, SchottInstruments, Mainz, Germany) at room temperature, whereas a digital salimeter (SB-2000, Gimisanggung, Korea) was used to measure salinity. The hardness of kimchi was gauged by cutting off the seventh leaf from the outer leaves and measuring the thickest part of the stem, which is 5 cm away from its dwarf stem, by using a texture analyzer (TAplus 2006, LLOYD Instruments, USA). At this point, the probe used a crisp fracture support rig and the measurement was performed at a test speed of 60 mm·min-1 and trigger of 0.5 N (Lee, 2004).
Sensory Evaluation
For the sensory evaluation of kimchi, 10 evaluators under age 40 were invited to form a panel. After explaining the purpose of the tests to them, the kimchi was evaluated for appearance, texture, flavor, and overall acceptability based on a nine-point hedonic scale (Kim et al., 2014).
Analysis of Antioxidant Activity
DPPH radical-scavenging activity
To measure the 1,1-Diphenyl-2-picrylhydrazyl (DPPH) radical-scavenging activity of each extract, we slightly altered Blois’s method (Blois, 1958). The experiment was performed by mixing a 0.2 mM DPPH solution (Sigma Chemical Co., St. Louis, MO, USA) with individual samples of various concentrations, waiting for 25 minutes and measuring their absorbance at 515 nm. As a result, the samples showed activity in radical removal compared to those with no solution added. The experiment on DPPH radical-scavenging activity was conducted three times and suggested an average value through the following formula.
% DPPH = A-B/A× 100
A: Absorbance of the control
B: Absorbance of the sample
Measuring total phenol content
To measure total phenol content, we followed the Folin-Denis method by mixing each extract (50 μL) with 300 μL of folin reagent, exposing the extracts to room temperature for 3 min, adding 150 μL of 2% Na2CO3 to make them react at room temperature for two hours and measuring their absorbance at 760 nm. Gallic acid was used as a standard reference material and total phenol content was calculated from the calibration curve obtained through the same method for analyzing the specimens. This experiment was conducted three times to formulate an average value.
Measuring total flavonoid content
We followed the Davis method to measure total flavonoid content. Each sample solution (0.1 mL) was mixed with 1 mL of diethylene glycol and 0.1 mL of 1 N NaOH. The samples were exposed to a temperature of 30°C for 60 minutes and their absorbance was measured at 420 nm. Quercetin was used as a standard reference material and total flavonoid content was calculated from the calibration curve obtained through the same method for analyzing the samples. This experiment was conducted three times to calculate an average value.
Quality Characteristics of Microorganisms
We applied 0.85% NaCl sterile water to 10 g of the sample that combined the inner and outer leaves of kimchi. The total volume of the sterile water had to be 100 mL to become 1:10 w/v compared to the sample. Then a homogenizer was used to homogenize the sterile water whose homogenate was diluted 10 times at each phase and smeared on 3 m badges. After the inoculation, the sample was incubated at 37°C for 36 hours and colonies were counted. The number of detected lactic acid bacteria was expressed by the log colony forming unit per milliliter of sample.
Statistical Analyses
All experiments except those for measuring the loss rate and yields were repeated in triplicate to calculate average values and standard deviations. Each measured value went through the analysis of variance (ANOVA) using the SPSS Win program (Version 19.0, Chicago, IL, USA), which was then verified by Duncan’s multiple range test where p < 0.05.
Results
Trimming Loss Rate and Yields of Salted Kimchi cabbage and Kimchi
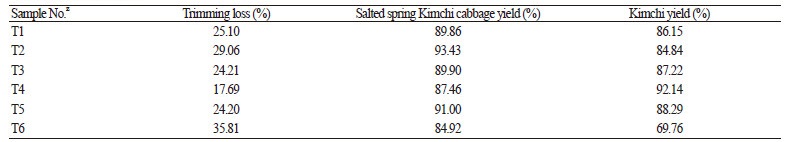
Pepper spot is a physiological disorder that affects the white midrib tissues of spring Kimchi cabbage. The first symptoms of pepper spots are small, dark, circular or elongated spots that first appear on the white midribs of the outer leaves and then spread to the middle inner leaves. Spots develop on both outer and inner surfaces of leaves (Studistill et al., 2007). Table 2 shows the results of trimming loss rate and yields of salted kimchi cabbage and kimchi for each combination of pre-treatment and storage conditions. The trimming loss rate among treated material ranged between 17.69% and 35.81%. For the T2, T4, and T6 cabbage, which were packed upside down, received a pre-cooling treatment, and were covered by HDPE film, subsequent low temperature storage of T4 cabbage resulted in a trimming loss rate of 17.69%, which was substantially lower than the trimming loss rates from T2 (29.06%) and T6 (35.81%) cabbage that were stored under plasma and photocatalytic conditions, respectively. All treatments resulted in satisfactory yields of salted kimchi cabbage of over 80%. The yield of kimchi, affected by the trimming loss rate, ranged widely from 69.76% to 92.14%. The yield of kimchi was in inverse proportion to the trimming loss rate, as reflected by the yield of kimchi from T4 cabbage (92.14%), which was approximately 20% higher than that from T6 cabbage (69.76%).
Kimchi pH, Salinity, and Hardness
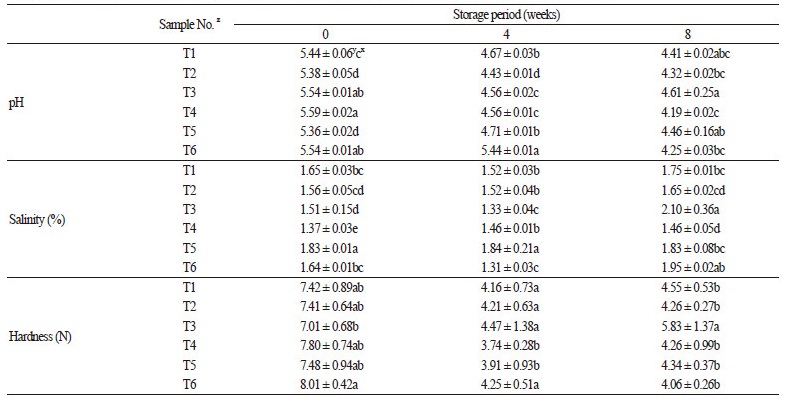
A change in pH is a significant indicator of the degree of kimchi ripening (Cho et al., 2016), with kimchi at pH 4.2 - 4.6 with a lactic acid content of 0.50 - 0.75% considered to be at optimum maturity. Kimchi produced from all treated material was ripened at 4°C over eight weeks, and the pH values, salinity, and hardness were measured following various ripening periods (Table 3). The pH prior to kimchi ripening was 5.36 - 5.59, which decreased to 4.43 - 5.44 and 4.19 - 4.61 following four and eight weeks of ripening, respectively. Kimchi from T4 cabbage showed the largest drop in pH during ripening, and continued to ripen in the eighth week, whereas other treated cabbage produced kimchi that maintained a pH range within that of optimum maturity. Kimchi from T6 cabbage had a pH following four weeks of ripening that was considerably unchanged from that measured prior to ripening, indicating that the ripening process progressed slowly. The salinity prior to kimchi ripening was 1.51 - 1.83%, which decreased to 1.31 - 1.84% following four weeks of ripening and then increased to 1.46 - 2.10% following eight weeks of ripening. The hardness of kimchi is a significant quality factor and is considered in the sensory test for evaluating kimchi texture. Hardness values prior to kimchi ripening were 7.01 - 8.01 N, with T6 cabbage producing kimchi exhibiting the highest value of 8.01 N.
Sensory Evaluation
For sensory evaluation, evaluating panel members were presented with kimchi at various stages of ripening (Fig. 1). Following evaluation of kimchi that had not undergone fermentation (0 weeks ripening), kimchi produced from T3 cabbage received the highest scores of 7.29 and 6.71 for its texture and preference, respectively, whereas kimchi produced from T1 cabbage received the lowest score of 4.71 for preference. Regarding appearance, kimchi made from T2, T4 and T6 cabbage all received a high score of 6.80. As for other evaluated characters, differences were observed between values but these were not statistically different. Sensory evaluation of kimchi following four weeks fermentation showed that kimchi produced from T3 and T5 cabbage received the highest score of 6.00 for preference, although this value was not significantly different to that for kimchi made from other treated cabbage. In addition, kimchi produced from T5 cabbage received the highest scores of 5.80 and 6.20 for appearance and texture, respectively, although again these values were not significantly different. However, significant differences were found in evaluation of sour and green tastes following four weeks fermentation. Specifically, kimchi made from T3 cabbage received the highest score of 6.60 for sour taste, whereas T2 and T4 cabbage scored 6.40 and T5 cabbage scored 6.00. T6 cabbage produced kimchi that received a relatively lower sour taste score of 3.60. For green taste, T1 and T6 cabbage produced kimchi that had high scores of 3.20 and 3.00, respectively, whereas kimchi from T5 cabbage had the lowest score of 2.00. These results resembled those for kimchi made from T6 cabbage, which exhibited slow ripening over four weeks as described above. Following eight weeks fermentation, differences were observed between values for evaluated characters but these were not statistically different. Regarding preference, appearance, and texture, kimchi with the highest scores was made from T1 and T4 cabbage (6.17 and 6.00), T2 and T5 cabbage (6.33 and 6.17), and T4 cabbage (6.67), respectively.
Fig. 1.
Sensory evaluation of kimchi made from spring Kimchi cabbage following different pre-treatment processes and storage conditions. Evaluated kimchi was fermented at 4°C for 0 weeks (A), 4 weeks (B), and 8 weeks (C). Abbreviations are the same as in Table 1.
DPPH Radical-Scavenging Activity
For DPPH radical-scavenging activity, in vitro experiments were carried out to measure the effects of antioxidant activity (Kim et al., 2013). In a biological system, the protective performance of an antioxidant is determined by examining its free radical-scavenging activity, metal catalyst-chelating ability, antioxidant enzyme activity, and inhibitory effects on oxidizing enzymes. In particular, the DPPH radical is a chemically stable radical whose unique purple color fades when receiving an electron from a certain reaction system (Hyun et al., 2009), a process through which antioxidant activity can be measured. The DPPH radical-scavenging activity was measured in kimchi produced from each type of stored cabbage over various ripening periods (Fig. 2). Prior to fermentation, kimchi made from T2 and T5 cabbage showed significantly high radical scavenging activities of 70.50% and 65.06%, respectively. Following four weeks fermentation, kimchi from T6 cabbage displayed the highest level of radical-scavenging activity (77.52%), which was followed by that from T3 (68.61%) and T1 (68.27%) cabbage. Following eight weeks fermentation, the highest levels of radical-scavenging activity were observed in kimchi made from T4 (70.54%), T3 (68.31%), and T2 (67.58%) cabbage, although there were no significant differences among these values.
Total Content of Phenols and Flavonoids
A phenolic compound is a sulfated substance that hinders the oxidation of unsaturated fatty acids, and is known to cure and prevent skin cancer. Total phenol content was increased in mature fermented kimchi compared to that in kimchi prior to fermentation. Furthermore, results verified a higher phenol content in kimchi made from T2 and T6 cabbage. Moreover, kimchi from T2 cabbage, which showed a relatively higher level of DPPH radical-scavenging activity, also showed the highest total phenol content (243.75 GAE mg·g-1 following eight weeks fermentation, the optimum maturity for storing kimchi, by maintaining pH between 4.2 and 4.6. Kimchi from T5 and T6 cabbage contained a high phenol content of 200.59 GAE mg·g-1 (Fig. 2). The flavonoids composition of plants is mainly anthocyanidins, flavonols, flavones, cathechins, and flavanones (Doh et al., 2011). Flavonoids are known to have anti-bacterial activity as well as antioxidant, anti-inflammatory, cholesterol reduction, and fatty liver-inhibiting effects, and display a tendency to prevent the growth and differentiation of various tumor cells (Ahn et al., 2015). Compared to that measured prior to fermentation, total flavonoid content in kimchi made from all stored cabbage decreased following four weeks fermentation and increased again after eight weeks fermentation. When total flavonoid content was measured following eight weeks fermentation, which is considered the optimal maturity period for storing kimchi, that made from T4 cabbage had the highest flavonoid content (70.54 QE mg·g-1 ), which was followed by kimchi made from T1 (68.31 QE mg·g-1 ) and T3 (66.80 QE mg·g-1 ) cabbage (Fig. 2).
Fig. 2.
Antioxidant activity of kimchi made from spring Kimchi cabbage following different pre-treatment processes and storage conditions. Measurements were made during an eight-week fermentation at 4°C following 0, 4, and 8 weeks. (A) DPPH radical scavenging activity, (B) Total flavonoid contents, and (C) Total phenol contents. Values are averages ± SD (n=3). Abbreviations are the same as in Table 1.
Number of Lactic Acid Bacteria
The volume of lactic acid bacteria was measured in individual kimchi samples over an eight-week fermentation at 4°C (Fig. 3). Following four weeks fermentation, kimchi from T2 cabbage contained the highest number of lactic acid bacteria (7.97 log CFU·mL-1), which was followed by kimchi from T5 (7.82 log CFU·mL-1) and T3 (7.74 log CFU·mL-1) cabbage. In contrast, kimchi produced from T1 cabbage showed the lowest number of lactic acid bacteria (7.06 log CFU·mL-1). Following eight weeks fermentation, kimchi from T3 cabbage contained the highest number of lactic acid bacteria (7.98 log CFU·mL-1) and kimchi from T1 cabbage exhibited a significant increase in lactic acid bacteria (7.81 log CFU·mL-1) compared to that measured following four weeks fermentation.
Our results showed that the pH of ripened kimchi was less than that prior to fermentation, which is similar to previously reported results (You and Kim, 2013) that described a tendency for pH to decrease and acidity to rise due to the increase of organic acid content created by lactic acid fermentation during kimchi ripening. Regarding salinity, our results revealed an overall decrease following four weeks of kimchi fermentation followed by an increase following eight weeks fermentation. Such fluctuation in salinity is known to influence the storage performance, organoleptic properties, and ripening speed of
Fig. 3.
Lactic acid bacteria counts of kimchi made from spring Kimchi cabbage following different pre-treatment processes and storage conditions. Measurements were made during an eight-week fermentation at 4°C following 0, 4, and 8 weeks. Abbreviations are the same as in Table 1.
T2 cabbage produced kimchi that showed a relatively higher level of DPPH radical-scavenging activity, and also showed the highest total phenol content (243.75 GAE mg·g-1) following eight weeks fermentation, the optimum maturity for storing kimchi, by maintaining pH between 4.2 and 4.6. This was because phenolic acid such as p-coumaric and ferulic acid reacted with microorganisms and created an ethyl or vinyl derivative through which total phenol content increased as fermentation progressed normally (Park et al., 2001). The lactic acid bacterium of kimchi has anti-bacterial and anti-tumor activity, and immunity improvement and anti-cancer effects (Kim et al., 2013). Kimchi produced from cabbage where the proliferation of lactic acid bacteria is most active is considered likely to show these effects well. Upon maturity following eight weeks fermentation, kimchi produced from T2, T4, T5, and T6 cabbage showed a lower number of lactic acid bacteria compared to that measured following four weeks fermentation. In particular, kimchi from T4 cabbage exhibited a substantial decrease of 6.73 log CFU·mL-1 over this extended fermentation period. Thus, we assume that an inappropriate environment for microorganisms to live in was created in kimchi from T4 cabbage over eight weeks of fermentation, and that the kimchi from this type of stored cabbage does not possess the advantageous functions of lactic acid bacteria. In general, as the fermentation of kimchi progressed, the number of lactic acid bacteria drastically increased. When this number reaches a maximum level, lactic acid bacteria impart a carbonated flavor and unique odor to kimchi, which is the typical flavor of kimchi at optimal maturity. The main microorganism within kimchi is Leu. mesenteroides, which positively influences the flavor and odor of kimchi. The number of Leu. mesenteroides reaches a maximum level when kimchi achieves optimal maturity. In contrast, Lac. plantarum, which causes the acidification of kimchi, is known to increase when the number of lactic acid bacteria starts to fall (Jung et al., 2014).
In summary, the combination of all the experiment results of this study indicate that the storage conditions applied to T3 cabbage, namely storage in an upright orientation at low temperature (0.5°C), are the most effective way to store spring Kimchi cabbage for making high-quality kimchi.
