

Introduction
Materials and Methods
Plant materials and morphological characterization
PM treatment and quantification
Statistical analysis
Results
Morphological characteristics of succulent plants
PM deposition analysis
Correlation between morphological traits and PM trapping capacity
Comparison of PM trapping capacity by genus
Discussion
Conclusions
Introduction
Air pollution has become a critical environmental issue and is closely linked to rapid industrialization. According to the World Health Organization (WHO 2024), air pollution is responsible for approximately 6.7 million premature deaths worldwide each year, with 3.2 million of these deaths attributed to indoor air pollution. Among various pollutants, particulate matter (PM), specifically PM10 (aerodynamic diameter ≤ 10 µm) and PM2.5 (aerodynamic diameter ≤ 2.5 µm), has been shown to penetrate the alveoli and bloodstream, leading to respiratory and cardiovascular diseases (Nemmar et al. 2002; Polichetti et al. 2009).
In urban areas, PM is generated not only by traffic emissions but also indoor activities such as cooking and heating (He et al. 2004; Vu et al. 2015). As most urban populations spend the majority of their time indoors, it is crucial to develop effective strategies to reduce indoor PM levels.
One such strategy is the use of plants that can absorb airborne pollutants through their leaves, owing to their large surface areas and complex structural features (Nowak et al. 2014; Hirabayashi and Nowak 2016). Early experimental studies using fungal spores have demonstrated that the efficiency of particle capture varies depending on the surface characteristics of the leaves (Legg and Powell 1979; Smith 1977). These findings have led to ongoing research into the PM-trapping capabilities of various vegetation types, including both broadleaf and coniferous species, with the aim of identifying morphological traits associated with efficient PM reduction (Beckett et al. 2000; Freer-Smith et al. 2005; McDonald et al. 2007; Tallis et al. 2011).
In particular, the process of PM deposition is closely related to morphological features such as leaf size, surface texture, and trichomes (Chen et al. 2016; Leonard et al. 2016; Weerakkody et al. 2017). Therefore, understanding the interactions between morphological traits and deposition mechanisms is crucial for utilizing plants as biological filters to mitigate air pollution.
Studies on indoor foliage plants such as Phalaenopsis and Begonia have also shown that cuticular wax and surface roughness are positively correlated with PM deposition (Kim 2020a, Kim 2020b). Recent studies have highlighted the potential of succulent plants as indoor air purifiers (Jung 2023). Succulent plants are characterized by well-developed water-storing tissues, with more than 10,000 species reported across approximately 50 genera (RDA 2023). In 2023, the total cultivated area and production value of potted plants in Korea were 745 ha and 211.5 billion Korean won (KRW), respectively. Among them, succulents, excluding cacti, accounted for 78.1 ha of cultivated area, 26.66 million pots in production volume, and 28.15 billion KRW in production value, making them one of the major potted plant groups along with orchids (MAFRA 2024). These include Cactaceae, Crassulaceae, Euphorbiaceae, Aizoaceae, Agavaceae, and Apocynaceae (Park 2015). Succulent plants exhibit diverse forms and colors depending on the species, and many cultivars possess distinctive features, such as ridges, pubescence, and tubercles, which enhance their ornamental value (Schulz and Kapitany 2010). In particular, they are easy to cultivate and can adapt to dry indoor environments (RDA 2023).
However, compared to typical foliage plants, succulents have received limited attention regarding their PM reduction capacity, despite their unique morphological traits. We hypothesized that succulent species would exhibit greater PM deposition capacity due to their complex surface traits, particularly surface texture and trichomes. Therefore, this study aimed to evaluate the PM collection efficiency of 50 domestic succulent cultivars and investigate the relationship between their morphological traits and dust trapping. These findings are expected to support the selection of functional indoor plants, enhance the commercial value of succulents, and contribute to the development of air-purifying plant applications.
Materials and Methods
Plant materials and morphological characterization
Fifty succulent plant cultivars preferred by consumers, selected based on sales volume, were sourced from the Cactus and Succulent Research Institute, Gyeonggi-do Agricultural Research & Extension Service. All plants were used as 9 cm potted specimens (Fig. 1). The following morphological characteristics were measured for each cultivar: plant height, number of leaves, maximum leaf length and width, leaf shape, surface texture, and the presence or absence of trichomes (Table 1). Leaf shape, surface texture, and the presence or absence of trichomes were visually assessed using KSVS (2021) criteria for Echeveria and applied uniformly to all cultivars due to the lack of standardized criteria for other genera. Aboveground volume was also measured to normalize PM data and account for biomass differences, though it was not used in the correlation analysis. Because of the challenges associated with measuring leaf area in succulents, the aboveground volume was used as a proxy for quantifying PM trapping, although this may not fully account for differences in leaf surface texture or 3D architecture. The aboveground volume was measured using the displacement method with a graduated cylinder and distilled water. All experimental treatments were arranged in a completely randomized design with three to five replicates.
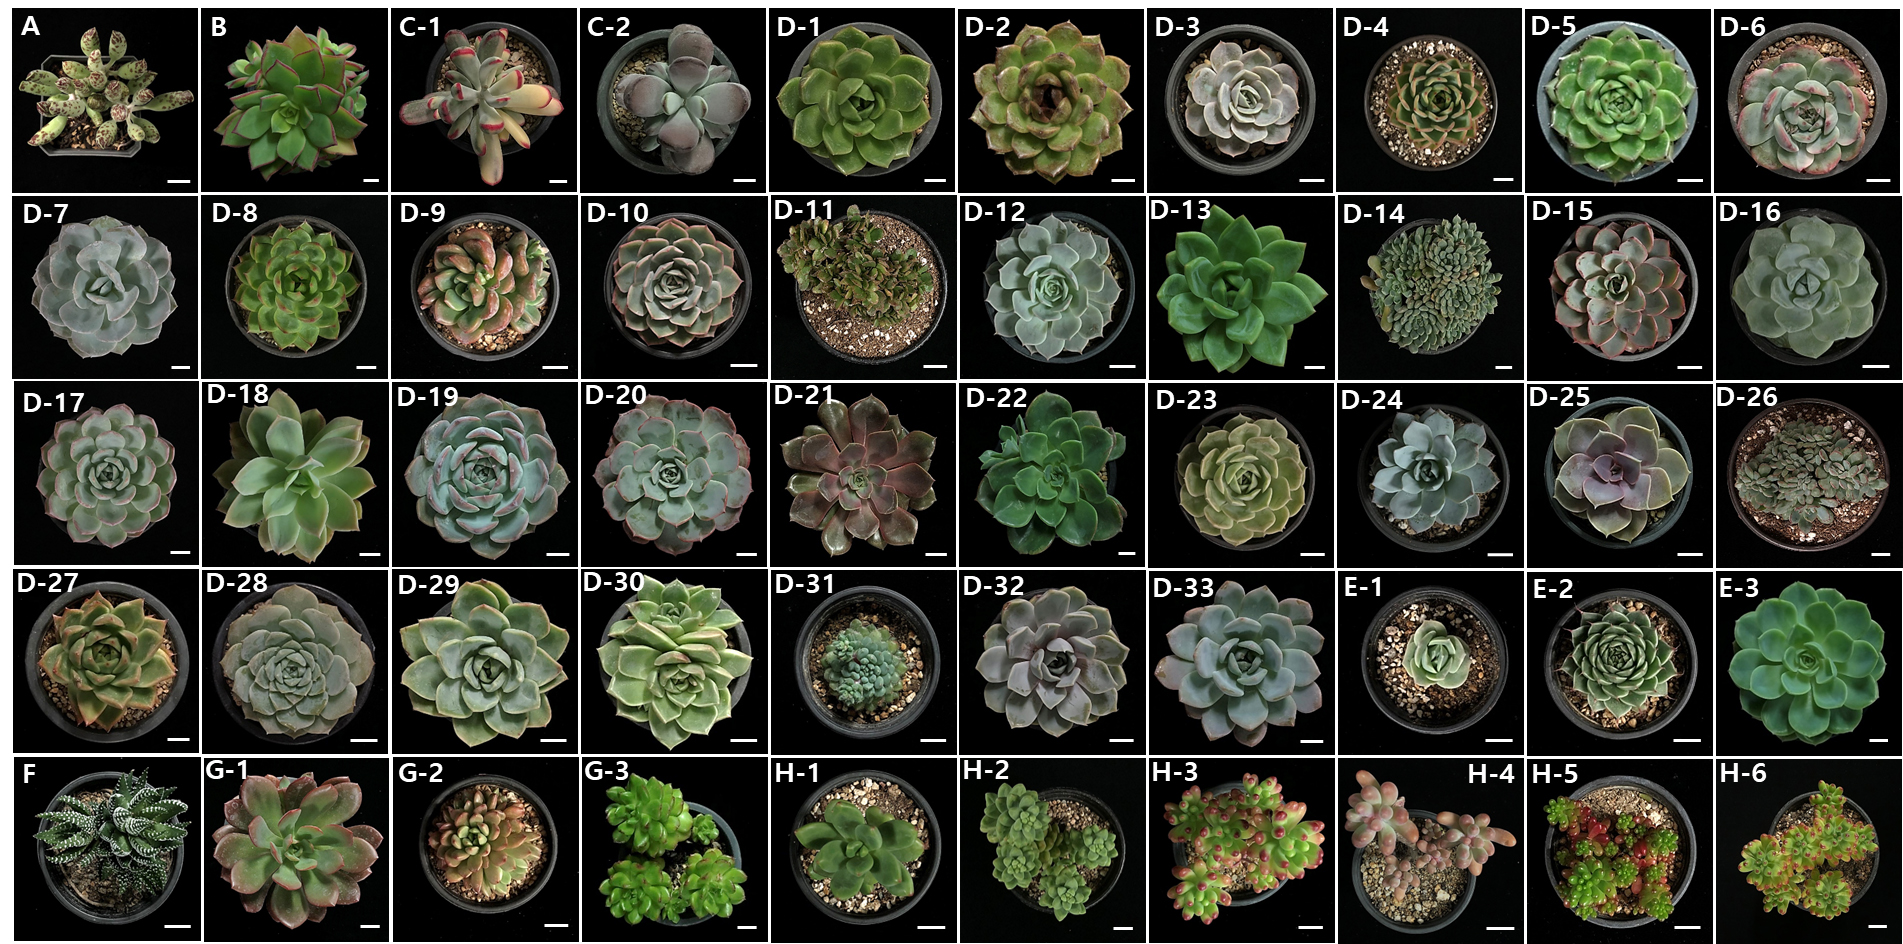
Fig. 1.
Succulent plants used in this experiment. A: Adromischus cooperi, B: Aeonium decorum f. variegata, C-1: Cotyledon orbiculata f. variegata, C-2: C. orbiculata var. oophylla, D-1: Echeveria Agavoides ‘Sugar Ball’, D-2: Echeveria ‘Black Rose’, D-3: Echeveria ‘Blue Surprise’, D-4: Echeveria ‘Bonfire’, D-5: Echeveria ‘Charleston’, D-6: E. chihuahuaensis, D-7: Echeveria ‘Cream Tea’, D-8: Echeveria ‘Deep Red’, D-9: Echeveria ‘Dentra Jam’, D-10: Echeveria ‘Egeria’, D-11: E. fimbriata f. cristata, D-12: Echeveria ‘Fleur Blanc’, D-13: Echeveria ‘Green Emerald’, D-14: Echeveria ‘Green Surf’, D-15: Echeveria ‘Hera’, D-16: Echeveria ‘Icy Green’, D-17: Echeveria ‘Jade Glow’, D-18: Echeveria ‘Joy’, D-19: Echeveria ‘Kerarian’, D-20: E. lauiensis, D-21: Echeveria ‘Mina’, D-22: Echeveria ‘Noble’, D-23: Echeveria ‘Onslow’, D-24: E. peacockii ‘Desmetiana’, D-25: Echeveria ‘Perle von Nurnberg’, D-26: E. pulidonis f. cristata, D-27: Echeveria ‘Pung Geum’, D-28: Echeveria ‘Pure Love’, D-29: Echeveria ‘Raspberry Ice’, D-30: Echeveria ‘Seok Yeong’, D-31: E. setosa var. deminuta, D-32: Echeveria ‘Snow Bunny’, D-33: Echeveria ‘Star Mark’, E-1: Graptoveria ‘Lovely Rose’, E-2: Graptoveria ‘Silver Star’, E-3: Graptoveria ‘Titubans’, F: Haworthia fasciata, G-1: Sedeveria ‘Hwa Dan’, G-2: Sedeveria ‘Pink Ruby’, G-3: Sedeveria ‘Spina’, H-1: Sedum ‘Alice Evans’, H-2: Sedum ‘Green Pang’, H-3: S. pachyphyllum, H-4: S. pachyphyllum ‘Thin Blue Form’, H-5: S. rubrotinctum ‘Red Berry’, H-6: Sedum ‘Ruby Tint’. Scale bars indicate 26.5 mm.
Table 1.
Comparison of the morphological characteristics of the succulents used in this experiment
| Succulentsz |
Plant height (mm) |
No. of leaves (per plant) |
Max. leaf length (mm) |
Max. leaf width (mm) |
Leaf shape |
Leaf texture |
Leaf trichome |
| A | 63.3 g-ky | 41.0 k-q | 37.0 j-n | 11.3 uv | Clavate | Glabrous | –x |
| B | 137.7 a | 83.3 ghi | 50.4 cde | 21.9 g-l | Obovate | Glabrous | – |
| C-1 | 95.7 e | 25.0 pq | 46.6 ef | 15.5 rs | Oblong | Glabrous | – |
| C-2 | 83.7 f | 38.3 l-q | 39.2 h-k | 20.4 i-o | Obovate | Glabrous | – |
| D-1 | 68.7 ghi | 48.7 j-p | 47.1 def | 27.7 de | Deltoid | Glabrous | – |
| D-2 | 55.7 j-r | 46.7 j-q | 37.5 h-m | 21.7 h-m | Spatulate | Glabrous | – |
| D-3 | 33.9 vw | 30.7 opq | 30.6 op | 20.4 i-o | Obovate | Glabrous | – |
| D-4 | 51.7 j-s | 59.0 k-m | 38.5 h-k | 18.5 m-r | Spatulate | Glabrous | – |
| D-5 | 42.0 s-v | 50.3 j-p | 36.6 j-n | 20.3 k-p | Obovate | Glabrous | – |
| D-6 | 37.3 uvw | 42.7 j-q | 37.8 h-l | 20.3 i-o | Spatulate | Glabrous | – |
| D-7 | 91.0 ef | 39.0 l-q | 52.7 bc | 35.4 a | Obovate | Glabrous | – |
| D-8 | 49.7 m-u | 56.7 j-o | 43.2 fgh | 16.4 qrs | Spatulate | Glabrous | – |
| D-9 | 48.4 o-u | 118.7 f | 32.0 m-p | 17.4 o-s | Spatulate | Glabrous | – |
| D-10 | 49.9 l-u | 47.7 j-p | 46.2 ef | 18.9 l-q | Obovate | Glabrous | – |
| D-11 | 54.3 k-s | 507.7 a | 17.0 s | 8.7 vw | Spatulate | Glabrous | – |
| D-12 | 43.2 r-v | 43.3 j-q | 35.5 j-o | 18.3 n-r | Spatulate | Glabrous | – |
| D-13 | 61.7 g-n | 32.0 n-q | 52.8 bc | 27.4 de | Obovate | Glabrous | – |
| D-14 | 46.3 p-v | 492.3 a | 19.1 rs | 6.8 wx | Spatulate | Glabrous | – |
| D-15 | 41.0 tuv | 32.0 n-q | 40.5 g-j | 20.4 i-o | Obovate | Glabrous | – |
| D-16 | 45.0 q-v | 37.3 m-q | 43.0 fgh | 24.3 fgh | Spatulate | Glabrous | – |
| D-17 | 59.7 h-o | 68.3 hij | 49.4 cde | 24.0 fgh | Spatulate | Glabrous | – |
| D-18 | 100.0 cde | 36.7 m-q | 58.5 a | 25.0 efg | Obovate | Glabrous | – |
| D-19 | 50.8 k-t | 65.0 h-l | 49.6 cde | 22.0 g-l | Spatulate | Glabrous | – |
| D-20 | 50.0 l-u | 40.7 k-q | 49.5 cde | 28.8 cd | Obovate | Glabrous | – |
| D-21 | 49.3 m-u | 42.3 j-q | 57.4 ab | 23.4 g-j | Obovate | Glabrous | – |
| D-22 | 48.0 o-u | 31.0 opq | 45.1 efg | 33.3 ab | Obovate | Glabrous | – |
| D-23 | 45.8 p-v | 58.7 i-n | 32.6 l-p | 18.2 n-r | Obovate | Glabrous | – |
| D-24 | 60.0 h-o | 48.3 j-p | 34.9 j-o | 16.0 qrs | Obovate | Glabrous | – |
| D-25 | 49.7 m-u | 20.3 q | 42.4 f-i | 26.5 def | Obovate | Glabrous | – |
| D-26 | 37.0 uvw | 382.0 b | 15.1 st | 7.4 wx | Oblong | Glabrous | – |
| D-27 | 72.7 g | 55.7 j-o | 46.5 ef | 23.5 f-i | Obovate | Glabrous | – |
| D-28 | 43.3 r-v | 64.7 i-m | 38.4 i-m | 22.7 g-k | Obovate | Glabrous | – |
| D-29 | 56.7 i-q | 32.0 n-q | 53.6 abc | 31.2 bc | Obovate | Glabrous | – |
| D-30 | 58.7 h-p | 60.0 i-m | 34.4 k-o | 21.7 h-m | Obovate | Glabrous | – |
| D-31 | 20.1 x | 148.7 e | 18.2 rs | 6.7 wx | Obovate | Pubescent | + |
| D-32 | 58.3 h-q | 38.3 l-q | 46.7 ef | 21.5 h-m | Obovate | Glabrous | – |
| D-33 | 58.0 i-q | 45.3 j-q | 50.1 cde | 20.1 j-o | Obovate | Glabrous | – |
| E-1 | 26.9 wx | 20.7 q | 22.9 qr | 18.1 o-r | Obovate | Glabrous | – |
| E-2 | 35.0 vw | 67.0 h-k | 27.9 pq | 14.6 st | Obovate | Glabrous | – |
| E-3 | 63.0 g-l | 50.3 j-p | 38.4 h-k | 22.7 g-k | Obovate | Glabrous | – |
| F | 67.7 g-j | 85.0 gh | 38.8 h-k | 11.1 uv | Lanceolate | Tuberculate | + |
| G-1 | 71.0 gh | 35.0 m-q | 52.4 bcd | 20.4 i-o | Obovate | Glabrous | – |
| G-2 | 55.3 j-r | 102.3 fg | 31.3 nop | 12.4 tu | Obovate | Glabrous | – |
| G-3 | 62.3 g-m | 142.0 e | 28.6 pq | 16.8 p-s | Obovate | Glabrous | – |
| H-1 | 99.0 cde | 97.3 fg | 32.2 l-p | 18.4 m-r | Obovate | Glabrous | – |
| H-2 | 108.3 bcd | 208.7 d | 20.5 rs | 12.1 tu | Clavate | Glabrous | – |
| H-3 | 110.3 bc | 156.3 e | 19.1 rs | 7.3 wx | Clavate | Glabrous | – |
| H-4 | 116.0 b | 65.0 h-l | 23.4 qr | 8.6 vw | Clavate | Glabrous | – |
| H-5 | 49.0 n-u | 256.3 c | 11.9 t | 4.9 x | Clavate | Glabrous | – |
| H-6 | 98.0 de | 265.7 c | 19.2 rs | 6.9 wx | Clavate | Glabrous | – |
| Significance | *** | *** | *** | *** |
zA: Adromischus cooperi, B: Aeonium decorum f. variegata, C-1: Cotyledon orbiculata f. variegata, C-2: C. orbiculata var. oophylla, D-1: Echeveria Agavoides ‘Sugar Ball’, D-2: Echeveria ‘Black Rose’, D-3: Echeveria ‘Blue Surprise’, D-4: Echeveria ‘Bonfire’, D-5: Echeveria ‘Charleston’, D-6: E. chihuahuaensis, D-7: Echeveria ‘Cream Tea’, D-8: Echeveria ‘Deep Red’, D-9: Echeveria ‘Dentra Jam’, D-10: Echeveria ‘Egeria’, D-11: E. fimbriata f. cristata, D-12: Echeveria ‘Fleur Blanc’, D-13: Echeveria ‘Green Emerald’, D-14: Echeveria ‘Green Surf’, D-15: Echeveria ‘Hera’, D-16: Echeveria ‘Icy Green’, D-17: Echeveria ‘Jade Glow’, D-18: Echeveria ‘Joy’, D-19: Echeveria ‘Kerarian’, D-20: E. lauiensis, D-21: Echeveria ‘Mina’, D-22: Echeveria ‘Noble’, D-23: Echeveria ‘Onslow’, D-24: E. peacockii ‘Desmetiana’, D-25: Echeveria ‘Perle von Nurnberg’, D-26: E. pulidonis f. cristata, D-27: Echeveria ‘Pung Geum’, D-28: Echeveria ‘Pure Love’, D-29: Echeveria ‘Raspberry Ice’, D-30: Echeveria ‘Seok Yeong’, D-31: E. setosa var. deminuta, D-32: Echeveria ‘Snow Bunny’, D-33: Echeveria ‘Star Mark’, E-1: Graptoveria ‘Lovely Rose’, E-2: Graptoveria ‘Silver Star’, E-3: Graptoveria ‘Titubans’, F: Haworthia fasciata, G-1: Sedeveria ‘Hwa Dan’, G-2: Sedeveria ‘Pink Ruby’, G-3: Sedeveria ‘Spina’, H-1: Sedum ‘Alice Evans’, H-2: Sedum ‘Green Pang’, H-3: S. pachyphyllum, H-4: S. pachyphyllum ‘Thin Blue Form’, H-5: S. rubrotinctum ‘Red Berry’, H-6: Sedum ‘Ruby Tint’.
PM treatment and quantification
The PM treatment was conducted by placing the potted plants in a sealed acrylic chamber (1.8 m × 1.0 m × 0.75 m) equipped with cross-installed air circulation fans. Arizona Test Dust (0–5 µm, PTI, USA) was applied for 3 h. To maintain the target PM concentration, additional Arizona Test Dust was added every 15 minutes based on real-time monitoring. During treatment, the concentration of PM inside the chamber was maintained at 161.5 ± 14.4 µg/m3, corresponding to a “very unhealthy” level according to WHO and the Korean Ministry of Environment standards. The PM concentrations were monitored using a DustTrak aerosol monitor (DRX 8533, TSI, USA).
Quantification of PM deposited on plant surfaces was performed according to the method described by Dzierżanowski et al. (2011). The aboveground parts of each plant were fully submerged in 500–700 mL triple-distilled water and shaken using an orbital shaker (VS-8480SR, Vison Scientific Co., Korea). The PM-containing solution was sequentially filtered through hydrophilic membrane filters (10.0 µm, 3.0 µm, 0.22 µm) using a vacuum filtration unit (Lafil 300C-VF 12, Rocker Scientific Co., Taiwan) to collect PM10 and PM2.5. The amount of PM collected was quantified by measuring the difference in filter weight before and after filtration. Filters were dried at 60°C for 30 min, stabilized for humidity, and weighed using a microbalance (XPR2, Mettler Toledo, Switzerland). The amount of deposited PM was initially measured by determining its concentration in the wash solution (mg/mL) using the gravimetric method. For further analysis and comparison, the values were converted to PM trapped per unit fresh weight (µg/g) and per plant (µg/plant).
Statistical analysis
Statistical analyses were conducted using the SAS package (Statistical Analysis System, Version 9.4, SAS Institute Inc., USA). One-way analysis of variance (ANOVA) was performed, and significant differences among treatments were determined using Duncan’s multiple range test (DMRT) at a 5% significance level. The unequal replicates (3–5) were accommodated in the ANOVA model, with replicate variability adjusted using SAS procedures.
Results
Morphological characteristics of succulent plants
The succulent plants used in this experiment comprised 50 cultivars belonging to eight genera within two families, Crassulaceae and Asphodelaceae (Fig. 1). The Crassulaceae family included Adromischus (one cultivar), Aeonium (one cultivar), Cotyledon (two cultivars), Echeveria (33 cultivars), Graptoveria (three cultivars), Sedeveria (three cultivars), and Sedum (six cultivars), whereas the Asphodelaceae family included only Haworthia (one cultivar). Each cultivar exhibits distinct morphological characteristics (Fig. 1).
Plant height varied from 20.1 to 137.7 mm, depending on the growth form. The number of leaves ranged from 20.3 to 507.7 on average. The longest leaf length was observed in Echeveria ‘Joy’ (58.5 mm), whereas the widest leaf was in Echeveria ‘Cream Tea’ (35.4 mm). The shape of leaves, including clavate and spatulate forms, varied among cultivars, with the obovate form being the most common. Most cultivars had glabrous leaf surfaces; however, E. setosa var. deminuta had pubescent leaves and Haworthia fasciata had tubercles on the surface. Additionally, E. fimbriata f. cristata and E. pulidonis f. cristata displayed cristate mutations (Fig. 1 and Table 1).
PM deposition analysis
The deposition amounts of PM10 and PM2.5 (µg/g) varied among cultivars (Fig. 2). PM10 deposition was highest in E. fimbriata f. cristata (504.0 µg/g), followed by E. setosa var. deminuta (371.3 µg/g). Similarly, E. setosa var. deminuta trapped the highest PM2.5 deposition amount (157.2 µg/g), with H. fasciata showing the second highest trapped amount of PM2.5 deposition (107.7 µg/g). In contrast, Cotyledon orbiculata var. oophylla trapped the lowest PM10 deposition amount (28.5 µg/g), along with Adromischus cooperi (32.8 µg/g) and C. orbiculata f. variegata (37.6 µg/g). These cultivars retained less than 6% of PM10 deposition, compared with the PM10 deposition in E. fimbriata f. cristata (504.0 µg/g). These results indicate that cristate forms and cultivars with pubescent or tuberculate surfaces generally exhibited higher PM deposition, suggesting the importance of surface complexity.
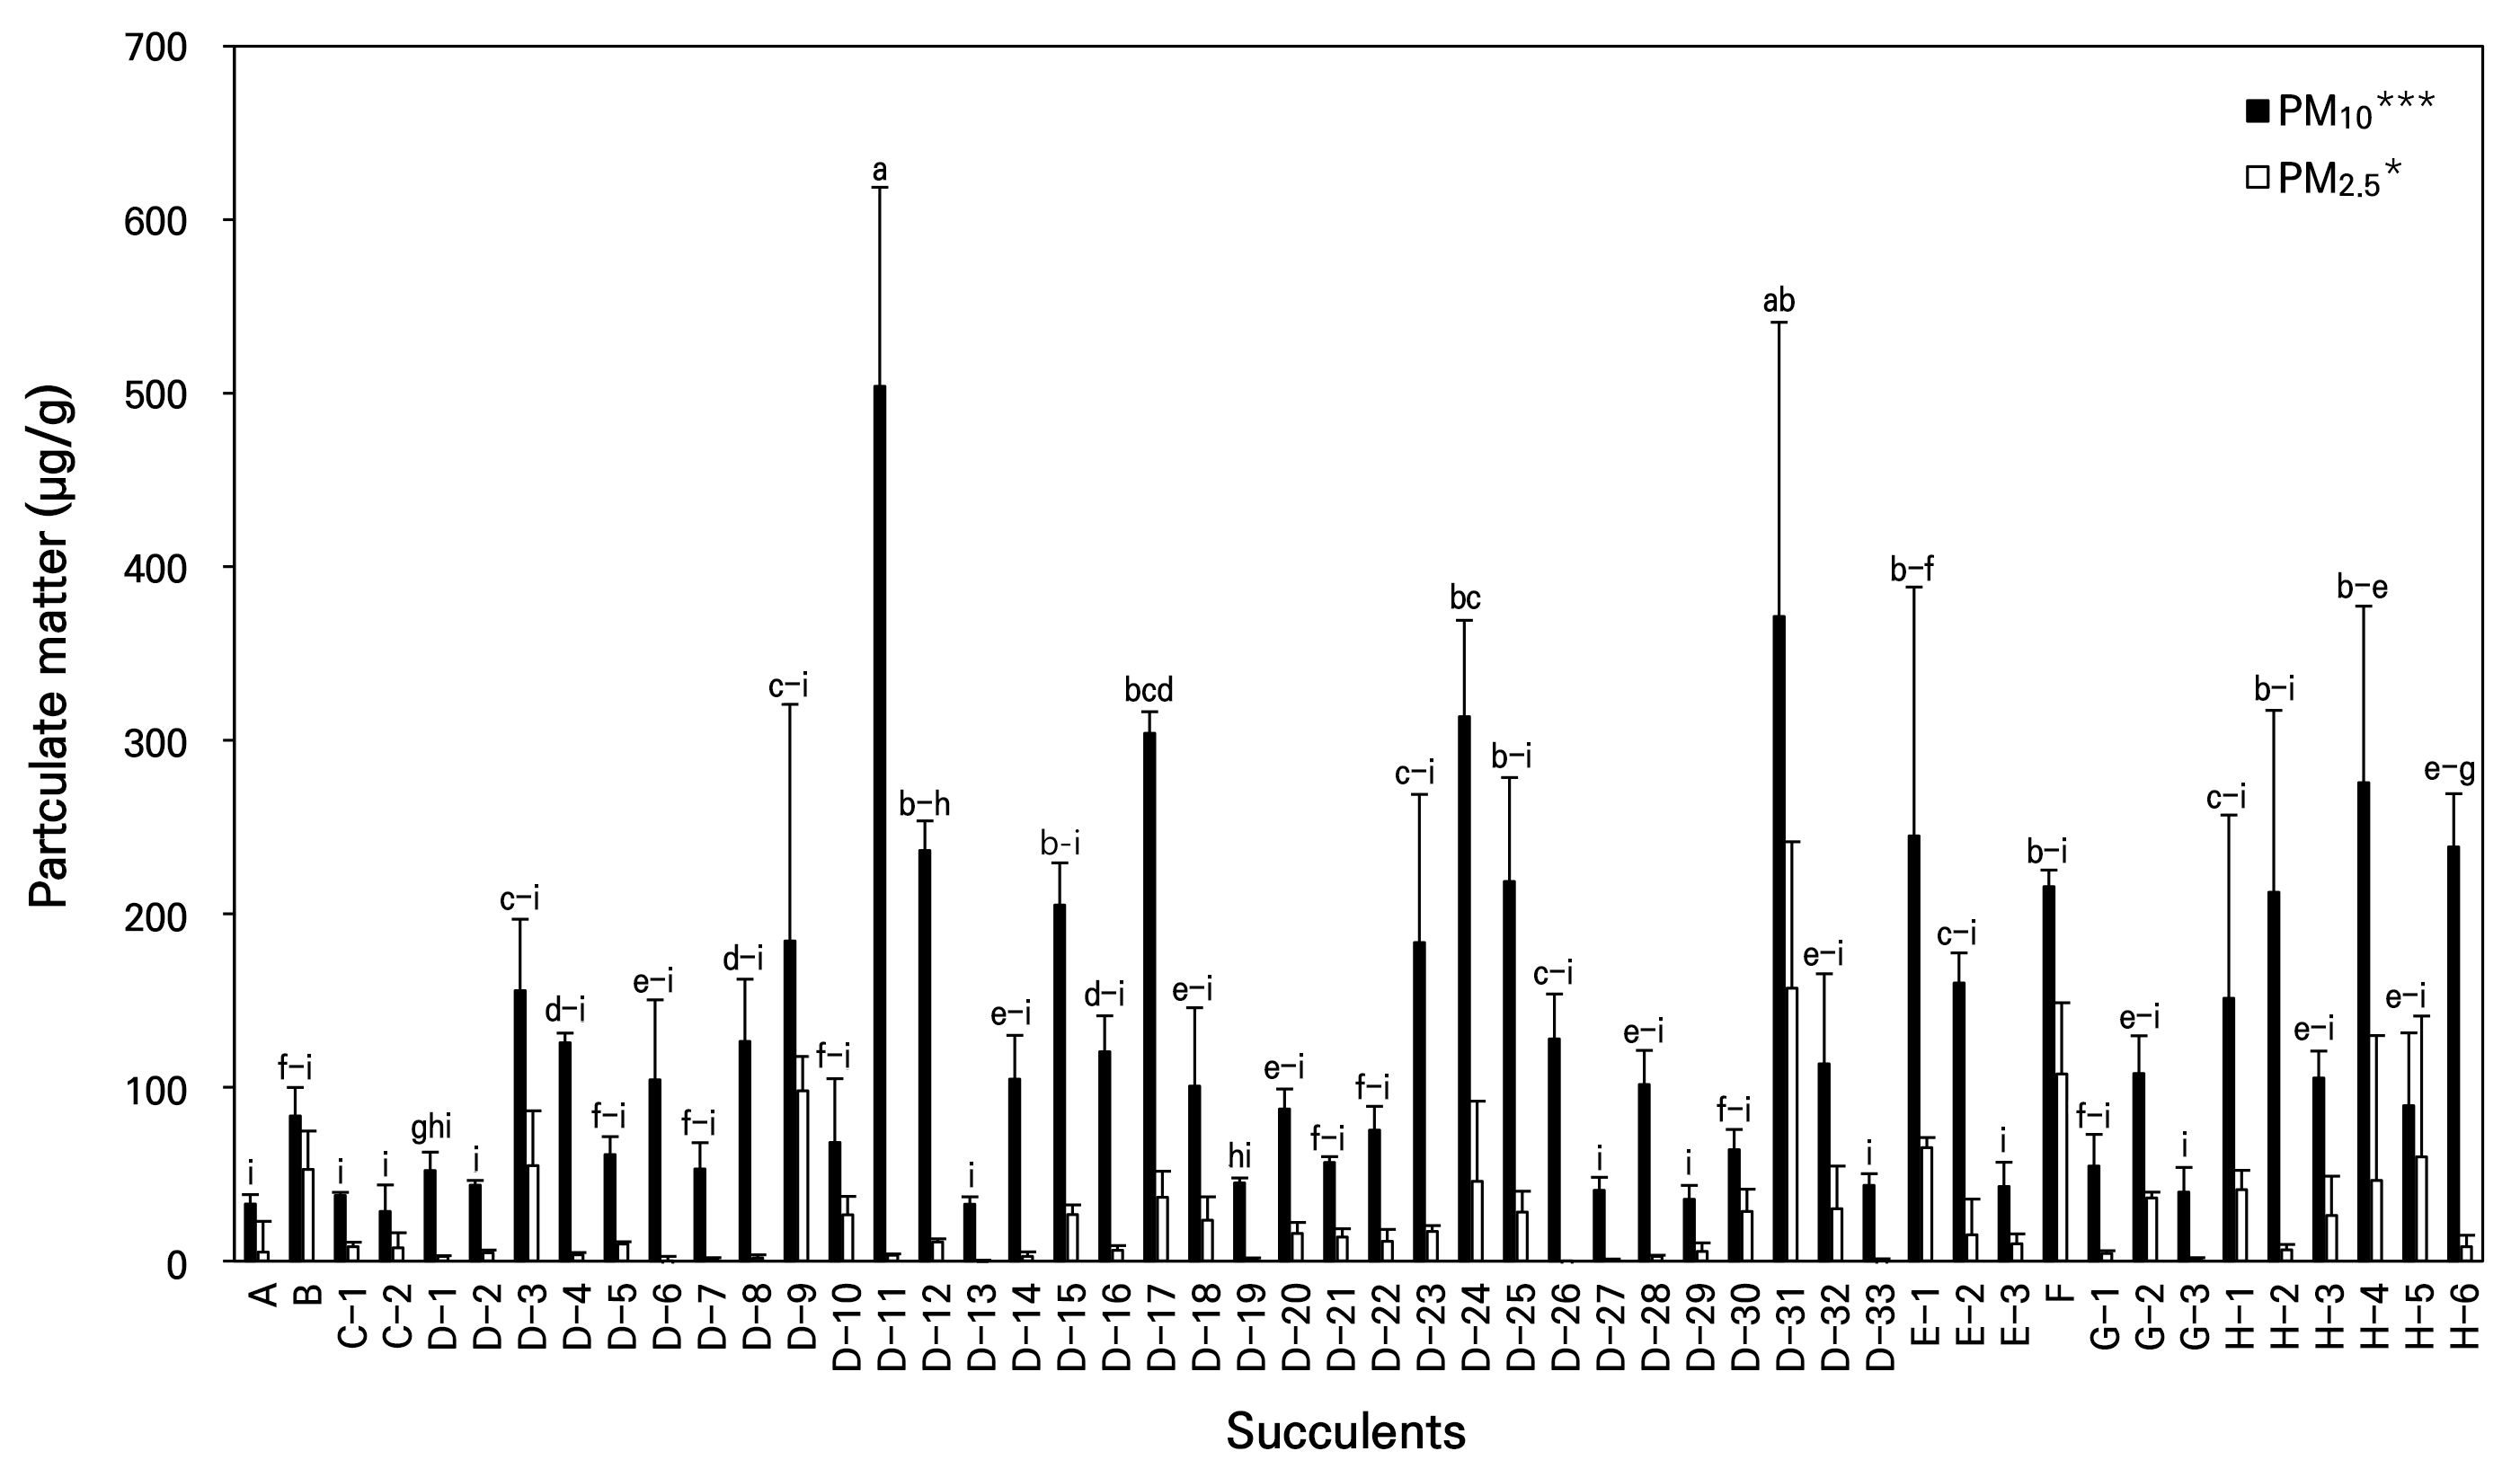
Fig. 2.
Comparison of particulate matter (PM) deposition in succulents. A: Adromischus cooperi, B: Aeonium decorum f. variegata, C-1: Cotyledon orbiculata f. variegata, C-2: C. orbiculata var. oophylla, D-1: Echeveria Agavoides ‘Sugar Ball’, D-2: Echeveria ‘Black Rose’, D-3: Echeveria ‘Blue Surprise’, D-4: Echeveria ‘Bonfire’, D-5: Echeveria ‘Charleston’, D-6: E. chihuahuaensis, D-7: Echeveria ‘Cream Tea’, D-8: Echeveria ‘Deep Red’, D-9: Echeveria ‘Dentra Jam’, D-10: Echeveria ‘Egeria’, D-11: E. fimbriata f. cristata, D-12: Echeveria ‘Fleur Blanc’, D-13: Echeveria ‘Green Emerald’, D-14: Echeveria ‘Green Surf’, D-15: Echeveria ‘Hera’, D-16: Echeveria ‘Icy Green’, D-17: Echeveria ‘Jade Glow’, D-18: Echeveria ‘Joy’, D-19: Echeveria ‘Kerarian’, D-20: E. lauiensis, D-21: Echeveria ‘Mina’, D-22: Echeveria ‘Noble’, D-23: Echeveria ‘Onslow’, D-24: E. peacockii ‘Desmetiana’, D-25: Echeveria ‘Perle von Nurnberg’, D-26: E. pulidonis f. cristata, D-27: Echeveria ‘Pung Geum’, D-28: Echeveria ‘Pure Love’, D-29: Echeveria ‘Raspberry Ice’, D-30: Echeveria ‘Seok Yeong’, D-31: E. setosa var. deminuta, D-32: Echeveria ‘Snow Bunny’, D-33: Echeveria ‘Star Mark’, E-1: Graptoveria ‘Lovely Rose’, E-2: Graptoveria ‘Silver Star’, E-3: Graptoveria ‘Titubans’, F: Haworthia fasciata, G-1: Sedeveria ‘Hwa Dan’, G-2: Sedeveria ‘Pink Ruby’, G-3: Sedeveria ‘Spina’, H-1: Sedum ‘Alice Evans’, H-2: Sedum ‘Green Pang’, H-3: S. pachyphyllum, H-4: S. pachyphyllum ‘Thin Blue Form’, H-5: S. rubrotinctum ‘Red Berry’, H-6: Sedum ‘Ruby Tint’. PM10: aerodynamic diameter ≤ 10 µm, PM2.5: aerodynamic diameter ≤ 2.5 µm. * and *** indicate significant differences at p < 0.05 and 0.001, respectively, according to ANOVA. Vertical bars represent the standard error (n = 3 to 5).
Correlation between morphological traits and PM trapping capacity
A correlation analysis was conducted between the morphological traits of the succulents and their PM trapping capacities (Table 2). PM10 trapping capacity showed a significant positive correlation with the number of leaves (r = 0.30***). In contrast, maximum leaf length exhibited a negative correlation with PM10 (r = ‒0.39***) and PM2.5 (r = ‒0.20*), whereas leaf width also negatively correlated with PM10 (r = ‒0.34***) and PM2.5 (r = ‒0.21*). Analysis of correlations between morphological traits revealed that the number of leaves showed a strong negative correlation with maximum leaf length (r = ‒0.66***) and leaf width (r = ‒0.64***). Maximum leaf length and leaf width exhibited a strong positive correlation (r = 0.80***). The presence of trichomes showed a significant positive correlation with PM10 (r = 0.26**) and PM2.5 (r = 0.48***), with a stronger association observed for PM2.5. These results indicate that leaf number was positively correlated with PM10 deposition, and trichome presence showed a stronger association with PM2.5.
Table 2.
Correlation analysis of the morphological characteristics and particulate matter (PM) trapping capacity of succulents
| Variables | NL | MLL | MLW | Tri | LS | PM10 | PM2.5 |
| 0z | 0.00 | 0.12 | ‒0.03 | ‒0.14 | ‒0.34 *** | ‒0.07 | ‒0.08 |
| NL | ‒0.66 *** | ‒0.64 *** | 0.04 | ‒0.35 *** | 0.30 *** | ‒0.02 | |
| MLL | 0.80 *** | ‒0.15 | 0.46 *** | ‒0.39 *** | ‒0.20 * | ||
| MLW | ‒0.28 *** | 0.52 *** | ‒0.34 *** | ‒0.21 * | |||
| Tri | 0.00 | 0.26 ** | 0.48 *** | ||||
| LS | ‒0.15 | 0.00 | |||||
| PM10 | 0.44 *** |
Comparison of PM trapping capacity by genus
The PM trapping capacity of succulents was analyzed based on both fresh weight (µg/g) and per plant unit (µg/plant) (Table 3). As a result, PM10 trapping per unit fresh weight was high in genera Haworthia (215.6 µg/g), Echeveria, and Sedum, ranging from 135.2 to 215.6 µg/g. PM10 trapping per plant was the highest in Haworthia (13,489 µg/plant), followed by Echeveria (9,761 µg/plant). In contrast, Adromischus (2,188 µg/plant) and Cotyledon (2,949 µg/plant) showed relatively low values. A similar trend was observed for PM2.5 trapping per plant, with Haworthia (6,727 µg/plant), Echeveria (1,169 µg/plant), and Sedum (1,439 µg/plant) showing high levels, consistent with the pattern found for PM10 trapping. These findings suggest that genus-level differences in PM trapping capacity are associated with variations in leaf surface texture and growth form, highlighting the role of structural traits in PM deposition.
Table 3.
Comparison of particulate matter (PM) trapping capacity among succulent plants genera
Discussion
Crassulacean acid metabolism (CAM) plants, such as succulents, can survive in environments with low precipitation and high evapotranspiration (Cushman 2001). This is an adaptive result of genetic evolution to their native habitats, minimizing water loss through anatomical features such as a thick cuticle, a low surface area-to-volume ratio, low stomatal density, and densely arranged mesophyll cells (Lüttge 2008). For instance, species in the genus Echeveria grow naturally on rocky outcrops or cliffs with minimal soil and have evolved a flattened growth form to adapt to such environments (Schulz and Kapitany 2010). This study examined the morphological characteristics of various succulent species and confirmed significant differences in leaf number, leaf size, and the presence of trichomes among cultivars (Fig. 1 and Table 1).
The cristate cultivar E. fimbriata f. cristata had the highest number of leaves, with an average of 507.7 leaves, and also exhibited the highest PM10 deposition at 504.0 µg/g (Table 1 and Fig. 2). In contrast, the non-cristate cultivar Echeveria ‘Green Surf’ showed a comparable leaf count (492.3 leaves on average) but significantly lower PM10 deposition of 104.8 µg/g, approximately 4.8 times lower than that found for E. fimbriata f. cristata. Cristate mutations result from growth point modifications, leading to a spiral arrangement of leaves and formation of curved or ridged stems (Schulz and Kapitany 2010). These structural characteristics likely contributed to increased PM10 deposition (Figs. 1 and 2). However, another cristate cultivar, E. pulidonis f. cristata, showed a much lower PM10 deposition amount (127.9 µg/g), approximately 3.9 times lower than that found for E. fimbriata f. cristata. This difference was presumably due to variations in leaf thickness and stiffness, which affected the strength of the cristate growth pattern.
Differences in the PM10 trapping capacity among succulent cultivars were closely related to leaf number and size. Previous studies reported that smaller leaves enhance the edge effect and increase PM10 deposition owing to turbulence formation (Weerakkody et al. 2017). In the present study, cultivars with a higher number of leaves tended to have smaller individual leaf sizes, and the PM10 trapping capacity increased with the number of leaves (Table 1 and Fig. 2). This trend is consistent with previous studies showing that coniferous species with small leaves, such as Pinus nigra and Cupressocyparis leylandii, exhibit higher PM deposition rates (Beckett et al. 2000; Freer-Smith et al. 2005).
Trichomes play a crucial role in plant adaptation by reflecting light, regulating leaf temperature, and reducing transpiration to mitigate environmental stress (Oksanen 2018). Additionally, they contribute to PM deposition by increasing the leaf surface area (Beckett et al. 2000; Leonard et al. 2016). Trichomes create complex microtopography on the leaf surface, generating turbulence and preventing the resuspension of deposited particles (Prusty et al. 2005). Some plant species also exhibit wax layers with surface charges that promote PM deposition by creating an uneven charge distribution (Fernández et al. 2014). In this study, E. fimbriata f. cristata and H. fasciata, which possess pubescent leaves and tubercles, respectively, showed significantly higher PM10 and PM2.5 deposition than the other cultivars (Fig. 2). These findings suggest that trichomes in succulents, similar to those in other plant species, induce turbulence and inhibit particle resuspension, allowing leaves with protruding structures to retain PM more effectively than glabrous leaves.
Based on the above findings, a correlation analysis between morphological traits and PM trapping revealed that leaf number and the presence of trichomes were key factors affecting the PM trapping capacity. In particular, trichomes showed a significant correlation with PM2.5 trapping (r = 0.48***), indicating their effectiveness in capturing fine PM (Table 2). Currently, commercial standards for air-purifying plants are not well established; however, based on previous studies, PM10 trapping per unit fresh weight (µg/g) in indoor plants such as Dieffenbachia (150.0 µg/g) and Spathiphyllum (156.4 µg/g) has been reported (Kwon and Park 2018). These findings may support the selection of succulent cultivars with favorable morphological traits for indoor air purification applications.
Conclusions
In this study, we evaluated the PM10 trapping capacity of succulents, particularly in the genera Echeveria and Haworthia, which ranged from 135.2 to 215.6 µg/g. These values were comparable to, or even exceeded, those of common indoor foliage plants (Table 3). These findings suggest that the complex surface structures of succulents, such as trichomes, tubercles, and cristate forms, play critical roles in PM trapping. Nevertheless, this study has limitations, including possible confounding factors such as water content and the lack of trichome density data, and the observed relationships are correlational rather than causal. In particular, trichome presence was used as a binary variable, but with only two cultivars exhibiting this characteristic, the resulting dataset was unbalanced and may have reduced the statistical power. Therefore, further studies are needed to explore not only external factors, such as leaf thickness and stiffness, but also internal traits, including water content, trichome density, length, curvature, and genetic variations, that may influence PM trapping efficiency. The results of this study may inform the selection and breeding of succulent cultivars for indoor environments with high PM exposure.
