

Introduction
Materials and Methods
Plant materials and seedling establishment
Transplanting and hydroponic system
FRT nutrient management
Plant maintenance and pollination
Fruit management and experimental treatments
Experimental design and sampling procedure
Fruit marketability classification
Texture properties
Statistical analysis
Results
Fruit development of melon after pollination
Quality characteristics of melon
Yield and yield components of melon
Hardness, stickiness, and color of melon
Fruit number and marketability
Marketable fruit weight
Marketable yield per unit area
Correlation among fruit traits, firmness characteristics, and yields
Principal component analysis (PCA)
Discussion
Conclusion
Introduction
Melon (Cucumis melo L.) is one of the most important horticultural crops in the Cucurbitaceae family and is widely cultivated worldwide owing to its attractive appearance, pleasant aroma, sweetness, and nutritional value. According to FAOSTAT, global melon production was approximately 29 million tonnes in 2023. This substantial production reflects the increasing economic importance of melon in domestic and international markets (Silva et al. 2025). Melon fruits are rich in vitamins, minerals, and bioactive compounds that contribute to human health and nutrition (Laur and Tian 2011). In addition, melon peel and seeds contain phytochemicals with antioxidant properties and potential health-promoting effects (Rolim et al. 2018; Gómez-García et al. 2020; Oliveira et al. 2021). Consequently, melon has become an increasingly valuable crop for both fresh consumption and value-added food products. The increasing demand for high-quality melon has encouraged growers to adopt intensive production systems that maximize yield while maintaining fruit quality. Melon cultivation is economically attractive owing to the relatively short production cycle and high market value of melons (Phankaen and Kumpanuch 2025). However, achieving an appropriate balance between fruit yield and fruit quality remains a major challenge. Commonly in commercial production, growers regulate the number of fruits per plant to improve the fruit size and marketability. Generally, retaining only one fruit per plant enhances fruit size and quality but limits total productivity. Conversely, increasing the fruit number may increase the total yield but often reduces the fruit size, texture quality, and marketability due to increased competition among the developing fruits for assimilates and nutrients (Ferreira et al. 2016). Therefore, optimizing the fruit load is an important crop management practice for improving production efficiency and profitability.
Hydroponic cultivation has emerged as an alternative production system that enables precise control of the water and nutrient supply while minimizing soil-related constraints (Rajaseger et al. 2023; Supriyanta et al. 2023). Hydroponic systems can improve crop productivity, nutrient-use efficiency, and product quality while reducing the need for pesticide applications and reducing environmental impacts (Yam et al. 2020; Phankaen and Kumpanuch 2025). The FRT is a hydroponic production system in which plants are supported above a nutrient solution while their roots are suspended directly in the solution, allowing continuous access to water and dissolved nutrients. FRT also differs from floating-raft systems in which plants are commonly supported by floating rafts that cover or float on the nutrient solution surface. The FRT system has been used for hydroponic melon production and provides plant roots with direct access to the nutrient solution (Fatahian et al. 2013). Previous studies have demonstrated the potential of hydroponic systems for melon production under protected environments (Fatahian et al. 2013; Atherton and Li 2023). In addition, sustainable hydroponic production systems may contribute to the United Nations Sustainable Development Goal 2 (SDG 2: Zero Hunger), particularly Target 2.3, which aims to increase agricultural productivity and the incomes of small-scale food producers (United Nations 2015).
In this study, fruit load refers to the number of fruits retained per plant after fruit thinning. Fruit load is a critical factor affecting source–sink relationships in fruit crops. The relationship between the photosynthetic source capacity and reproductive sink demand directly influences fruit growth, yield formation, and quality development (Marcelis 1996; Valantin-Morison et al. 2006). An excessive fruit load may increase competition among the fruits for photoassimilates, resulting in reductions in the fruit size, firmness, and marketability, whereas an insufficient fruit load may limit overall productivity. Previous studies have shown that fruit load can influence fruit growth and development in horticultural crops (Bertin 2005), while studies in melon have reported relationships between fruit load, yield, and fruit quality (Cai et al. 2023). However, most available studies were conducted under soil-based or substrate cultivation systems. Notably, although fruit-load regulation has been widely studied in soil-based and substrate-grown melon production systems, there is little available quantitative information linking fruit load with marketable productivity, fruit firmness, and/or quality-related traits under FRT hydroponics. Furthermore, little information is available regarding the optimal fruit load required to maximize the marketable yield while maintaining acceptable fruit quality under tropical greenhouse conditions. A better understanding of fruit-load regulation is essential for developing efficient production strategies that maximize productivity while maintaining acceptable levels of fruit quality. Therefore, the present study aimed to evaluate the effects of different fruit-load levels on the fruit growth, yield components, marketable productivity, and fruit quality of hydroponically grown melon (Cucumis melo L. cv. Baramee) cultivated under greenhouse conditions using a FRT system. It was hypothesized that maintaining a moderate fruit load would optimize the source sink balance, resulting in a greater marketable yield while preserving acceptable fruit quality under FRT conditions.
Materials and Methods
Plant materials and seedling establishment
Initially, approximately 500 seeds were germinated, with seedlings with uniform characteristics subsequently selected for transplantation. Seeds were pre-soaked in warm water (40–60°C) for 2 h to promote uniform germination (Fig. 1), after which they were incubated in a moist cloth under ambient conditions for 12 h and then maintained under high humidity for an additional 48 h until radicle emergence. Uniformly germinated seeds were selected and sown individually in sponge cubes for seedling establishment. After emergence, seedlings were exposed to natural light conditions to prevent excessive elongation. Individual sponge cubes were separated during early growth to avoid root entanglement and mechanical damage. Then, seedlings with four to five true leaves were transplanted into the FRT hydroponic system.
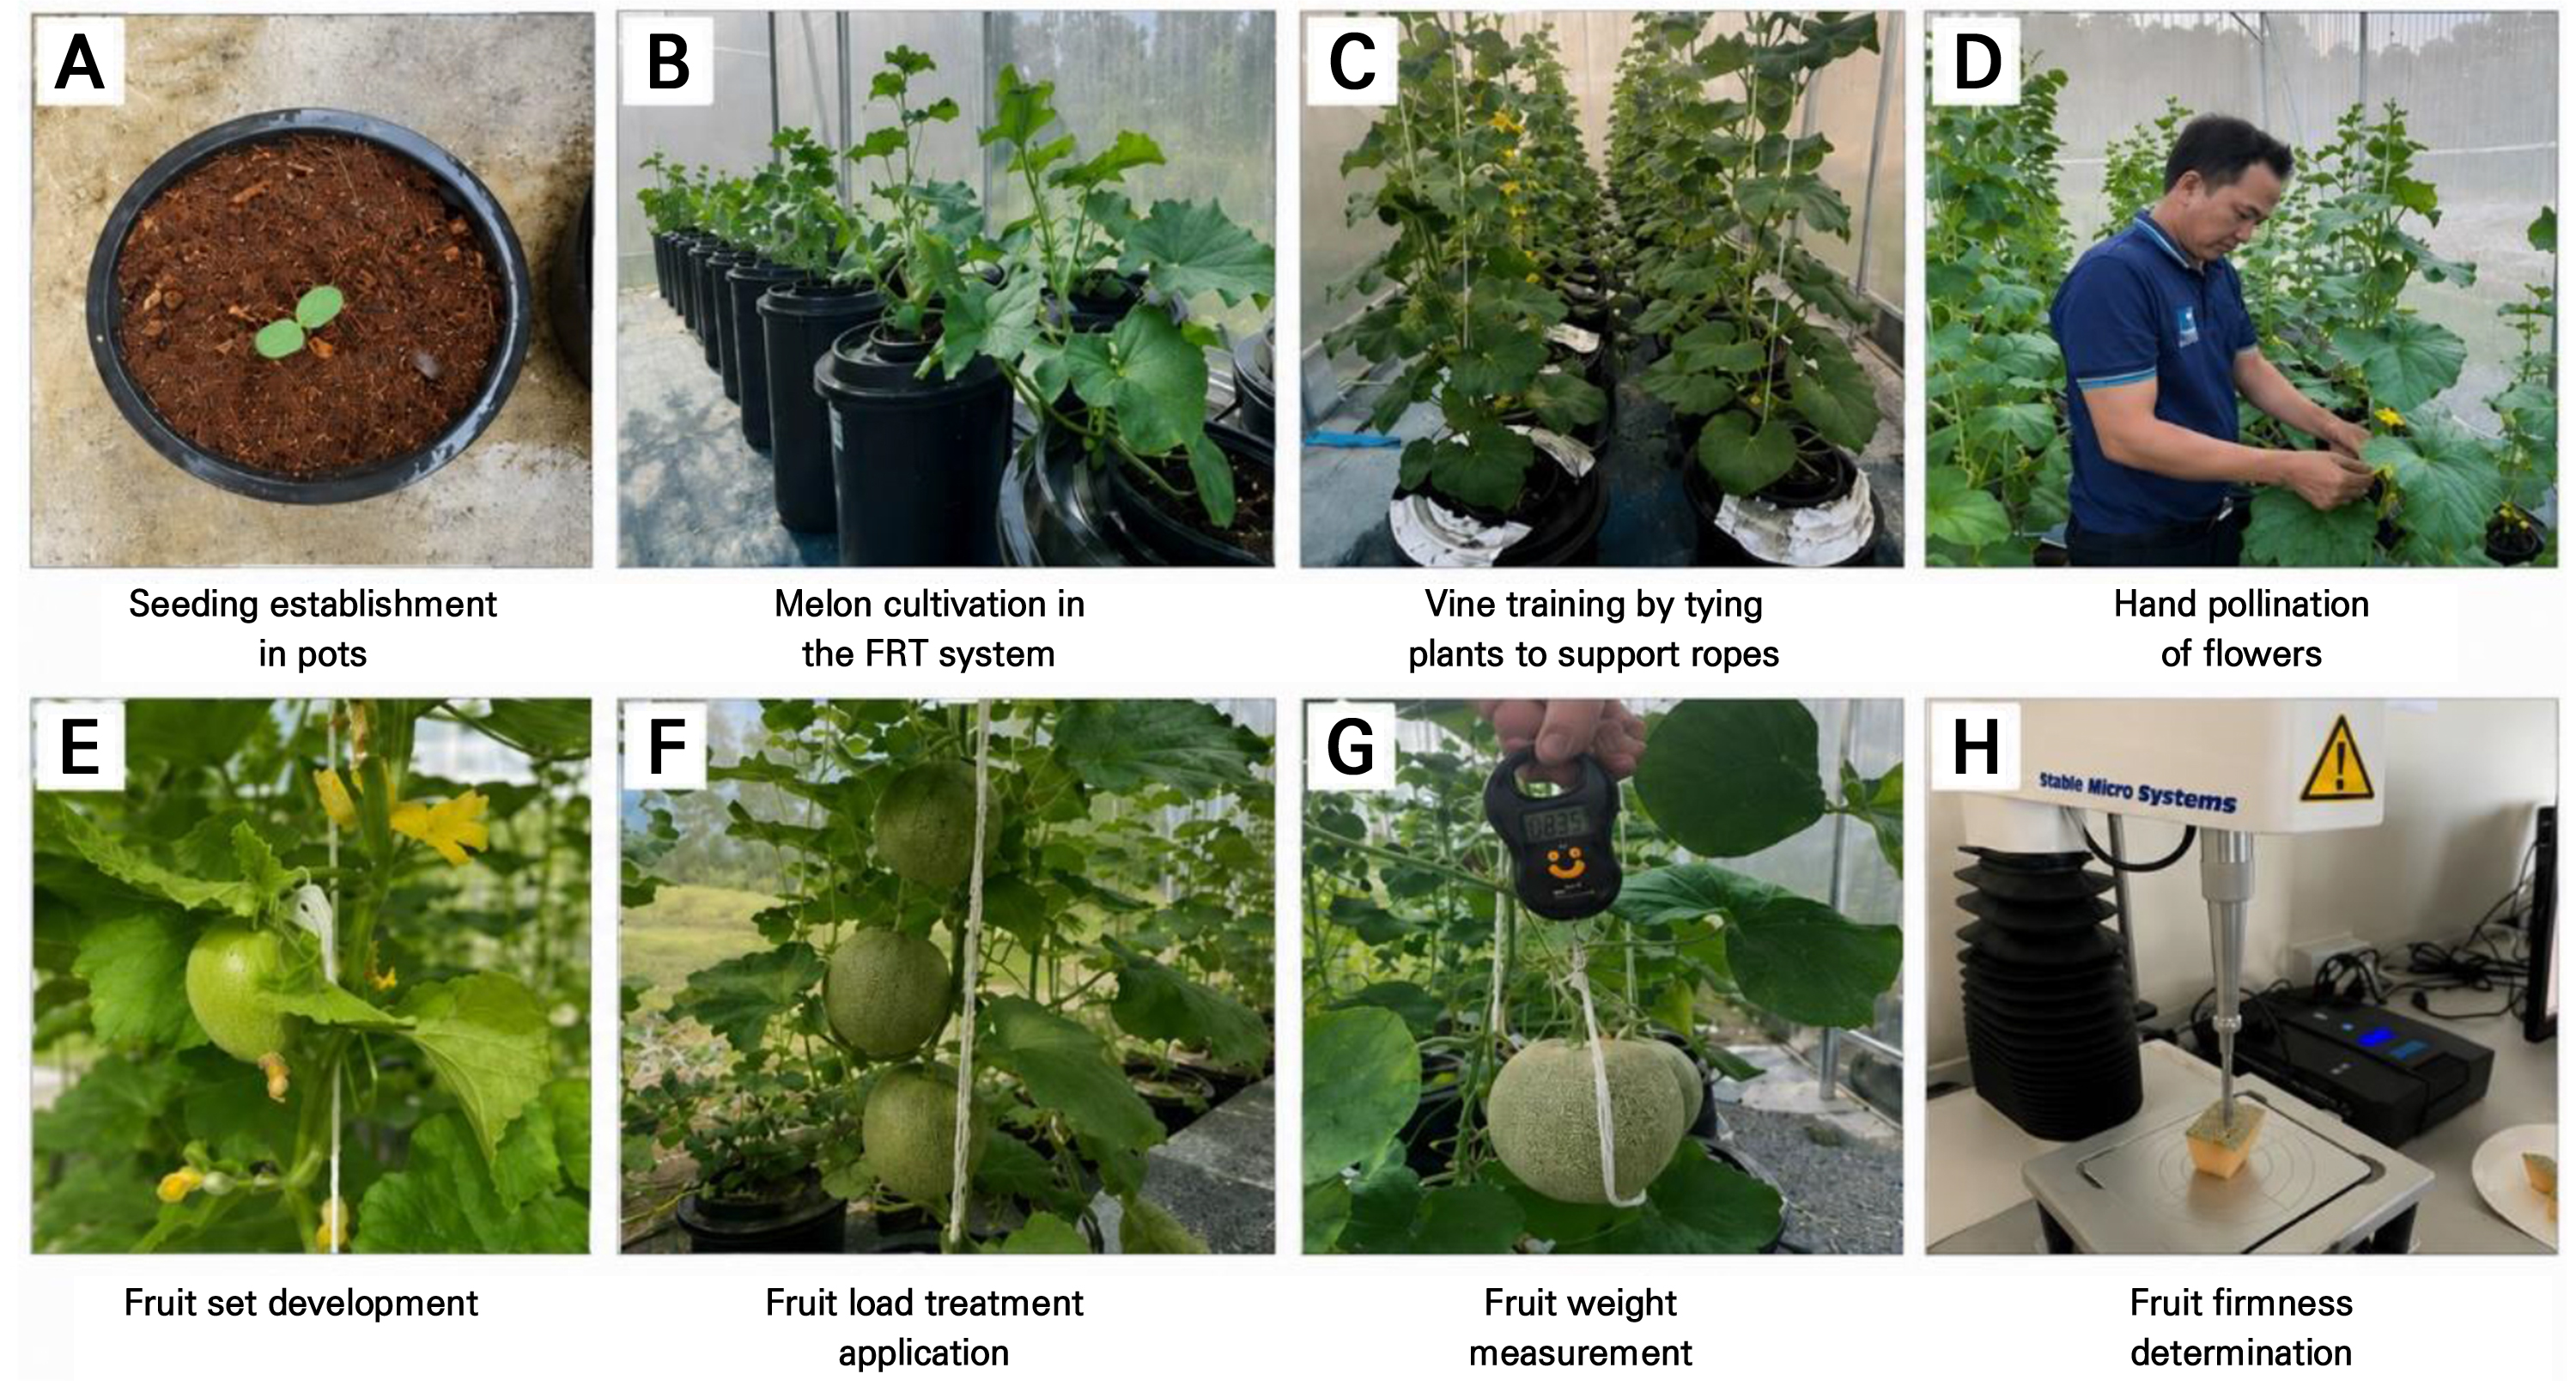
Fig. 1.
Melon cultivation. (A) Seedling establishment in a pot, (B) Melon cultivation using the FRT technique, (C) Vine training by tying plants to support ropes, (D) Hand pollination, (E) Fruit set development, (F) Fruit-load treatment application, (G) Fruit weight measurement, (H) Fruit firmness determination.
Transplanting and hydroponic system
At 14 days after sowing, uniform seedlings with four to five true leaves were transplanted into a hydroponic system based on the FRT system under greenhouse conditions at Thaksin University, Phatthalung campus, in Phatthalung province of Thailand. Generally, the air temperature was in the range 28–35°C and the relative humidity was in the range 65–85%. The plant spacings were 40 cm within rows and 60 cm between the rows. The FRT hydroponic system consisted of cylindrical containers with an opening diameter of 30 cm and a height of 30 cm, with a capacity of 18.925 L. The system was operated as a static nutrient-solution system, with plant roots maintained in direct contact with the nutrient solution. Each container was aerated using an air pump (model 1200 AP). Water was added weekly to compensate for water loss and to maintain the solution volume.
FRT nutrient management
Nutrient solutions were prepared using a two-part hydroponic fertilization system. Fertilizer solution A consisted of calcium nitrate [Ca(NO3)2·4H2O] at 950 g·L-1, Fe-EDTA at 50 g·L-1, and a commercial micronutrient mixture at 50 g·L-1. Fertilizer solution B contained potassium nitrate (KNO3) at 600 g·L-1, magnesium sulfate (MgSO4·7H2O) at 500 g·L-1, monopotassium phosphate (KH2PO4) at 250 g·L-1, and manganese chelate (Mn-EDTA) at 20 g·L-1. The stock solutions were diluted at a rate of 5 mL·L-1 of solution A and 5 mL·L-1 of solution B. Based on this dilution rate, the final macronutrient concentrations in the nutrient solution were approximately 979 mg·L-1 N, 285 mg·L-1 P, 1,519 mg·L-1 K, 806 mg·L-1 Ca, 247 mg·L-1 Mg, and 325 mg·L-1 S. Both stock solutions were applied weekly for eight weeks throughout the cultivation period to support plant growth and development. In addition, a potassium-rich fertilizer (N-P-K at 0–0–50) was supplemented at six weeks after transplanting at a rate of 1.0 g·L-1 to enhance fruit sweetness and improve fruit quality. The nutrient solution pH was maintained in the range of 5.5–6.5, while the electrical conductivity (EC) was maintained within the range of 1.5–2.5 dS·m-1 to ensure optimal nutrient availability and uptake throughout the cultivation period
Plant maintenance and pollination
Melons were trained vertically using a support string tied gently and secured below the first node after the removal of cotyledons, ensuring minimal damage to the stem. Lateral shoots at nodes 1–8 were removed to promote main-stem development. In addition, old lower leaves and leaves in contact with the ground were removed to improve air circulation and reduce the risk of downy mildew and powdery mildew. The same plant-management practices were applied uniformly to all treatments. Flowering occurred at approximately 21–23 days after transplanting. Controlled pollination was performed by selecting female flowers located between the eighth and twelfth nodes. Manual pollination was conducted between 06:00 and 10:00 to facilitate fertilization and minimize unintended cross-pollination. Fruits from all treatments were harvested simultaneously at 42 days after pollination (DAP).
Fruit management and experimental treatments
After fruit set, fruit loading was carried out according to the experimental design by retaining a predetermined number of fruits per plant. Only fruits of a uniform size and showing normal development were selected. Developing fruits were supported using a hanging system to reduce mechanical stress and prevent physical damage during growth. Plants were monitored continuously and managed throughout the experimental period following standard cultural practices. The experiment consisted of four fruit-loading treatments: (1) one fruit per plant, (2) two fruits per plant, (3) three fruits per plant, and (4) four fruits per plant. The single-fruit treatment was designated as the control, as it represents the conventional practice commonly adopted by melon growers for achieving high fruit quality.
Experimental design and sampling procedure
The experiment was conducted in a greenhouse at the Department of Plant Science, Faculty of Agriculture, Thaksin University, Phatthalung Campus, Thailand (7°37'N, 100°05'E). The melon cultivar used in this study was ‘Baramee’, a Japanese-style netted melon supplied by Thep Mongkol Farm, Thailand. The experiment was arranged in a completely randomized design (CRD) with four fruit-load treatments: one, two, three, and four fruits per plant, with four replications per treatment. Each replication consisted of eight plants, resulting in a total of 128 plants in the experiment. Four plants were randomly selected from each replication for data collection. The mean value of the four sampled plants within each replication was used as one experimental observation for the statistical analysis. Thus, four replication means (n = 4) were used for each treatment in the statistical analysis, while the remaining plants served as non-sampled plants within each replication. The four fruit-load treatments were randomly assigned to plant positions throughout the available greenhouse growing area. Plants representing each treatment were distributed across different positions rather than being confined to a specific section or location within the greenhouse. This randomization scheme was used to minimize potential positional effects associated with differences in light exposure, temperature, ventilation, and edge effects.
Fruit marketability classification
Fruit marketability was evaluated at harvest based on predefined criteria established for this study. Fruits were classified as marketable when they weighed 1.2–2.5 kg·fruit-1, had a normal and well-rounded shape, exhibited prominent and uniformly distributed netting over the entire fruit surface, and showed no visible symptoms of disease or insect damage. Fruits that failed to meet one or more of these criteria were classified as unmarketable. Fruit grading was performed at harvest by the researchers and research team using the predefined criteria. No national grading standard was applied; the classification was based on the commercial-quality criteria established for this experiment.
Texture properties
A texture profile analysis of the melon samples was conducted using a texture analyzer (TA-XT Plus, Stable Micro Systems, UK) equipped with a needle-type puncture probe. Melon samples were cut into 2 × 2 cm pieces, and the force required to penetrate the sample surface was measured at a test speed of 2 mm·s-1 with a penetration depth of 10 mm, as described by Tangthanantorn et al. (2021). Five measurements were taken at different points on each fruit. Hardness (penetration force) and stickiness were recorded and expressed in newtons (N). Stickiness was defined as the force required to detach the probe from the sample after penetration.
Statistical analysis
The recorded data were analyzed using SPSS software (Statistical Package for the Social Sciences, version 25.0 for Windows; IBM Corp., USA). Analysis of variance (ANOVA) was performed to evaluate treatment effects, and mean comparisons were conducted using the least significant difference (LSD) test at a significance level of p < 0.05. Results were presented as the mean ± standard deviation. For the correlation analysis and principal component analysis (PCA) conducted here, the dataset consisted of 16 observations, representing four treatments with four replications each. The mean value of the sampled plants within each replication was used as one observation. Total fruit yield per plant was used as the yield variable for the correlation analysis and PCA.
Results
Fruit development of melon after pollination
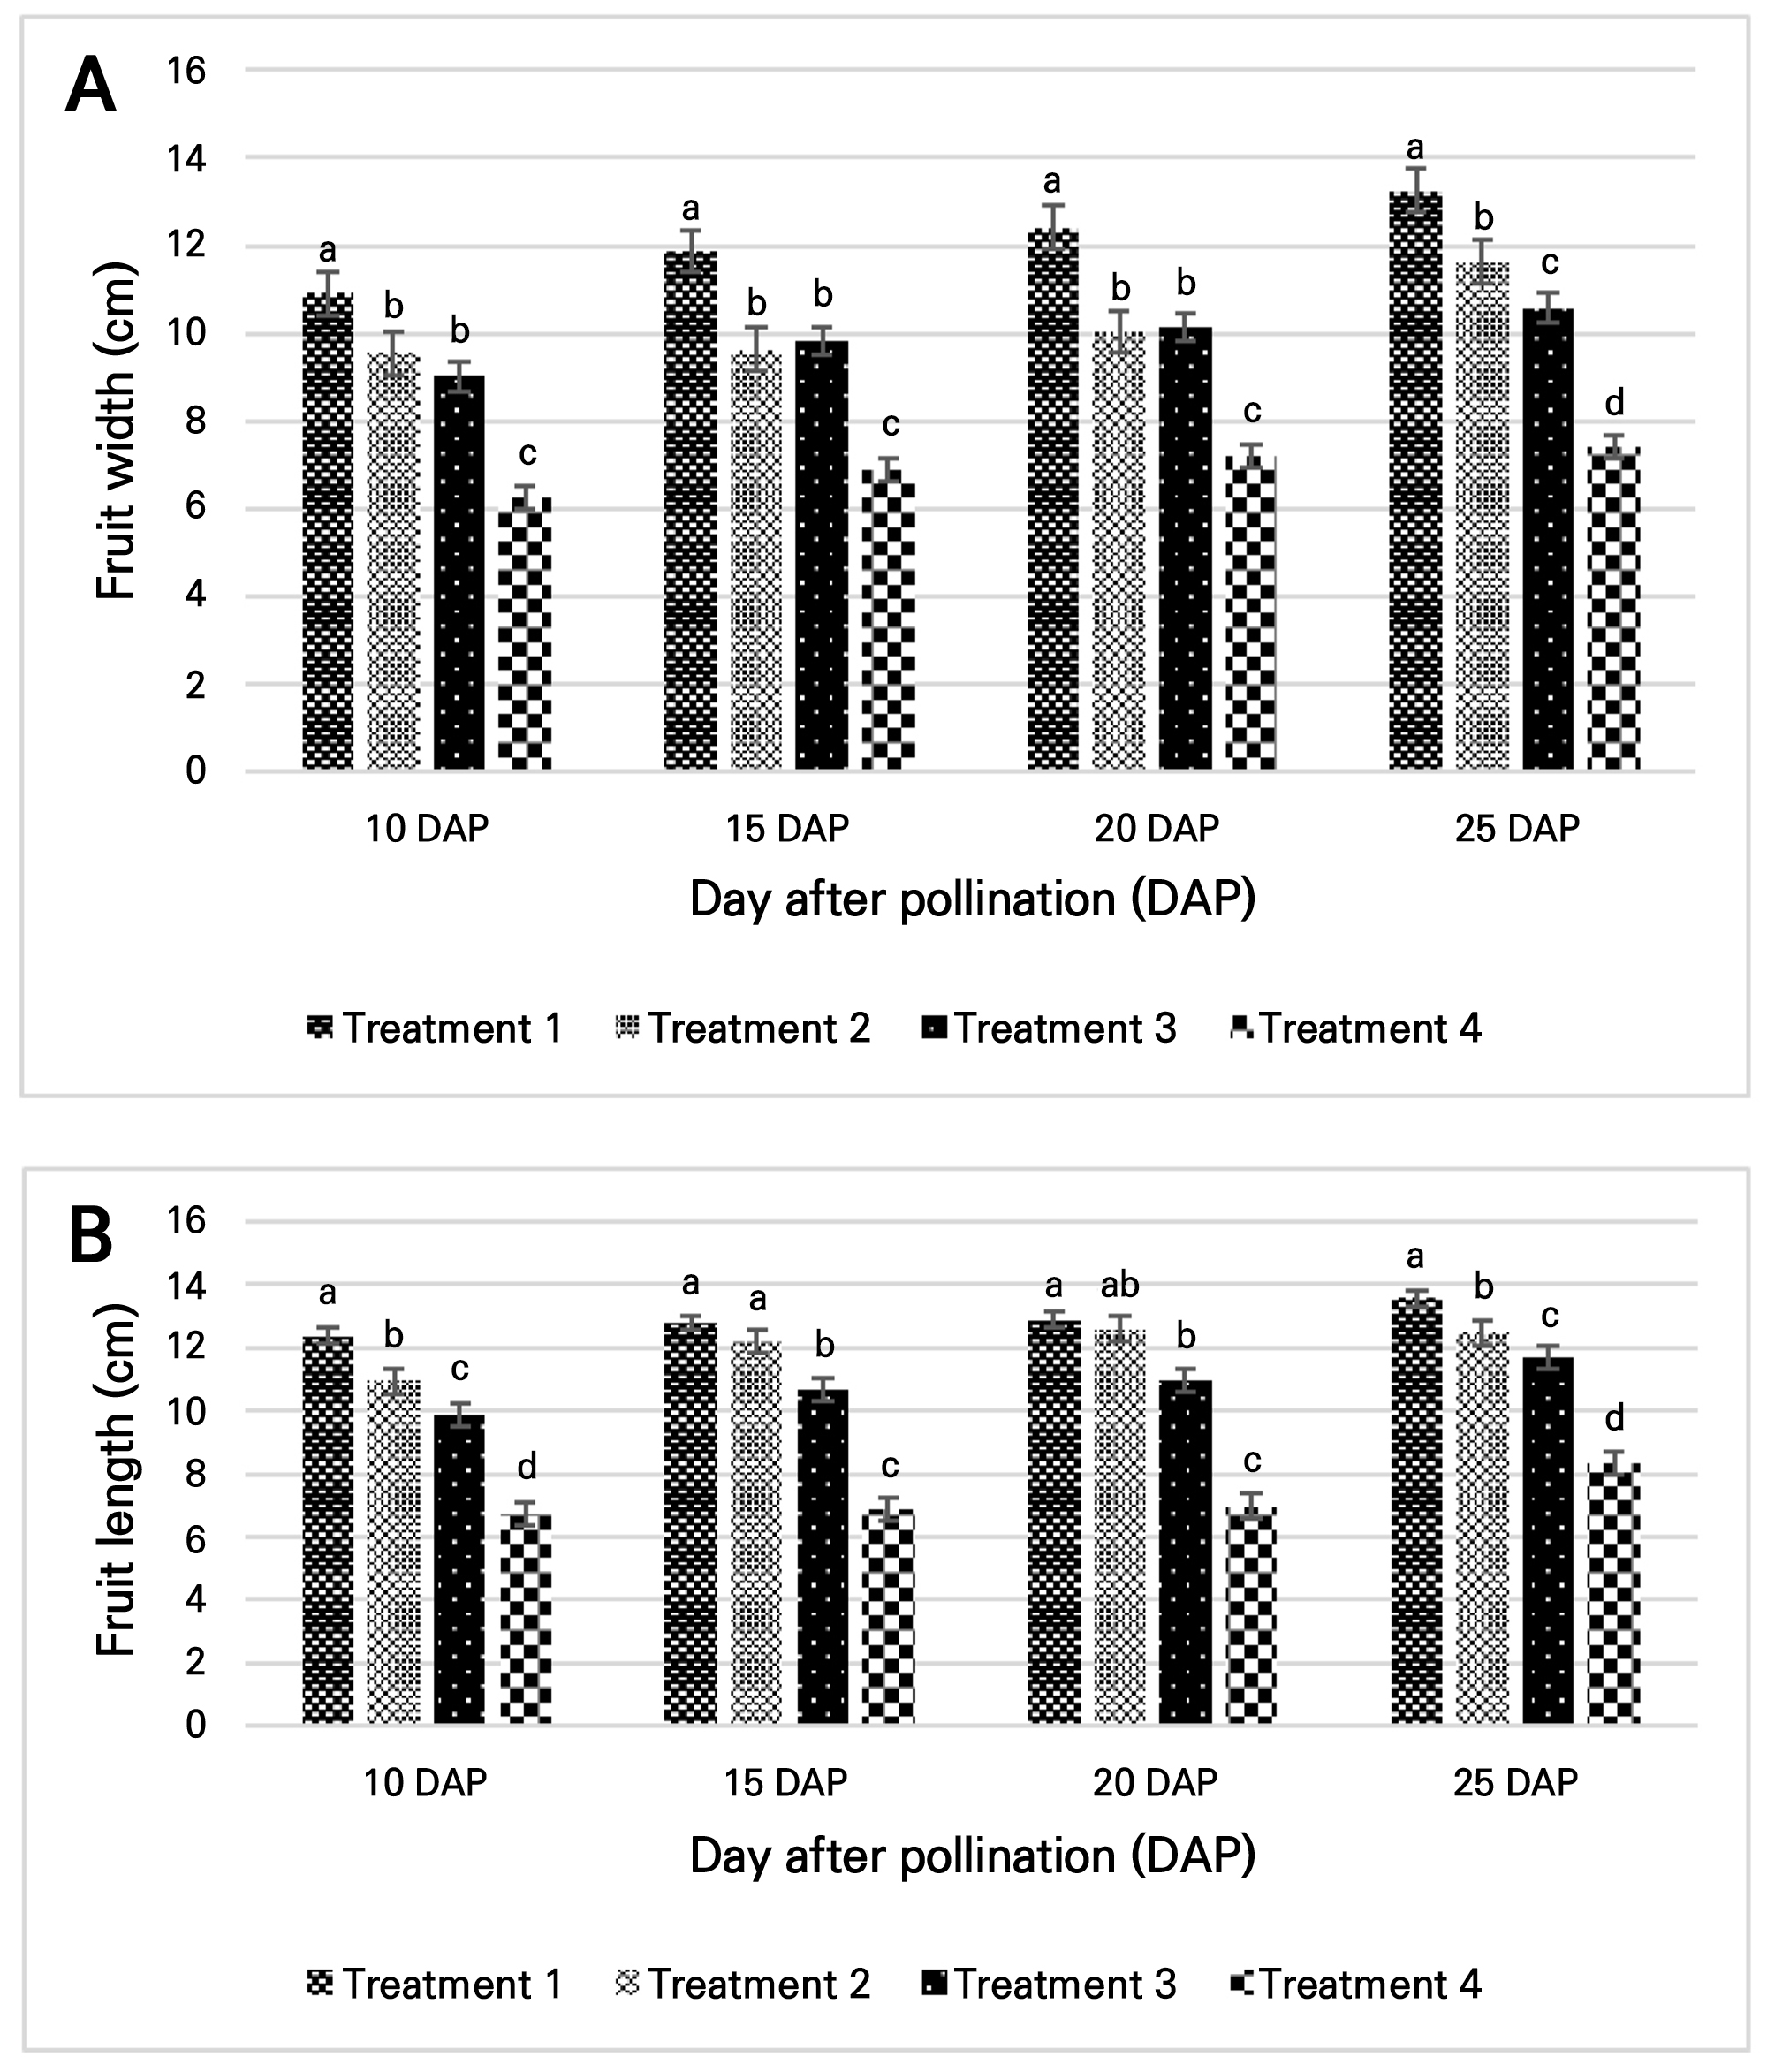
The effects of the fruit load on melon fruit growth were evaluated based on four treatments in the green house. Several fruit growth parameters increased progressively with fruit age in all treatments. However, there were significant differences among the treatments for both of these parameters. Fruit width increased consistently over time in all treatments, with significant differences among fruit-load levels. Treatment 1 produced the widest average fruit width at all observation periods, with results reaching 10.90, 11.87, 12.42, and 13.25 cm at 10, 15, 20, and 25 DAP, respectively (Fig. 2). Similarly, fruit length increased with fruit age in all treatments, with significant differences also observed among the fruit-load treatments. Treatment 1 produced the longest fruit length, with an average of 13.55 cm, followed by Treatments 2, 3, and 4, which recorded corresponding average fruit lengths of 12.45, 11.66, and 8.32 cm (Fig. 2).
Quality characteristics of melon
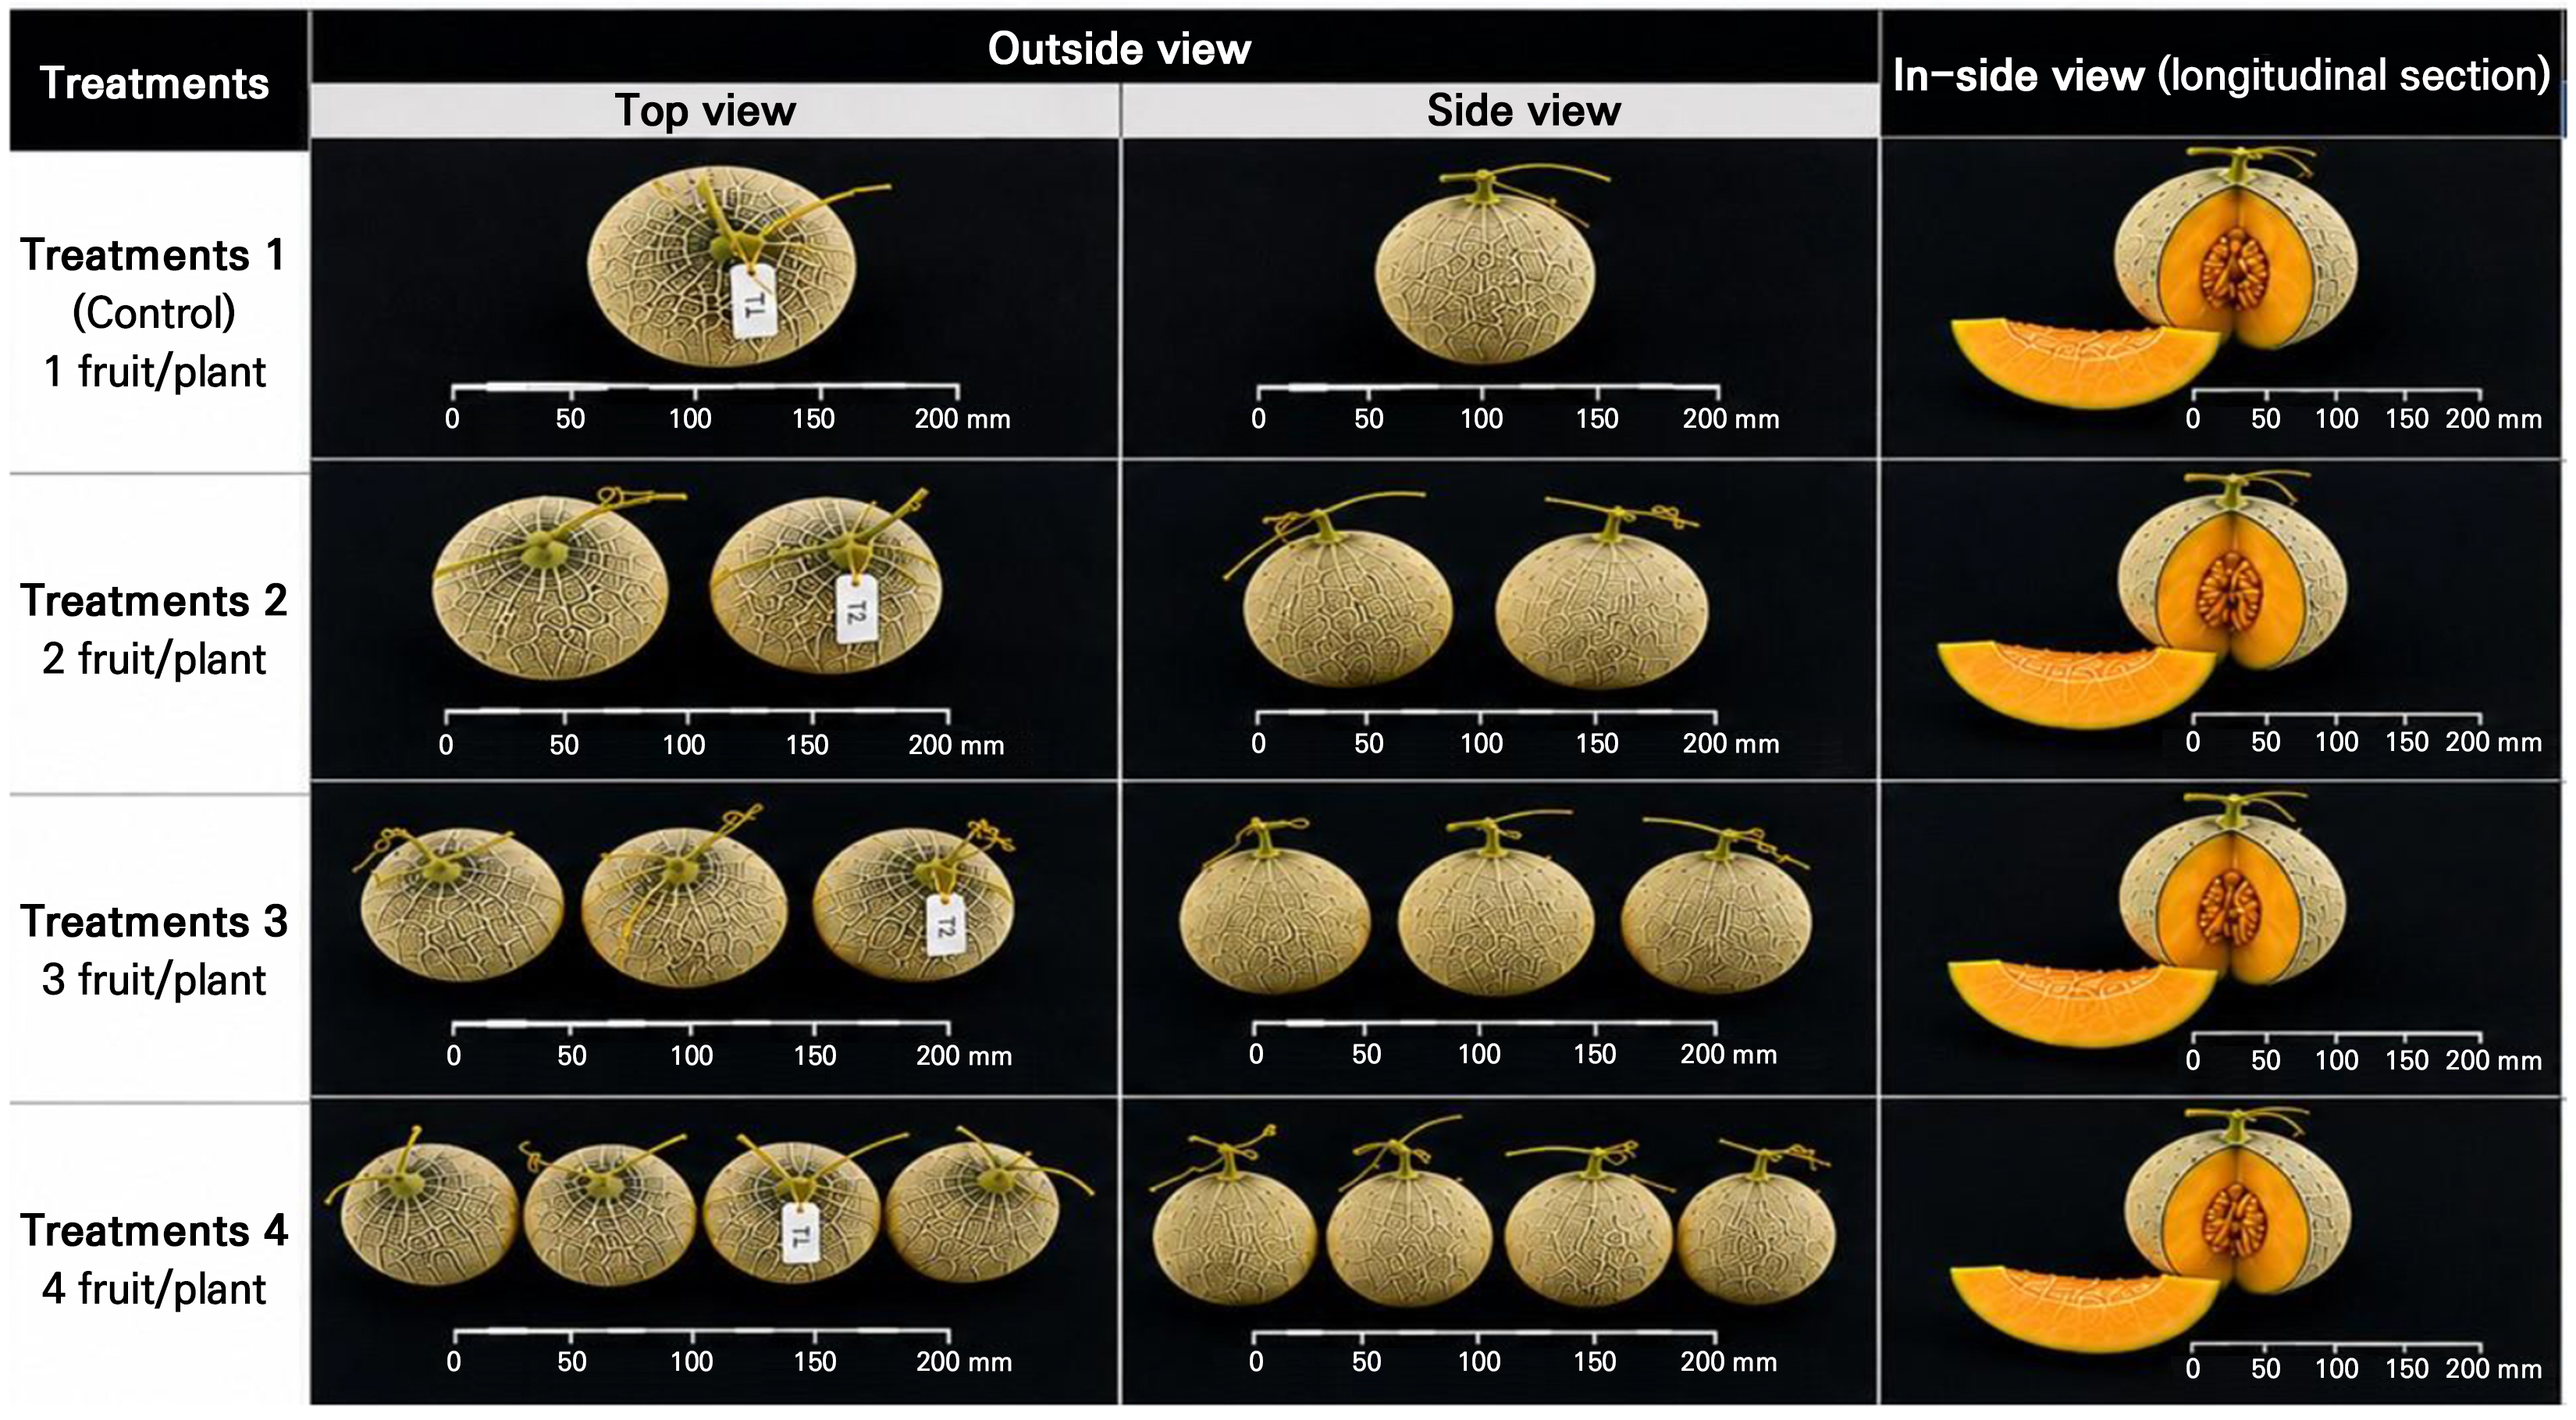
Figure 3 shows that based on the external and internal fruit characteristics, the melons from all treatments had similar morphological features, differing mainly in terms of their fruit sizes. The flesh color was uniformly yellow across the treatments. However, there were differences in the fruit size, which was larger in Treatment 1 than in the other treatments.
Yield and yield components of melon
The yield characteristics and important yield components of melon serve as key indicators for evaluating production performance outcomes. Treatment 1 produced the greatest mean fruit weight (1,786.42 g·fruit-1), although the value in this case was not significantly different from that of Treatment 2 (1,531.88 g·fruit-1). In contrast, Treatments 3 and 4 had significantly lower mean fruit weights. Fruit yield per plant was determined as the total fresh weight of all fruits harvested from each sampled plant and was expressed as g·plant-1. For each replication, the mean fruit yield per plant was calculated from four sampled plants and used as one experimental observation. The treatment mean and standard deviation were calculated from the four replication means (n = 4). Treatment 4 had the highest numerical fruit yield per plant (3,491.88 g·plant-1), followed by Treatments 3, 2, and 1, with values of 3,141.99, 3,063.76, and 1,786.42 g·plant-1, respectively. There were no significant differences in fruit yield per plant among Treatments 2, 3, and 4 (Table 1). Treatment 1 had the highest numerical fruit width value (132.47 mm), although it was not significantly different from that of Treatment 2 (127.92 mm). Treatments 3 and 4 had lower mean fruit widths of 119.24 and 115.38 mm, respectively. Treatment 1 also produced the longest fruit length (135.48 mm), followed by Treatments 2, 3, and 4, which recorded mean fruit lengths of 124.51, 116.58, and 83.21 mm, respectively.
Table 1.
Fruit yield and yield components of hydroponic melon as affected by the treatment (fruit load)
| Treatment | Melon yield and yield components | |||
|
Fruit width (mm) |
Fruit length (mm) |
Fruit yield·fruit-1 (g) |
Fruit Yield·plant-1 (g) | |
| Treatment 1 | 132.47 a | 135.48 a | 1,786.42 a | 1,786.42 b |
| Treatment 2 | 127.92 a | 124.51 b | 1,531.88 a | 3,063.76 a |
| Treatment 3 | 119.24 b | 116.58 bc | 1,047.33 b | 3,141.99 a |
| Treatment 4 | 115.38 b | 83.21 d | 872.97 b | 3,491.88 a |
| F-test | * | * | * | * |
| LSD0.05 | 7.49 | 8.08 | 275.43 | 498.25 |
| CV. | 7.47 | 6.06 | 9.18 | 10.21 |
The analysis of the chemical properties revealed that the different treatments had no significant effects on the pH, total soluble solids content, ascorbic acid content, and titratable acidity (p > 0.05 for F-test results). The pH values were in the range of 6.93–7.05, with Treatment 4 having the highest value (7.05 ± 0.03) and Treatment 2 the lowest (6.93 ± 0.04). Total soluble solids were relatively consistent among the treatments (14.33–14.35°Brix). The ascorbic acid content was in the range of 61.16–84.04 mg·100 g-1, with Treatment 2 having the highest value (84.04 ± 3.53 mg·100 g-1) and Treatment 4 the lowest (61.16 ± 2.89 mg·100 g-1). However, these differences were not statistically significant. Titratable acidity was in the range of 0.74–0.90%, with the highest value in Treatment 2 (0.90 ± 0.04%) and the lowest in Treatment 4 (0.74 ± 0.01%), again with no significant differences among the treatments. The coefficients of variation (CVs) were in the range 6.47–9.98%, indicating acceptable experimental variability (Table 2).
Table 2.
Chemical quality attributes of melon fruits as affected by the fruit load
| Treatment | pH | °Brix |
Ascorbic mg acid 100 g-1 |
Titratable acidity (%) |
| Treatment 1 | 6.94 ± 0.02 | 14.33 ± 0.05 | 79.95 ± 3.51 | 0.84 ± 0.01 |
| Treatment 2 | 6.93 ± 0.04 | 14.33 ± 0.07 | 84.04 ± 3.53 | 0.90 ± 0.04 |
| Treatment 3 | 7.00 ± 0.02 | 14.34 ± 0.08 | 71.11 ± 2.50 | 0.81 ± 0.02 |
| Treatment 4 | 7.05 ± 0.03 | 14.35 ± 0.09 | 61.16 ± 2.89 | 0.74 ± 0.01 |
| F-test | ns | ns | ns | ns |
| LSD0.05 | 0.19 | 0.09 | 29.25 | 0.31 |
| CV. | 6.47 | 6.47 | 9.58 | 9.98 |
Hardness, stickiness, and color of melon
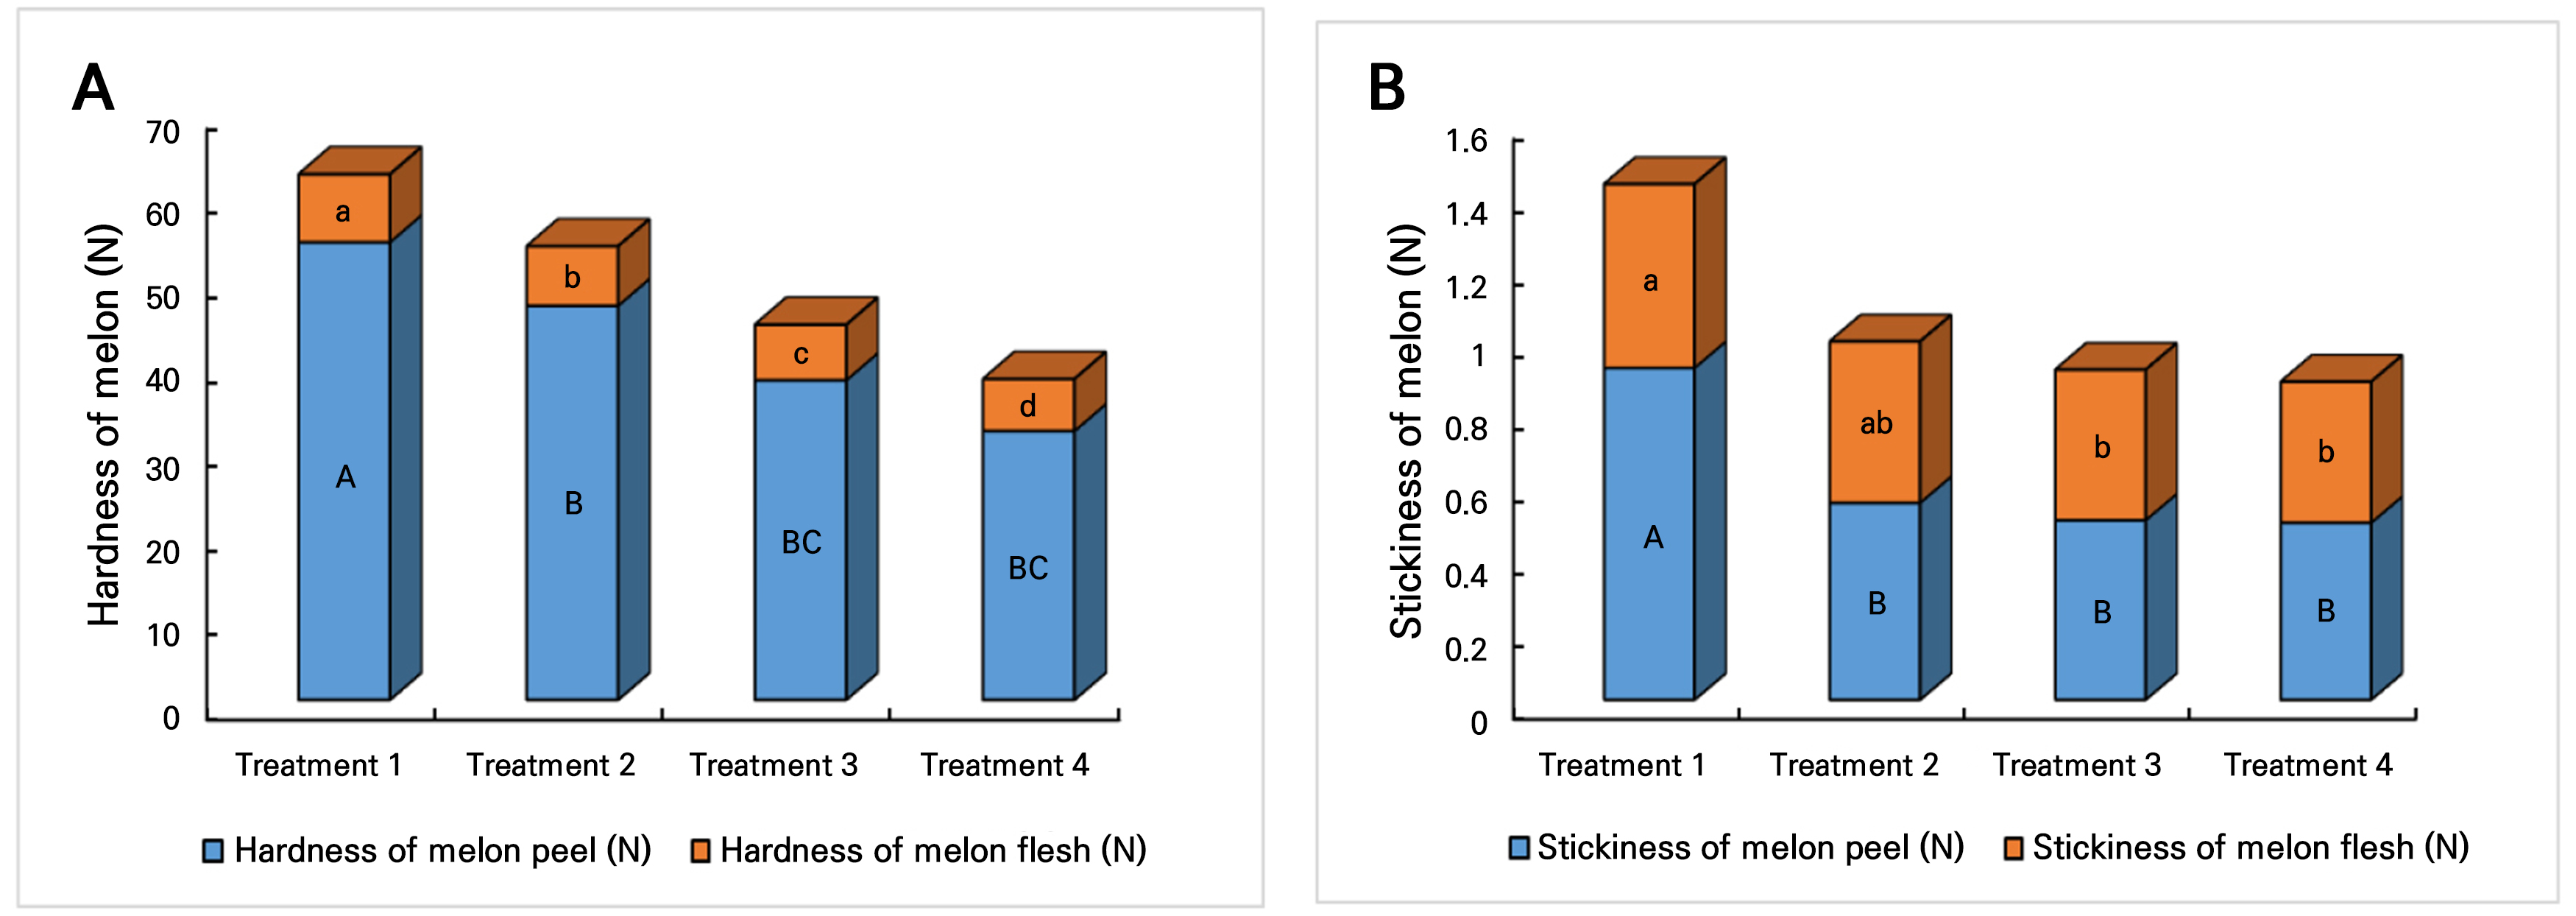
After harvest, melon fruit texture was evaluated by measuring the hardness (penetration force) and stickiness of the peel and flesh using a texture analyzer. Significant differences were observed among the treatments in the hardness of both the peel and flesh. For the melon peel, Treatment 1 had the highest hardness (54.19 ± 5.61 N), which was significantly greater than those of Treatments 2, 3, and 4 (46.66 ± 2.88, 37.86 ± 1.71, and 31.84 ± 5.40 N, respectively). A similar trend was observed for the melon flesh. Treatment 1 had the highest flesh hardness (8.06 ± 1.00 N), followed by Treatments 2, 3, and 4, with corresponding values of 7.06 ± 0.74, 6.58 ± 0.98, and 6.17 ± 0.94 N. These results indicate that an increase in the fruit load was associated with a reduction in the penetration force required for both the peel and flesh. For stickiness, Treatment 1 had the highest value for both the peel (0.915 N) and flesh (0.507 N). In the peel, Treatment 1 was significantly higher than Treatments 2, 3, and 4 (0.543, 0.495, and 0.488 N, respectively). In the flesh, Treatment 1 was significantly higher than Treatments 3 and 4, whereas Treatment 2 (0.445 N) was not significantly different from either Treatment 1 or Treatments 3 and 4 (Fig. 4).
Based on the results of the color evaluation of melon flesh using the CIE Lab* color system, the treatments significantly affected all color parameters (Table 3). The L* value (lightness) was in the range of 71.91–75.14, with Treatment 1 having the highest L* value (75.14 ± 0.43), which was not significantly different from Treatment 2 (74.51 ± 0.77) but which was significantly higher than Treatments 3 and 4. These results indicated that the melon flesh from Treatments 1 and 2 was lighter in appearance, whereas Treatments 3 and 4 resulted in comparatively darker flesh. Based on the a* values, where positive values indicate greater redness, Treatments 3 (18.28 ± 0.08) and 4 (17.91 ± 0.12) had significantly higher values than Treatment 2 (13.65 ± 0.45), indicating greater red pigmentation in the melon flesh. The b* values, indicating yellowness, ranged from 37.97 to 48.04, with Treatments 3 and 4 having significantly higher values than the other treatments, suggesting more intense yellow coloration in the melon flesh. Consistent with these findings, chroma values, indicating color saturation or vividness, were significantly higher in Treatments 3 (51.00 ± 0.13) and 4 (51.27 ± 0.19) than in Treatments 1 and 2 (Table 3). Overall, these findings demonstrated that Treatments 3 and 4 enhanced the red–yellow tonal intensity and overall color saturation of the melon flesh, resulting in a deeper and more vivid appearance, whereas Treatments 1 and 2 produced lighter and less intensely colored flesh.
Table 3.
Color characteristics of melon flesh as affected by the treatments (fruit load)
| Treatment | L* | a* | b* | Chroma |
| Treatment 1 | 75.14 ± 0.43 a | 15.02 ± 0.28 ab | 41.88 ± 0.39 b | 44.89 ± 0.46 b |
| Treatment 2 | 74.51 ± 0.77 ab | 13.65 ± 0.45 b | 37.97 ± 0.66 c | 40.35 ± 0.77 b |
| Treatment 3 | 72.05 ± 0.20 b | 18.28 ± 0.08 a | 47.62 ± 0.11 a | 51.00 ± 0.13 a |
| Treatment 4 | 71.91 ± 0.29 b | 17.91 ± 0.12 a | 48.04 ± 0.16 a | 51.27 ± 0.19 a |
| F-test | * | * | * | * |
| LSD0.05 | 2.63 | 3.48 | 2.55 | 5.34 |
| CV. | 5.23 | 8.18 | 7.45 | 7.75 |
Fruit number and marketability
The highest total number of fruits was in Treatment 4 (1,668 fruits·100 m-2), followed by Treatment 3 (1,251 fruits·100 m-2), Treatment 2 (834 fruits·100 m-2), and Treatment 1 (417 fruits·100 m-2). However, Treatments 1 and 2 achieved 100% marketable fruits (417 and 834 fruits·100 m-2, respectively). In contrast, Treatments 3 and 4 had high proportions of unmarketable fruits (845 and 1,282 fruits·100 m-2, respectively), resulting in only 406 and 386 marketable fruits, respectively. These findings indicated that although Treatments 3 and 4 increased total fruit production, the fruit quality was reduced substantially.
Marketable fruit weight
Significant differences among the treatments were observed for quality yield per fruit. Treatment 1 produced the greatest mean fruit weight (1,786.42 ± 154.12 g), followed by Treatment 2 (1,531.88 ± 143.25 g), though with no significant difference between them. Treatment 3 had a significantly lower fruit weight (1,047.33 ± 144.56 g), with Treatment 4 producing the lowest value (872.97 ± 124.46 g). This trend suggested that an increase in the fruit number was associated with a reduction in individual fruit weight.
Marketable yield per unit area
Treatment 2 produced the highest marketable yield (1,277.59 kg·100 m-2), followed by Treatment 1 (744.94 kg·100 m-2), Treatment 3 (425.22 kg·100 m-2), and Treatment 4 (336.97 kg·100 m-2). In contrast, Treatments 1 and 2 achieved 100% marketability and had significantly higher individual fruit weights than Treatments 3 and 4. Among the treatments, Treatment 2 provided the most favorable balance between marketable yield and fruit quality, as it produced the highest marketable yield while maintaining 100% marketability and an acceptable fruit size. Treatment 1 may be considered an alternative when a larger individual fruit size is prioritized (Table 4).
Table 4.
Fruit number, yield, and fruit quality of melon
| Treatment |
Number of fruits (fruits.100 m-2) (fruits) |
Number of marketable fruits (fruits 100 m-2) |
Number of unmarketable fruits (fruits.100 m-2) |
Marketable yield fruit-1 (g) |
Marketable yield 100 m-2 (kg) |
| Treatment 1 | 417 | 417.00 b | 0.00 c | 1,786.42 ± 154.12 a | 744.94 b |
| Treatment 2 | 834 | 834.00 a | 0.00 c | 1,531.88 ± 143.25 a | 1,277.59 a |
| Treatment 3 | 1,251 | 406.00 c | 845.00 b | 1,047.33 ± 144.56 b | 425.22 c |
| Treatment 4 | 1,668 | 386.00 d | 1,282.00 a | 872.97 ± 124.46 b | 336.97 c |
| F-test | - | * | * | * | * |
| LSD0.05 | - | 10.53 | 345.63 | 264.87 | 115.32 |
| CV. | - | 10.78 | 12.48 | 7.98 | 10.89 |
Correlation among fruit traits, firmness characteristics, and yields
The analysis based on Pearson’s correlation coefficient (r) further supported the fruit load responses observed in the present study. Plants maintained with lower fruit loads, particularly one and two fruits per plant, produced larger fruits with greater peel and flesh firmness. Fruit width showed a very strong positive correlation with fruit yield (r = 0.9444), as well as with peel hardness (r = 0.8644) and flesh hardness (r = 0.8144). Likewise, fruit length was positively associated with peel hardness (r = 0.73*), flesh hardness (r = 0.8244), and fruit yield (r = 0.8044). In addition, peel hardness was strongly correlated with flesh hardness (r = 0.8444) and fruit yield (r = 0.9144), as shown in Table 5 indicating that firmer fruits were associated with a greater fruit size and a higher total fruit yield per plant. Although increasing the fruit load enhanced the total yield per plant, the reduction in the fruit size and firmness observed in the three- and four-fruit treatments may have contributed to the greater proportion of unmarketable fruits. The strong positive relationships among fruit width, peel hardness, and total fruit yield per plant indicated that these traits were closely associated under the conditions of the present study. Therefore, the correlation analysis provided complementary evidence of the relationships among the fruit size, firmness, and total fruit yield per plant, but it did not independently establish an optimal fruit-load level. This finding was consistent with the yield and quality data, where the two-fruit treatment achieved the highest marketable yield (1,277.59 kg·100 m-2) while maintaining acceptable fruit size and firmness values, whereas higher fruit loads resulted in diminished fruit quality despite the greater total yield per plant.
Table 5.
Relationships among fruit size, firmness attributes, and fruit yield in melon
| Variable | Fruit width | Fruit length |
Hardness of peel |
Hardness of flesh |
Total fruit yield per plant |
| Fruit width | 1.00 | 0.61 | 0.86** | 0.81** | 0.94** |
| Fruit length | 1.00 | 0.73* | 0.82** | 0.80** | |
| Hardness of peel | 1.00 | 0.84** | 0.91** | ||
| Hardness of flesh | 1.00 | 0.83** | |||
| Total fruit yield per plant | 1.00 |
Principal component analysis (PCA)
PCA was conducted to investigate the relationships among the fruit quality attributes, texture characteristics, yield components, and marketable productivity under the different fruit-load treatments. The first two principal components accounted for 90.6% of the total variation (PC1 and PC2 explaining 68.5% and 22.1%, respectively), as shown in Fig. 5. The PCA biplot clearly discriminated among the fruit-load treatments according to their effects on fruit quality and productivity. One fruit per plant was positively associated with fruit width, fruit length, hardness of the peel, hardness of the flesh, and fruit yield, indicating superior fruit size and texture quality. In contrast, Treatment 2 (two fruits per plant) was closely associated with marketable fruits and a marketable yield, indicating a favorable association with marketable productivity. Treatments 3 and 4 were separated based on both quality- and productivity-related traits, reflecting the negative effects of an excessive fruit load on fruit development and commercial performance. Furthermore, the close clustering of Treatments 3 and 4 suggested that increasing the fruit load beyond two fruits per plant provided limited yield benefits while substantially reducing the fruit quality and marketable yield.
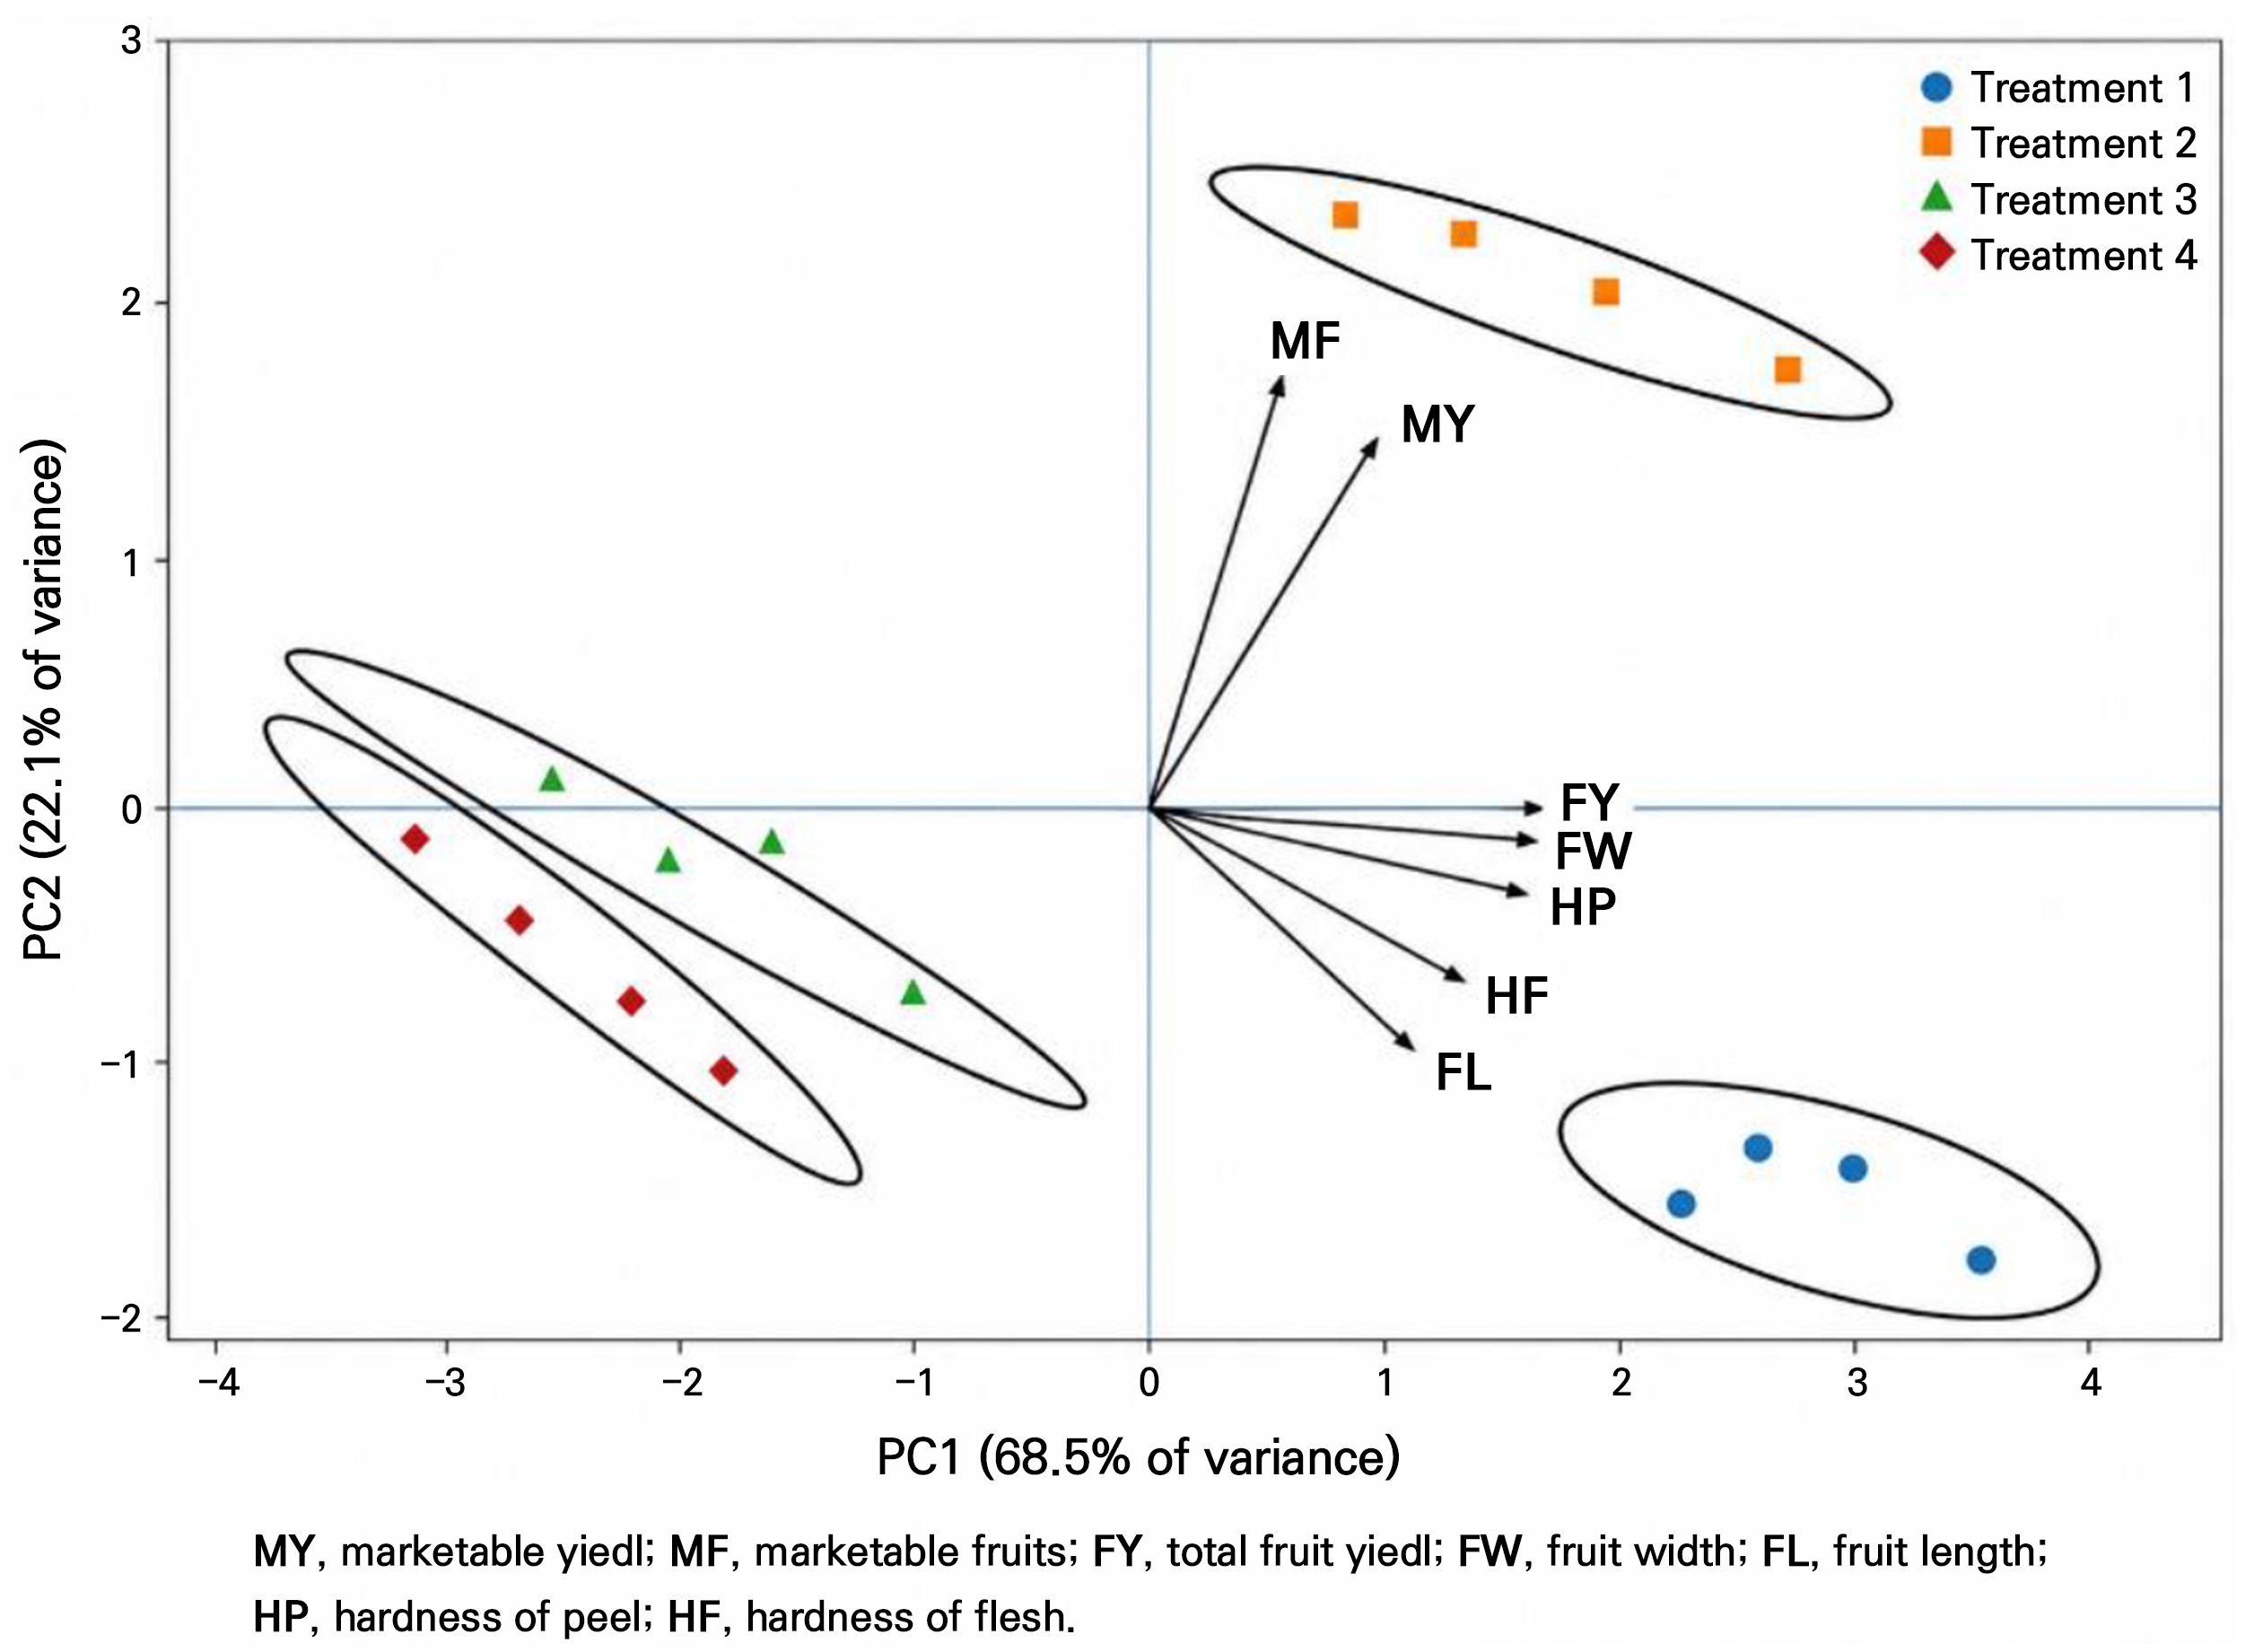
Fig. 5.
Principal component analysis (PCA) biplot illustrating relationships among the fruit quality traits and yield components of hydroponic melon grown under different fruit-load treatments: (FW = fruit width, FL = fruit length, HP = hardness of peel, HF = hardness of flesh, FY = total fruit yield per plant, MF = marketable fruits per 100 m2, and MY = marketable yield per 100 m2).
Discussion
Based on the results of the present study, fruit load significantly influenced both yield components and the fruit quality of melon grown using a hydroponic FRT system. Increasing the number of fruits per plant resulted in a trade-off between fruit size and total yield, which is a common response in fruit crops associated with source–sink relationships. In terms of fruit growth, fruit width and length increased progressively with fruit age across all treatments. However, Treatment 1 generally produced larger fruits than the higher fruit-load treatments, although some fruit-size traits were not significantly different from those of Treatment 2. This response may be associated with differences in assimilate allocation among developing fruits and is consistent with source–sink relationships reported in previous studies. Under such conditions, a lower fruit load may allow greater assimilate availability per developing fruit; however, this interpretation should be considered cautiously because photosynthetic activity and assimilate partitioning were not directly measured in the present study. Similar findings have been reported in melon and other cucurbit crops, where fruit load influenced fruit size and uniformity (Marcelis 1996; Atherton and Li 2023).
Furthermore, this relationship was supported by the yield component analysis. Although Treatment 1 produced the greatest individual fruit weight, it resulted in the lowest total fruit yield per plant because only one fruit was retained per plant. In contrast, increasing the fruit load (Treatments 3 and 4) significantly increased the total fruit number per 100 m2 but reduced individual fruit weights and resulted in lower marketable fruit numbers and marketable yields per 100 m2. This pattern indicated that an excessive fruit load could lead to an insufficient assimilate supply per fruit, thereby limiting fruit development. These findings were consistent with those in other studies, which reported that an excessive fruit number reduced fruit size, sugar accumulation, and overall fruit quality due to increased sink competition (Bertin 2005; Ferreira et al. 2016). Notably, Treatment 2 (two fruits per plant) provided the optimal balance between fruit size and total yield, resulting in the highest marketable yield per unit area, suggesting that a moderate fruit load allows efficient assimilate partitioning without excessively increasing competition among developing fruits. Similar conclusions were reported by Rodriguez et al. (2007), who found that maintaining an optimal fruit number was essential for maximizing both yield and fruit quality in greenhouse-grown melon. The superior performance of the two-fruit treatment in the present study may reflect a favorable balance between fruit number and individual fruit development, which is consistent with source–sink relationships reported in previous studies. Under the hydroponic FRT conditions, water and nutrient availability were maintained continuously at adequate levels; therefore, fruit growth was likely governed primarily by source-sink relationships rather than by resource limitations. Retaining two fruits per plant resulted in relatively large and heavy fruits while maintaining a high marketable yield. This response is also consistent with source–sink relationships reported in previous studies; however, the underlying changes in photoassimilate production and partitioning were not directly measured in the present study. Consequently, the fruit size remained within commercially acceptable standards, whereas the total marketable yield increased substantially compared with the single-fruit treatment. In contrast, plants loading three or four fruits experienced greater competition among sinks, leading to reduced assimilate allocation per fruit and consequently lower fruit size, firmness, and marketability outcomes. These findings support the concept that fruit-load regulation is a critical strategy for optimizing the source-sink balance and improving production efficiency during hydroponic melon cultivation. Similar observations were reported by Valantin-Morison et al. (2006), who demonstrated that the source-sink balance had a direct effect on fruit development and quality in cantaloupe melon. More recently, Lim et al. (2026) reported that optimizing sink demand was essential for simultaneously improving fruit quality, marketable yield, and resource-use efficiency in hydroponic melon production systems.
Regarding fruit quality attributes, the present analysis indicated that chemical properties such as the pH, total soluble solids (TSS) content, titratable acidity (TA), and ascorbic acid content were not significantly affected by the fruit load. This suggests that under the controlled nutrient and environmental conditions of the FRT system, the internal biochemical composition of melon fruits remained relatively stable. However, notably, although the TSS values were not significantly different, slight variations in sweetness may still be perceived by consumers, as other studies have reported that sugar accumulation in melon is influenced not only by the fruit load but also by environmental factors such as light intensity and nutrient availability (Phankaen and Kumpanuch 2025; Guan et al. 2026). In contrast, in the present study, physical properties such as fruit size, hardness, and peel strength were significantly affected by the fruit load. Fruits from Treatment 1 had the highest firmness and peel strength, possibly attributable to better cell wall development due to a sufficient assimilate supply. As the fruit load increased, both the peel and flesh firmness decreased, likely due to reduced carbohydrate availability for structural development. This observation aligns with the findings of Toivonen and Brummell (2008), who reported that fruit firmness was closely related to carbohydrate allocation and cell wall metabolism.
The color parameters of the melon flesh were also influenced by the fruit load. Treatments with higher fruit loads (Treatments 3 and 4) showed higher a and b values, indicating greater redness and yellowness, respectively. However, although changes in flesh color may be associated with differences in pigment compositions, pigment and carotenoid concentrations were not directly measured in the present study. Therefore, the observed differences should be interpreted based on the measured color parameters rather than as evidence of increased pigment levels or greater carotenoid accumulation. Despite these differences in color parameters, these treatments were less marketable due to their smaller fruit size and higher proportions of unmarketable fruits. Therefore, differences in color parameters alone do not necessarily translate into improved commercial value (Lester and Eischen 1996; Marcelis 1996).
Based on the fruit number and marketability results, there were clear limitations from excessive fruit loading. Although Treatments 3 and 4 produced the highest number of fruits, a large proportion of these were classified as unmarketable. This may have been due to the inadequate fruit size, poor shape, or uneven development caused by the limited assimilate supply. In contrast, Treatments 1 and 2 achieved 100% marketability, emphasizing the importance of proper fruit load management in commercial production systems. From a practical perspective, the findings of the present study suggest that maintaining two fruits per plant can provide a favorable balance between marketable yield and fruit quality under FRT hydroponic conditions. This treatment produced the highest marketable yield per unit area while maintaining acceptable fruit sizes and quality levels. Although plants loading a single fruit produced larger and firmer fruits, the resulting marketable yield per unit area was lower than that of plants carrying two fruits. Conversely, increasing the fruit load to three or four fruits per plant intensified sink competition, leading to reductions in the fruit size, firmness, marketability, and quality yield. These findings indicate that maintaining two fruits per plant provides a favorable balance between fruit quality and marketable productivity under the FRT conditions evaluated in this study. The present study also highlights the importance of optimizing the fruit load as a key management practice during hydroponic melon production. The balance between the source (photosynthetic capacity) and sink (fruit demand) plays a crucial role in determining yield and fruit quality. Future research could investigate the interaction between fruit load and other factors, such as nutrient concentrations, light intensity levels, and cultivar differences, to develop more precise production guidelines (Castellanos et al. 2011; Yoon et al. 2024; Li et al. 2026).
The correlation analysis revealed that fruit size and firmness were closely associated with fruit yield and marketability in hydroponic melon production systems. Fruit width had the strongest positive correlation with the total fruit yield per plant (r = 0.94), while peel hardness was also highly correlated with yield (r = 0.91). In addition, fruit width was positively correlated with peel hardness (r = 0.86) and flesh hardness (r = 0.81), indicating that larger fruits tended to be associated with higher textural quality. Based on these results, fruit growth and firmness were strongly associated with marketable yield when using a hydroponic production system. The observed relationships may be explained by assimilate partitioning among developing fruits. Under lower fruit loads, individual fruits receive a greater proportion of photo-assimilates, promoting fruit enlargement and tissue development. Conversely, increasing the fruit load intensifies competition among the fruits, reducing assimilate availability and consequently limiting fruit growth and quality. Similar findings were reported by Lima et al. (2020), who demonstrated that assimilate translocation plays a critical role in determining melon fruit growth and yield outcomes. Furthermore, fruit firmness is an important quality attribute influencing consumer acceptance and market value. Other studies have shown that improvements in fruit development are often accompanied by enhanced fruit quality characteristics, including texture, firmness, and yield performance, in hydroponic melon production systems (Khomphet et al. 2023; Shin et al. 2023). Therefore, the strong positive associations among fruit width, firmness characteristics, and yield provided complementary evidence of the relationships among these traits. However, these correlations indicate associations rather than causal relationships and should not be interpreted as independent evidence that maintaining two fruits per plant is optimal under FRT cultivation.
The PCA revealed a clear separation among the fruit-load treatments, with the first two principal components explaining 90.6% of the total variation. Treatment 1 was positively associated with fruit width, fruit length, hardness of the peel, hardness of the flesh, and the fruit yield, indicating that reduced sink competition enhanced assimilate allocation to individual fruits, resulting in improved fruit size and texture quality outcomes. Conversely, Treatment 2 was closely associated with marketable fruits and marketable yield, suggesting a more favorable balance between source capacity and sink demand. Similar findings have been reported in melon and other fruit crops, where a moderate fruit load improved the marketable yield while maintaining acceptable fruit quality (Valantin-Morison et al. 2006; Yam et al. 2020). In contrast, Treatments 3 and 4 were separated from both quality- and productivity-related traits, indicating that an excessive fruit load increased competition for assimilates and reduced fruit development. Furthermore, the close clustering of these treatments suggested diminishing returns from retaining more than two fruits per plant. Overall, the PCA confirmed a trade-off between fruit quality and productivity and supported the retention of two fruits per plant as the optimal fruit-load strategy for hydroponic melon production under FRT conditions, consistent with other studies on source-sink regulation and yield optimization in protected cultivation systems (Phankaen and Kumpanuch 2025; Lim et al. 2026). However, this study has several limitations that should be considered when interpreting the results. The experiment was conducted using only one melon cultivar, Baramee, during a single growing season and at one experimental location under a floating-root technique hydroponic system. Therefore, the observed responses to fruit load may not be directly applicable to other melon cultivars, growing seasons, locations, or production systems. Further studies involving multiple cultivars, growing seasons, locations, and hydroponic production systems are needed to validate the present findings and determine the consistency of the observed responses under different production conditions.
Conclusion
Fruit load significantly influenced the yield distribution and fruit quality of melons grown using a FRT hydroponic system. Increasing the number of fruits per plant resulted in a trade-off between individual fruit size and the total fruit yield per plant. Plants with a single fruit produced the largest and firmest fruits but had the lowest total fruit number and total fruit yield per unit area. In contrast, higher fruit loads (three or four fruits per plant) increased the total fruit number but reduced individual fruit size, firmness, and marketability. Among the treatments evaluated, maintaining two fruits per plant provided a favorable balance between the marketable yield per unit area and fruit quality, with 100% marketability. Internal quality attributes, in this case the total soluble solids content, pH, titratable acidity, and ascorbic acid content, were not significantly affected by the fruit load, indicating relatively stable biochemical characteristics under the controlled hydroponic conditions studied here. These findings highlight the importance of appropriate fruit-load management for balancing productivity and fruit quality during hydroponic melon cultivation. Under the greenhouse and FRT hydroponic conditions evaluated in the present study, maintaining two fruits per plant provided a favorable balance between the marketable yield and fruit quality. Further studies involving different cultivars, growing seasons, locations, and production systems, together with economic analyses, are needed to determine the broader applicability and economic benefits of this fruit-load strategy.
