

Introduction
Materials and Methods
Experimental Conditions
Plant Material
Conditions in the Closed-type Plant Factory System
Plant Measurements
Statistical Analysis
Results and Discussion
Introduction
A closed-type plant factory system is a controlled environmental facility for plant production. In these highly productive systems, uniform plants can be grown year-round using less water, nutrition, pesticides, and labor than field cultivation. Plant factories are therefore a sustainable means of producing quality vegetables with high yields once the optimal conditions for aerial and root environments are identified (Morimoto et al., 1995).
Quinoa (Chenopodium quinoa Willd.) is a food plant native to the Andean region, where its seed is used as a raw material for oil extraction. The most prevalent fatty acid present in the oil is omega 6 (linoleic acid), accounting for approximately 50% of the total. The seeds also contain high levels of dietary fiber, imparting quinoa with many positive health effects. Quinoa seeds have been considered the edible portion of the plant while the leaves have generally been overlooked. In fact, the leaves and sprouts can be consumed, either raw or cooked, and provide substantial nutritive values coupled with high antioxidant and anticancer properties (Paśko et al., 2009; Gawlik-Dzik et al., 2013). The allocation of these nutrients and the biomass production of quinoa are affected by the photoperiod (12 and 16 h) and irradiance (1,800 μmol·m-2·s-1) (Schlick, 2000).
Hydroponic systems that produce leafy vegetables generally use nutrient solutions with an EC ranging from 1.5 to 2.5 dS·m-1. High salinity, as measured by EC levels, can inhibit nutrient uptake by lowering the osmotic potential, whereas low EC may adversely affect plant growth and yield. Proper management of the EC in a nutrient solution can be an effective tool to promote growth and improve crop quality. The EC level can also have an effect on crop taste and quality. Outer quality (yield and firmness), inner quality (total soluble solids and acids, which characterize taste), nutritional value, antioxidative capacity, and aroma volatiles are all influenced by EC (Sarooshi and Cresswell, 1994; Carrasco et al., 2007; Wu and Kubota, 2008).
Most research on quinoa has focused on the seed. Information on the conditions necessary to grow quinoa as a leafy vegetable, especially in a closed-type plant factory system, is minimal. Therefore, this study aimed to elucidate the optimal photoperiod, light intensity and nutrient EC concentration for producing quinoa as a leafy vegetable in a closed-type plant factory system.
Materials and Methods
Experimental Conditions
The experiments were conducted between March and August, 2014 at Jeju National University. The first experiment was conducted in a growth chamber (Multi-room chamber HB-302 S-4H, HANBAEK Co. Ltd., Korea) to investigate the effect of 8/16 h, 14/10 h and 16/8 h (day/night) photoperiods on quinoa. A closed-type plant factory (700 x 500 x 300 cm, L x W x H) trial was conducted from March 7 to April 8, 2014 using three EC levels (1.0, 2.0 and 3.0 dS·m-1) under a 12/12 h (day/night) photoperiod. The second closed-type factory trial was performed from July 14 to August 26, 2014 using the same three EC levels (1.0, 2.0 and 3.0 dS·m-1) under a 14/10 h (day/night) photoperiod with two light intensities (120 and 143 μmol·m-2·s-1).
Plant Material
Quinoa seeds of home seed production were used. Quinoa seeds were singly sown into the 288 cells of a polyurethane sponge (2.5 × 2.5 × 2.5 cm) in a plastic tray filled with distilled water. The plants were transplanted into troughs (each trough 250 × 5 × 4 cm, L × W × H) in the closed-type plant factory at the fourth true leaf stage. Ten plants were spaced 10 cm apart within each trough, and each trough was spaced 10 cm apart (100 plants/m2). The nutrient film technique (NFT) system, consisting of two layers, each layer with six troughs, was used for the plant growth system.
Conditions in the Closed-type Plant Factory System
The temperature in the plant factory system was maintained at 23-25°C. Relative humidity was not controlled in the system, but averaged 60%. CO2 concentration was also not controlled by the system, and was not measured. Three-band radiation type fluorescent lamps (55 W, Philips Co. Ltd., Amsterdam, the Netherlands) were used for lighting. The light intensity (photosynthetic photon flux density, PPFD) was measured using a quantum sensor (LI-190, Li-cor Inc., Lincoln, NE, USA). The nutrient solution was composed of 15 mM NO3-N, 1 mM NH4-N, 1 mM P, 7 mM K, 4 mM Ca, 2 mM Mg, and 2 mM SO4-S. The pH and EC of the nutrient solutions were measured daily for each treatment in the 90-L nutrient solution tanks. The measurements were taken with a pH meter (HI 98106, Hanna Instruments Ltd., Bedfordshire, Leighton Buzzard, UK) and a portable conductivity meter (COM-100, HM Digital Inc., Culver City, CA, USA). The pH was adjusted to 5.5-6.5 with either potassium hydroxide (KOH) or phosphoric acid (H3PO4), and the EC was adjusted by a nutrient solution or tap water when required. The volume of the nutrient solution in each tank was consistently monitored and nutrient solutions were circulated by a pump-on and pump-off cycle every 10 minutes from transplantation to harvest. The nutrient solutions were not renewed or refreshed during the experimental period.
Plant Measurements
Plant growth was measured every five days after transplanting. At each sampling, four plants from each treatment were destructively assayed for plant height, shoot fresh weight, shoot dry weight, number of leaves, and total leaf area. The shoot dry weight was measured after drying for 72 hours at 70°C in a hot air oven (VS-1202D2N, Alphatech KOREA, Seoul, Korea). The leaf area was measured using an area meter (Li-3100, Li-cor Inc., Lincoln, NE, USA). The light use efficiency (LUE, g·mole- 1) was calculated by dividing the shoot dry weight by the integral radiation.
Statistical Analysis
The experiment was arranged in a randomized complete design with 3 replications. Statistical analyses were carried out using the SAS system (Release 9.01, SAS institute Inc., Cary, NC, USA) and Sigmaplot (Version 9.01, Sistat Software Inc., San Jose, CA, USA). The experimental results were subjected to an analysis of the variance (ANOVA). When significant differences occurred, the means were separated by a Duncan’s multiple range test (DMRT) at the 5% level.
Results and Discussion
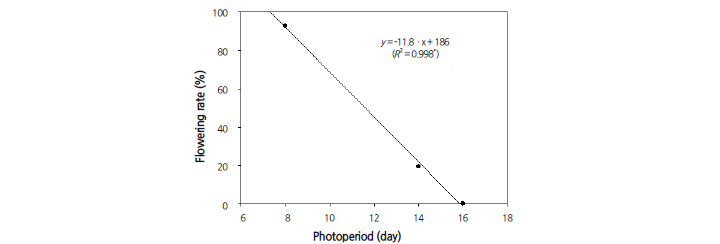
Photoperiod is highly influential in plant growth due to its effect on flowering time in many plants. We observed a dramatic photoperiod effect on quinoa flowering in the growth chamber; flowering decreased as photoperiod increased (Fig. 1). Quinoa plants grown under a 16/8 h photoperiod failed to flower, whereas 19.3 and 92.8% flowered under a 14/10 h and 8/16 h photoperiod, respectively. The long day length effectively delayed flowering, demonstrating that quinoa is a short-day plant, which is desirable for leafy vegetable production. A linear relationship was assumed between the flowering rates and different photoperiods. The estimated slope was negative, and the flowering rate was 11.8% (R2 = 0.998*); flowering rate was altered by approximately 12% per photoperiod hour.
Quinoa cultivars have been reported to differ markedly in their photoperiod response under different conditions (Bertero et al., 1999a, 1999b; Bertero, 2001; Gesinski, 2008; Ruiz and Bertero, 2008). This prior work showed that photoperiod had strong effects on all stages of quinoa plant reproduction and often acted indirectly, such as rate of leaf appearance, or delayed responses in the later phases of development (Bertero et al., 1999b). These experiments support our results and suggest that a 16/8 h photoperiod be used to prevent flowering. Alternatively, a 7/17 h photoperiod can be used to induce 100% flowering of quinoa in a closed-type plant factory system.
| |
Fig. 1. Flowering response of quinoa under different photoperiods. Flowering rate decreases as day length increases. Significant at p = 0.05. | |
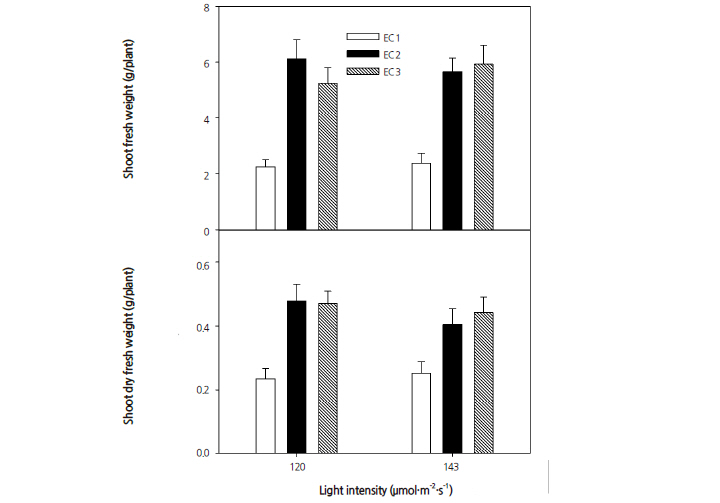
The highest shoot weights (fresh and dry) were obtained from plants grown in nutrient solution with an EC at 2.0 dS·m-1 and a PPFD of 120 μmol·m-2·s-1 (Fig. 2). The shoot weights significantly decreased as EC increased from 2.0 to 3.0 dS·m-1 and PPFD rose from 120 to 143 μmol·m-2·s-1.
Plant tolerance to salinity can vary greatly and can have an influence on plant development. Both yield components and growth parameters show altered responses when exposed to salinity stress. Salinity response showed considerable diversity among the quinoa varieties evaluated by Shabala et al. (2013). In another study on salad rocket (Eruca sativa L.), nutrient solutions with ECs of 2.8 and 3.8 dS·m-1 did not have an effect on plant height but did slightly affect yield (D'Anna et al., 2003), while an EC of 8 dS·m-1 did not decrease the fresh matter in a study on endive (Cichorium endivia L.) (Kowalczyk et al., 2012). Cho (2004) reported that the optimal EC can vary based on the growing season, growth stage, cultivar, and crop. The optimal EC in basil (Ocimum basilicum L.) (Carrasco et al., 2007) and chicory (Cichorium intybus L.) (Park et al., 1995), was found to be 1.5 dS·m-1 , while dill (Anethum graveolens L.) and thyme (Thymus vulgaris L.) (Udagawa, 1995) performed best with an EC of 2.4 dS·m-1 . The optimal EC ranged from 1.0 to 2.5 dS·m-1 , dependent on the environmental conditions for lettuce (Lactuca sativa L.) (Costa et al., 2001; Carlo et al., 2009), from 1.5 to 2.0 dS·m-1 for pak-choi (Brassica rapa subsp. chinensis) (Cho, 2004), and from 1.5 to 2.0 dS·m-1 for sow thistle (Sonchus oleraceus) (Cho et al., 2012). Our results indicate that the optimal EC for productive growth of quinoa as a leafy vegetable in a closed-type plant factory system, is 2.0 dS·m-1.
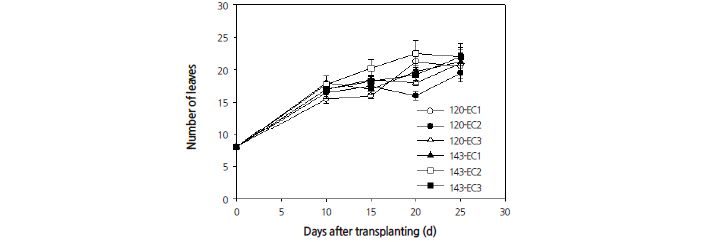
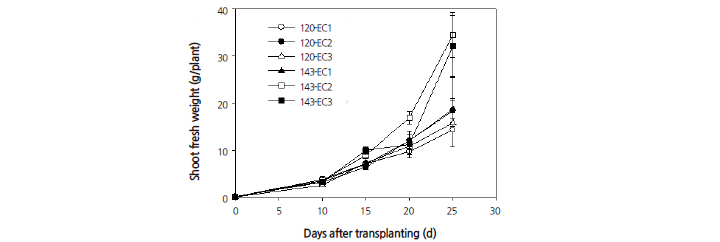
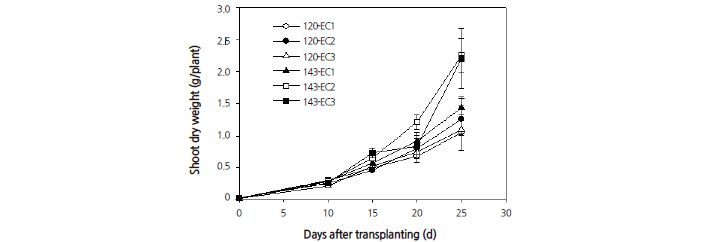
other treatments (Fig. 3). This leaf number was highest at 20 days after transplanting. When grown under an EC of 2.0 dS·m-1, leaf number increased as the PPFD increased. The shoot fresh weight per plant (Fig. 4) and the shoot dry weight per plant (Fig. 5) increased linearly and were found to show significant differences as the EC and PPFD treatment levels increased. Shoot growth was most pronounced under EC rates of 2.0 and 3.0 dS·m-1 at 20 days after transplanting and beyond. The conditions and timing for highest levels shoot fresh and dry weights were observed under an EC of 2.0 dS·m-1 with a PPFD of 143 μmol·m-2·s-1 at 25 days after transplanting. These results (Figs. 2, 4, and 5), show that growing plants under a 14/10 h photoperiod provides more rapid growth rate than under a 12/12 h photoperiod when both are grown under the same EC. This suggests that the integral radiation provided by a 16/8 h photoperiod is good for growth of quinoa.
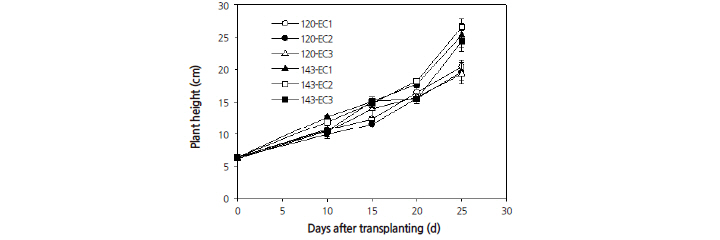
The plant heights also significantly differed between both EC and PPFD treatments (Fig. 6). Under each EC treatment, plant height increased linearly as PPFD increased from 120 to 143 μmol·m-2·s-1. Total leaf area was also found to differ significantly between the EC and PPFD treatments (Fig. 7). As the PPFD rose from 120 to 143 μmol·m-2·s-1 leaf area increased linearly. Total leaf area, from all EC treatments with a PPFD of 143 μmol·m-2·s-1, was greater than from EC treatments with a PPFD of 120 μmol·m-2·s-1. Both plant height and leaf area were highest with an EC at 2.0 dS·m-1 and a PPFD of 143 μmol·m-2·s-1 at 25 days after transplanting.

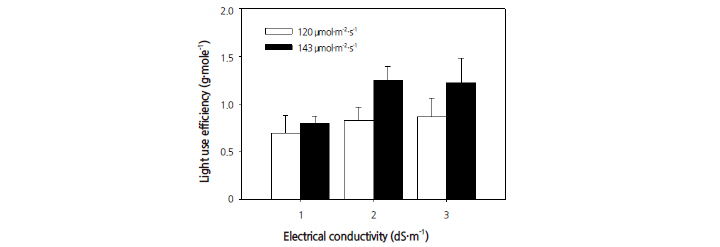
Significant differences in light use efficiency (LUE) were also observed between the EC and PPFD treatments (Fig. 8). All EC treatments with a PPFD of 143 μmol·m-2·s-1 showed better light use efficiency than those with a PPFD of 120 μmol·m-2·s-1. Each EC treatment showed a linear increases in LUE. Better LUE was observed, however, with a PPFD of 120 μmol·m-2·s-1 at an EC of 2.0 dS·m-1 than with a PPFD of 143 umol·m-2·s-1 at an EC of 3.0 dS·m-1. Consistent with the best results for plant height and leaf area, light use efficiency was also highest with an EC of 2.0 dS·m-1 and a PPFD of 143 μmol·m-2·s-1.
We observed optimal growth of quinoa with an EC at 2.0 dS·m-1, under a 12/12 h photoperiod with a PPFD of 120 μmol·m-2·s-1, or under a 14/10 h photoperiod with a PPFD of 143 μmol·m-2·s-1. These results are similar to those obtained by Seo et al. (2009), who reported that the leaf area index, number of leaves, plant height, fresh weight per plant, and chlorophyll content of lettuce (Lactuca sativa L.) were highest when grown with an EC at 2.0 dS·m-1. Cho (2004) similarly reported that the optimal EC for pak-choi was 1.5 to 2.0 dS·m-1 during growth stage 1 (from seedling emergence to transplanting with 3-4 leaves) and 2.0 dS·m-1 during growth stage 2 (from transplanting to harvest with 14-15 leaves, or fresh weight ≥ 60 g).
Light intensity is a key environmental factor affecting transplant growth and quality. Increasing the intensity of an artificial lighting source often increases plant growth rate. The dry mass, dry mass percentage, and leaf number increased linearly with the daily light integral (DLI, the product of PPFD and photoperiod) in lettuce (Lactuca sativa L. cv. Summergreen) (Kitaya et al., 1998). According to Cho et al. (2012), the growth characteristics of sow thistle in a plant factory, i.e., the number of leaves, fresh weight and dry weight, were highest in an EC of 2.0 dS·m-1 with a PPFD of 200 μmol·m-2·s-1. Increasing the PPFD from 100 to 200 μmol·m-2·s-1 increased the chlorophyll content (SPAD) and leaf photosynthetic rate. Qin et al. (2008) reported that elevating PPFD from 100 to 700 μmol·m-2·s-1 increased the rate of photosynthesis for sow thistle and lettuce.
Light use efficiency (LUE) is one of the most useful parameters for estimating crop productivity. LUE relates dry matter productivity to solar radiation received on the canopy (Akmal and Janssens, 2004), and fosters the relationship between intercepted radiation and biomass production (Lee and Heuvelink, 2003). The ratio of net primary production to the absorbed photosynthetically active radiation (PAR) is the PPFD utilization efficiency, or LUE, which is used to determine the consequent crop productivity. The measurements of the shoot dry weights in this study showed that these weights could be increased by 2.0 g/plant under an EC at 2.0 dS·m-1 with a PPFD of 143 μmol·m-2·s-1. The biomass production of quinoa could be improved if radiation use efficiency was improved by reducing the periods of interception below 50% of the incoming PAR (Ruiz and Bertero, 2008).
Based on our results, the optimal EC, PPFD, and photoperiod for the highest growth productivity of quinoa as a leafy vegetable in a closed-type plant factory system are 2.0 dS·m-1 and 143 μmol·m-2·s-1, EC and PPFD respectively, under a 16/8 h photoperiod.
