

Introduction
Materials and Methods
System design and treatments
Plant and fish materials
Measurement of water quality parameter
Plant growth measurements
Experimental design and data analysis
Results and Discussion
Ion concentration in water
EC and pH in water
Growth performance of geranium
Correlation
Conclusion
Introduction
Aquaponics integrates recirculating hydroponics and aquaculture into one production system. This system’s advantage is the potential profit from simultaneously producing two cash crops (plants and fish). In an aquaponic system that primarily focuses on reusing the nutrients for plant growth that are released from the fish section, maintaining the balance is crucial for a recirculating aquaponic system (Kiraly et al. 2013). This also helps reduce water usage and waste discharge into the environment. Nowadays, small-scale or mini versions of the aquaponic system have also been introduced for interior design, which creates a refreshing and stress-free environment with an aesthetic view in indoor spaces. Many types of aquaponic systems exist; however, a properly designed and well-managed system is required depending on plants and fish for interior purposes.
In the aquaponic system, water quality is an important factor because it provides nutrition for both plants and fish (Yildiz et al. 2017). This quality greatly depends on the dissolved ions, EC, and pH of water. Usually, dissolved ions come from fish feed and fish excreta, and plants utilize them by taking them up as a nutrient source, making a balanced environment for both (Yang and Kim 2019). In this process, different microorganisms, including bacteria, are involved. They extract various macro- and micronutrients from the leftover fish feed and solid feces, and make them available for plant uptake in the ionic form. Furthermore, the presence of various ions and their concentration play a key role in regulating EC and pH in aquaponic water. Therefore, the adjustment of EC and pH in aquaponic water is necessary to promote microbial activities and ensure fish health and plant growth (Schmautz et al. 2021).
The use of filter media in an aquaponic system is important to maintain water quality. Volcanic stone is an inorganic substance and is commonly used as a filter material (Wu et al. 2022). Usually, inorganic filter material supports nitrifying bacteria, which helps to reduce ammonia in water through the nitrification process and adds nitrate. Although volcanic stone is expensive, it offers several advantages, such as structural integrity for extended periods, prevention of anaerobic conditions by ample oxygen supply, and moisture retention.
Furthermore, when aquaponic systems are designed for interior purposes, fish and plant selection is very crucial, and their growth habits need to be considered while maintaining water quality for both. Many plant species are used in interior design. Geranium (Pelargonium zonale L.) is an herbaceous plant that belongs to the Geraniaceae family, and is considered a decorative plant, due to its attractive flower (Sánchez-Blanco et al. 2009). Its flowers are typically five-petaled and have various colors, such as pink, red, and white. The geranium plant is also used in herbal and modern medicine (Graça et al. 2016). Its morphological features are suited to an aquaponic system. In our present study, we grew geranium and goldfish together. Goldfish are a common aquarium fish worldwide. However, their use for interior purposes in this type of aquaponic system is still limited. Our previous research also focused on them (Kim et al. 2023).
Moreover, sustainable management of aquaponic water is necessary to achieve crop yield with quality and ensure optimal conditions for fish growth. The types of aquaponic systems and use of filtering materials greatly influence water quality, which in turn affects plant and fish growth. Therefore, this study aimed to investigate the effects of different aquaponic systems with the presence or absence of volcanic stones on water quality and the growth performance of geranium plants.
Materials and Methods
System design and treatments
The experiment room was facilitated by controlled environmental conditions (temperature 25°C, humidity 60%, light intensity 100 µmol·m-2s-1, 8 h light period per day). The purpose of this study was to develop an interior design or a small-scale aquaponic system. For this reason, a small tank of L 46 cm × W 32 cm × H 24 cm filled with 15 L of water was used for each treatment. Three different types of aquaponic systems were used (Fig. 1): 1) deep water system (D), 2) modified deep water system (M), and 3) nutrient film technique (N). In the deep water system, the tank had only one chamber. In the modified deep water system, the tank had two chambers, the upper chamber being smaller than the lower, and water circulates by a motor in the lower portion and a hole in the upper portion. On the other hand, in the nutrient film technique system, plants were grown separately in a tray, and the aquaponic water was circulated by a water pump between the tank and tray. Volcanic stones (V) (1.5 cm; Safflower rock, Bandosangsa, Korea) were used as a filtration material in all types of systems as a separate treatment to understand their effect on these systems. In the D and N systems, the volcanic stones were located at the bottom of the tank, while in the M system, they were located at the bottom of the upper chamber of the tank. A bubble generator was used in all treatments.
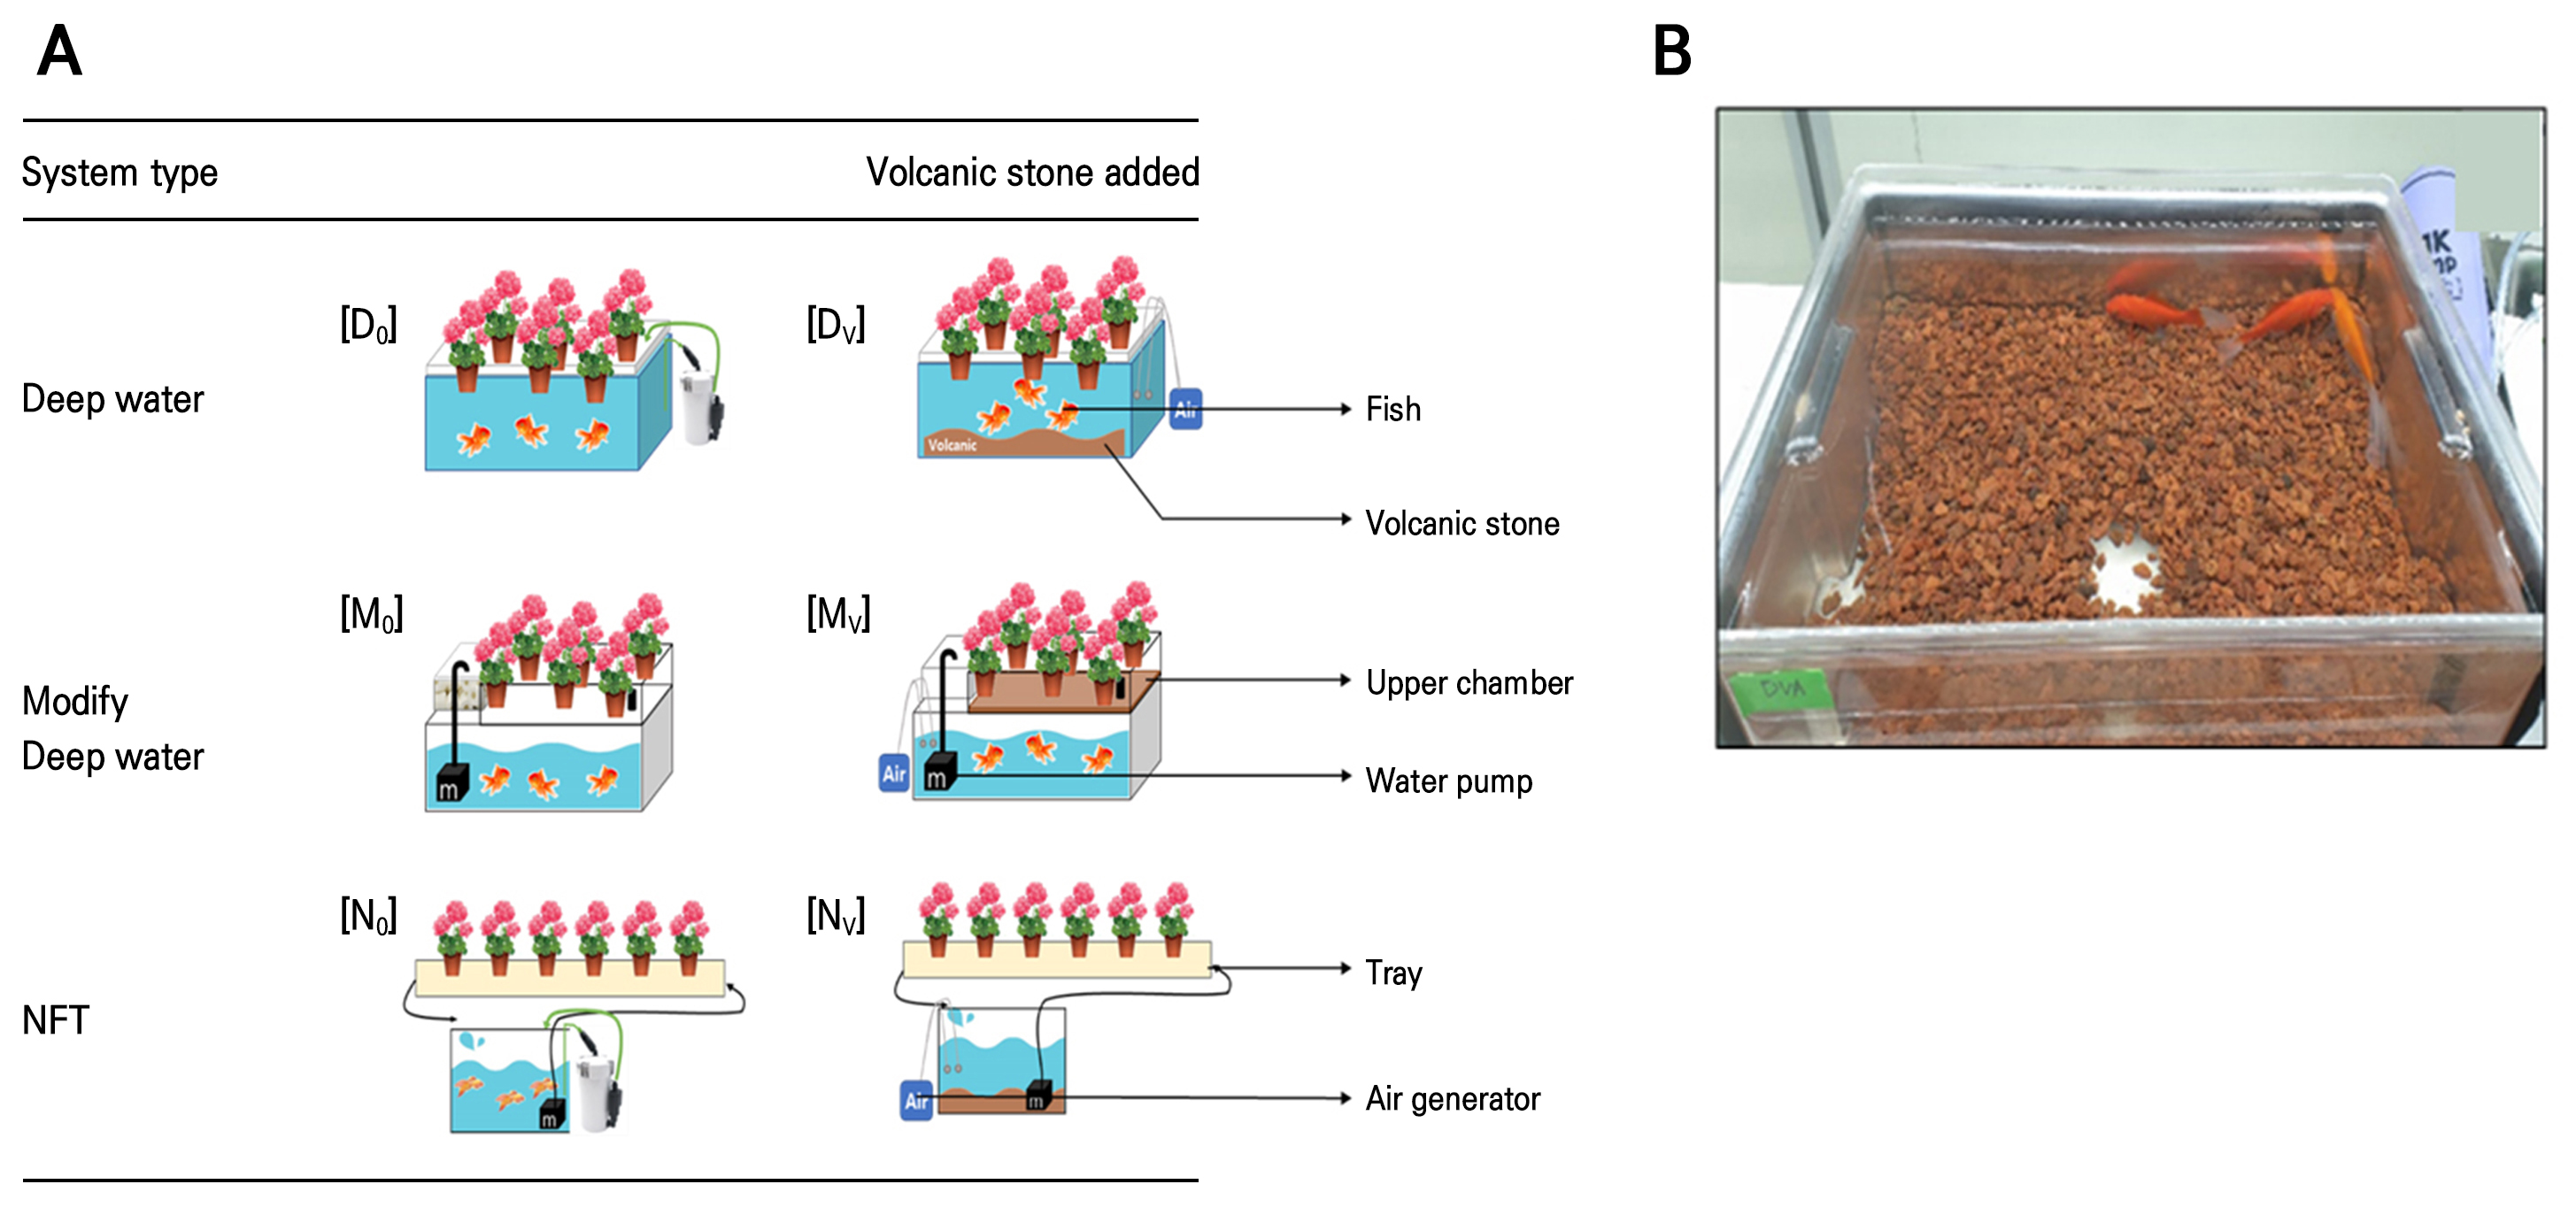
Plant and fish materials
Uniform-sized Geranium (Pelargonium zonale L.) plants with an average plant height of 5 ± 0.1 cm were used in all treatments. Each tank had six plants and three goldfish (Carassius auratus auratus; average weight 17.7 g per fish). Before starting the treatment, fish were kept in a tank to stabilize the water quality based on its pH and EC levels. After that, plants were transplanted into the aquaponic systems, and the treatments were started. In each treatment, fish feed (Grovita, Korea Feed Co., Korea) was provided daily at 0.4 g (0.5% of fish body weight). This feed was a combination of nutrient materials for fish (calcium 0.4%, phosphorus 1.8%, crude fat 4%, crude fiber 5%, and crude protein 13%, respectively).
Measurement of water quality parameter
To maintain the water quality of the aquaponic system, the EC and pH were inspected each day using a portable water quality measurement meter (HI9813−6, Hann Instruments Inc., Romania). Because of the small scale and interior purpose of this experiment, we intended to maintain EC and pH levels in a range that was suitable for both plants and fish. When the pH level of water decreased to 5.5 or less, 5 mL of 1N KOH was added to avoid further acidification. We also tried to keep the EC level appropriate to maintain the ornamental value of the geranium pot flower and goldfish. Ion analyses were performed at weekly intervals for six weeks. Before analysis, water samples from each treatment were filtered using filter paper (Whatman, No. 6, Buckinghamshire, UK). The filtered water was used to detect major ions (NH4+, NO3‒, K+, and Ca2+), and their concentrations in water from all treatments were measured using an ion analyzer (CG200, Cleangrow, UK).
Plant growth measurements
The growth parameters of geranium were measured six weeks after treatment. Plants were picked up from pots, and their roots were washed thoroughly and cleaned of any adhering materials with tap water. Plant height, leaf length, and leaf width, were measured using a ruler. Leaf area was measured by a leaf area meter (Li–3100, Li–COR Inc., Lincoln, NE, USA). The number of leaves (at least 1 cm in size) was counted manually. A chlorophyll meter (SPAD 502, Minolta, Japan) was used to measure the chlorophyll concentrations of the leaves of a plant. For this, three upper leaves (healthy and fully opened) were selected from each plant, and their upper leaf blades were chosen for SPAD reading. The root was carefully washed clean, and root morphology was measured using the WinRhizo Program (WinRhizo Pro ver. 2009, Regent Instrument Inc., Quebec, Canada) images analysis system coupled with professional scanner Epson 1000XL (Seiko Epson Corporation Nagano, Japan) for total root length, total root surface area, number of root tips and average root diameter. Fresh weight and dry weight of the shoot and root were determined using an electronic balance (CUW420HX, CAS Corporation, Korea). Stem diameter (1 cm above the root zone) was calculated using a digital caliper (CD−20APX; Mitutoyo Corp., Kanagawa, Japan). The dry weight of the shoot and root was measured after drying plant samples at 60°C for 48 h in an oven (JEIO TECH OF−22GW, Korea).
Experimental design and data analysis
The experiment was designed with a randomized complete block design having three replications per treatment. Treatment effects and statistical differences were evaluated by IBM SPSS Statistics (version 24 for Windows, IBM Corp., Armonk, NY, USA) and analysis of variance (ANOVA), followed by Duncan’s Multiple Range Test (DMRT) at p < 0.05. For principal component analysis (PCA), Origin 2023 was used (version 10.0, OriginLab, Northampton, MA, USA).
Results and Discussion
Ion concentration in water
In this study, the ammonium (NH4+) concentration in aquaponic water increased in all treatments of both cases (presence or absence of volcanic stone) during the treatment period (Table 1). In the deep water (D) culture system, the NH4+ ion concentration increased by 2- and 3.5-fold in D0 and Dv treatments, respectively, compared to their initial stage. In addition, after 6 weeks of treatment, it was observed that NH4+ ions had increased 1.3-fold for N0, 1.5-fold for MV, and 1.6-fold for NV treated water, compared to their initial concentrations. NH4+ in aquaponic water is primarily generated from fish waste. Due to the recirculating nature of the aquaponic system, fish waste was not immediately absorbed by plants, resulting in an increase in NH4+ concentration over the treatment period. Research has found that an NH4+ concentration of approximately 3 mg·L-1 is preferable for both fish and plants in aquaponic water (Yildiz et al. 2017). These results partially corroborate our findings, where the maximum NH4+ concentration of 3.73 mg·L-1 was observed in the D0 treatment (Table 1).
Table 1.
Effect of different aquaponic systems on ion concentration at initial days, and after the treatment period. Initial days indicate the 1st week after treatment. ‘After’ refers to the average of 2 to 6 weeks of treatment. D0, DV, M0, MV, N0, and NV indicate six aquaponic treatments, where 0 and V represent the absence and presence of volcanic stones in a system, respectively
| Treatment | Ion concentration (mg·L-1) | ||||||||||
| NH4+ | NO3‒ | K+ | Ca2+ | ||||||||
| Initial | After | Initial | After | Initial | After | Initial | After | ||||
| D0 | 1.83y bz | 3.73 a | 34.87 c | 120.08 a | 44.89 a | 100.78 a | 48.17 b | 22.03 c | |||
| M0 | 1.08 c | 1.80 c | 72.54 a | 95.56 b | 35.3 b | 41.41 bc | 20.34 e | 20.63 cd | |||
| N0 | 2.88 a | 3.72 a | 17.18 d | 108.98 ab | 10.87 c | 93.60 a | 29.66 cd | 17.45 d | |||
| DV | 0.46 d | 1.62 c | 32.33 c | 97.55 b | 6.62 c | 34.15 c | 56.78 a | 34.64 a | |||
| MV | 1.21 bc | 1.80 c | 44.11 b | 74.86 c | 37.6 b | 35.58 c | 25.28 d | 27.60 b | |||
| NV | 1.43 bc | 2.26 b | 20.55 d | 116.18 a | 8.77 c | 57.65 b | 34.25 c | 24.67 bc | |||
During the treatment period, the DV and NV treatments showed almost half of the concentration of NH4+ compared to the D0- and N0-treated water. The presence of volcanic stones in the DV and NV treatments may have contributed to the lower NH4+ concentration in their aquaponic water. The physical features of volcanic stones, such as their rough surface, helped capture and retain fish waste, preventing it from being converted into ammonium through decomposition. However, the M0 and MV treatments did not show a significant difference in NH4+ concentration during the treatment period (Table 1).
At 6 weeks, in the D0 and Dv treatments, the concentration of NO3‒ increased approximately 3-fold, and by 6.3- and 5.7-fold in the N0 and Nv treatments, respectively, compared to their initial stage (Table 1). At 6 weeks after treatment, in the M0 and Mv treatments, the concentration increased 1.3- and 1.7-fold, respectively, compared to their initial stage. This increase occurred due to the rise in ammonium levels across all treatments, as ammonium and nitrate ions are interrelated. Researchers have noted that in aquaponic systems, ammonium ions are converted into nitrate ions through the nitrification process, which helps maintain water quality by reducing toxicity (Yang and Kim 2019; Doncato and Costa 2023). Furthermore, after the treatment period, the highest NO3‒ concentration was observed in the D0, N0, and NV treatments (Table 1). However, compared to the M0 treatment, NO3‒ levels in the MV treatment were approximately 39 and 22% lower at the initial and later stages, respectively. The lower concentration in the Mv treatment may be attributed to the presence of volcanic stone. Yildiz et al. (2017) noted that NO3‒ concentrations below 400 mg·L-1 are desirable for an aquaponic system. Our findings align with this concept, as the NO3‒ concentration never exceeded this limit in any treatment throughout the experimental period.
The potassium (K+) concentration for the Dv treatment was significantly lower by 85% at the initial stage, and by 66% after 6 weeks, compared to the D0 treatment (Table 1). In addition, it was lower by 38% in NV-treated aquaponic water than in the N0 treatment at 6 weeks after treatment. The presence of volcanic stones in DV and NV treatments may be responsible for the reduced concentration of K+. Moreover, compared to the initial concentration, the K+ concentration was significantly increased in the water of all treatments (except MV) after 6 weeks of treatment. It increased 2.2-, 5.2-, 8.6-, and 6.6-fold in the D0, DV, N0 and NV treatments, respectively. In addition, a 1.2-fold increase was observed in the M0-treated water. KOH was added to the aqua tanks in all treatments to adjust the pH, and it may have affected the increase in K concentration. In particular, the amount of KOH added was higher in the N0 than in the D0 treatment (data not shown). The presence of K+ in different treatments may be related to the presence of NH4+, as both showed similar concentration trends. Furthermore, at both the initial stage and 6 weeks after treatment, the D0 treatment showed the highest K+ concentration among all treatments (Table 1). Notably, the concentration of K+ in the M0 and MV treatments remained almost similar throughout the treatment period.
John et al. (2022) reported that a concentration of around 150 mg·L-1 of potassium is preferable for plants and fish. In our previous study, we also observed that the potassium concentration ranged from 55 to 125 mg·L-1 in different geranium and goldfish-based aquaponic treatments (Choi et al. 2024). Although treatments with volcanic stones showed a lower concentration of K+, the concentration approached a moderate level by the end of the treatment period (Table 1).
Calcium concentrations were greater in all systems (D, M, and N) containing volcanic stone, both at the initial stage, and after the treatment period (Table 1). Specifically, the concentration was approximately 18% and 58% higher in the DV treatment compared to the D0 treatment, and an approximate 15% and 41% increase in NV treatment compared to the N0 treatment at the initial and after six weeks, respectively. Furthermore, at 6 weeks after treatment, calcium ion concentration decreased, compared to its initial concentration in both D and N systems. At 6 weeks after treatment, in D0 and DV treatments, it had significantly decreased 0.5- and 0.6-fold, respectively, compared to their initial stage; similarly, in the N0 and NV treatments, it had decreased 0.6- and 0.7-fold, respectively. Ca2+ is present in insufficient levels in aquaponics (Seawright et al. 1998). This phenomenon is due to the presence of K+ and pH levels in aquaponic water of all treatments. Other researchers noted that the relation between Ca2+ and K+ is vice versa in aquaponic water (Shamsi et al. 2010); as one increases, the other decreases. Notably, during the experimental period, the pH level in all treatments was shown a decreasing trend (Fig. 2B). However, during the treatment period, M0 and MV treatments showed equivalent concentrations of calcium (Table 1). Rosales-Conrado and Peña-Martínez (2023) noted that a concentration of 17 mg·L-1 Ca2+ is suitable to maintain water quality in the aquaponic systems. Our previous research on kalanchoe and geranium in aquaponic system under different treatments also showed that the range of Ca2+ in water was 20 to 45 mg·L-1. These results support our present findings (Kim et al. 2023; Choi et al. 2024).
EC and pH in water
Maintenance of the EC level in aquaponic water is necessary due to the different requirements of plants and fish. Researchers suggested that an EC of 1 to 1.5 dS·m-1 is preferable for plants in the hydroponic system, because this level enhances different biochemical reactions, and helps to form ions for uptake (Álvarez-García et al. 2019). However, if fish are kept in the same water, the requirement is different, and it is recommended to be below 1 dS·m-1 (Wortman 2015). In this study, the EC level was gradually increased from the initial date, and after 6 weeks of treatment, its level had reached more than 0.3 dS·m-1 in all treatments (Fig. 2A). Increased EC in aquaponic water is due to several factors that include fish waste accumulation, ion concentration, and water source. Due to the re-circulating process followed in our study, constant use of the same water resulted in nutrient ions from fish feed and fish excreta being increased. Also, the amount of ions for plant uptake was lower than the dissolved ions, leading to an increased EC level over the treatment period. Our previous research also supports the present findings (Choi et al. 2024).
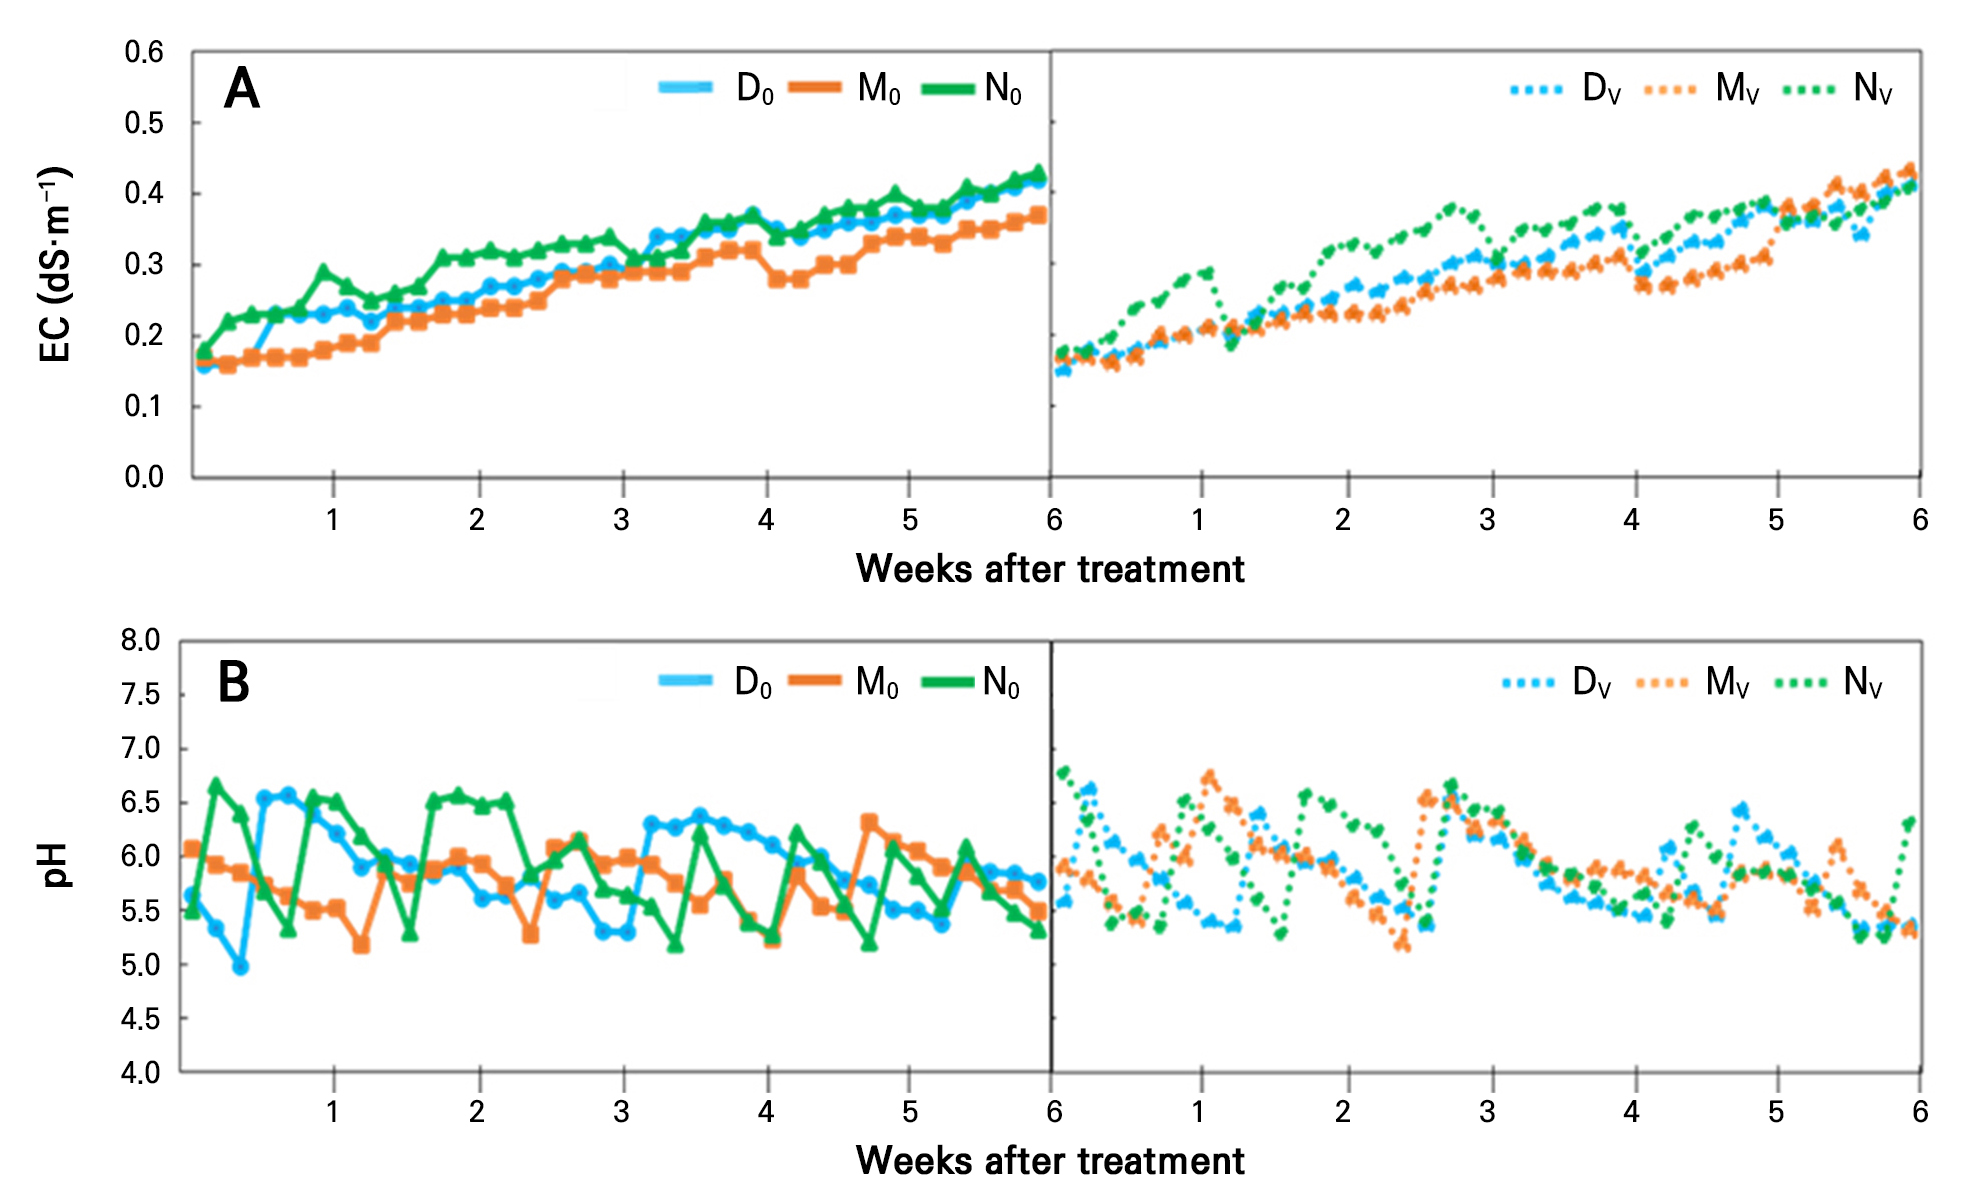
The pH level fluctuated in all treatments in the range of 5.0 to 6.5 (Fig. 2B). Usually, over the treatment period in an aquaponic system, the pH level tends to decrease and become acidic due to increased dissolved ions. Fish feed and excreta add ammonia into the aquaponic water, which releases H+ ions through the nitrification process, and the water becomes acidified (Schreier et al. 2010). This observation indicates that our experiment matched other aquaponics systems. Moreover, from Table 1, it was observed that the ammonia ion increased with time in all treatments. Thus, the EC and pH results in these treatments showed a correlation. Note that we also mentioned in the materials and methods that we protected the pH level from reducing to less than 5.0 by adding 1 N KOH.
Growth performance of geranium
In this study, we used three different types of aquaponic systems. In similar types of aquaponic systems, the plant height of geranium was not significantly affected by volcanic stones (Figs. 3A and 4). In both cases (with or without volcanic stones), the N-system showed shorter-length plants than the others. Furthermore, the plant height was significantly 16% higher in the M0 treatment, than those grown in the N0 treatment. Additionally, the length of DV-treated plants was 19% higher, compared to those grown in the NV treatment.
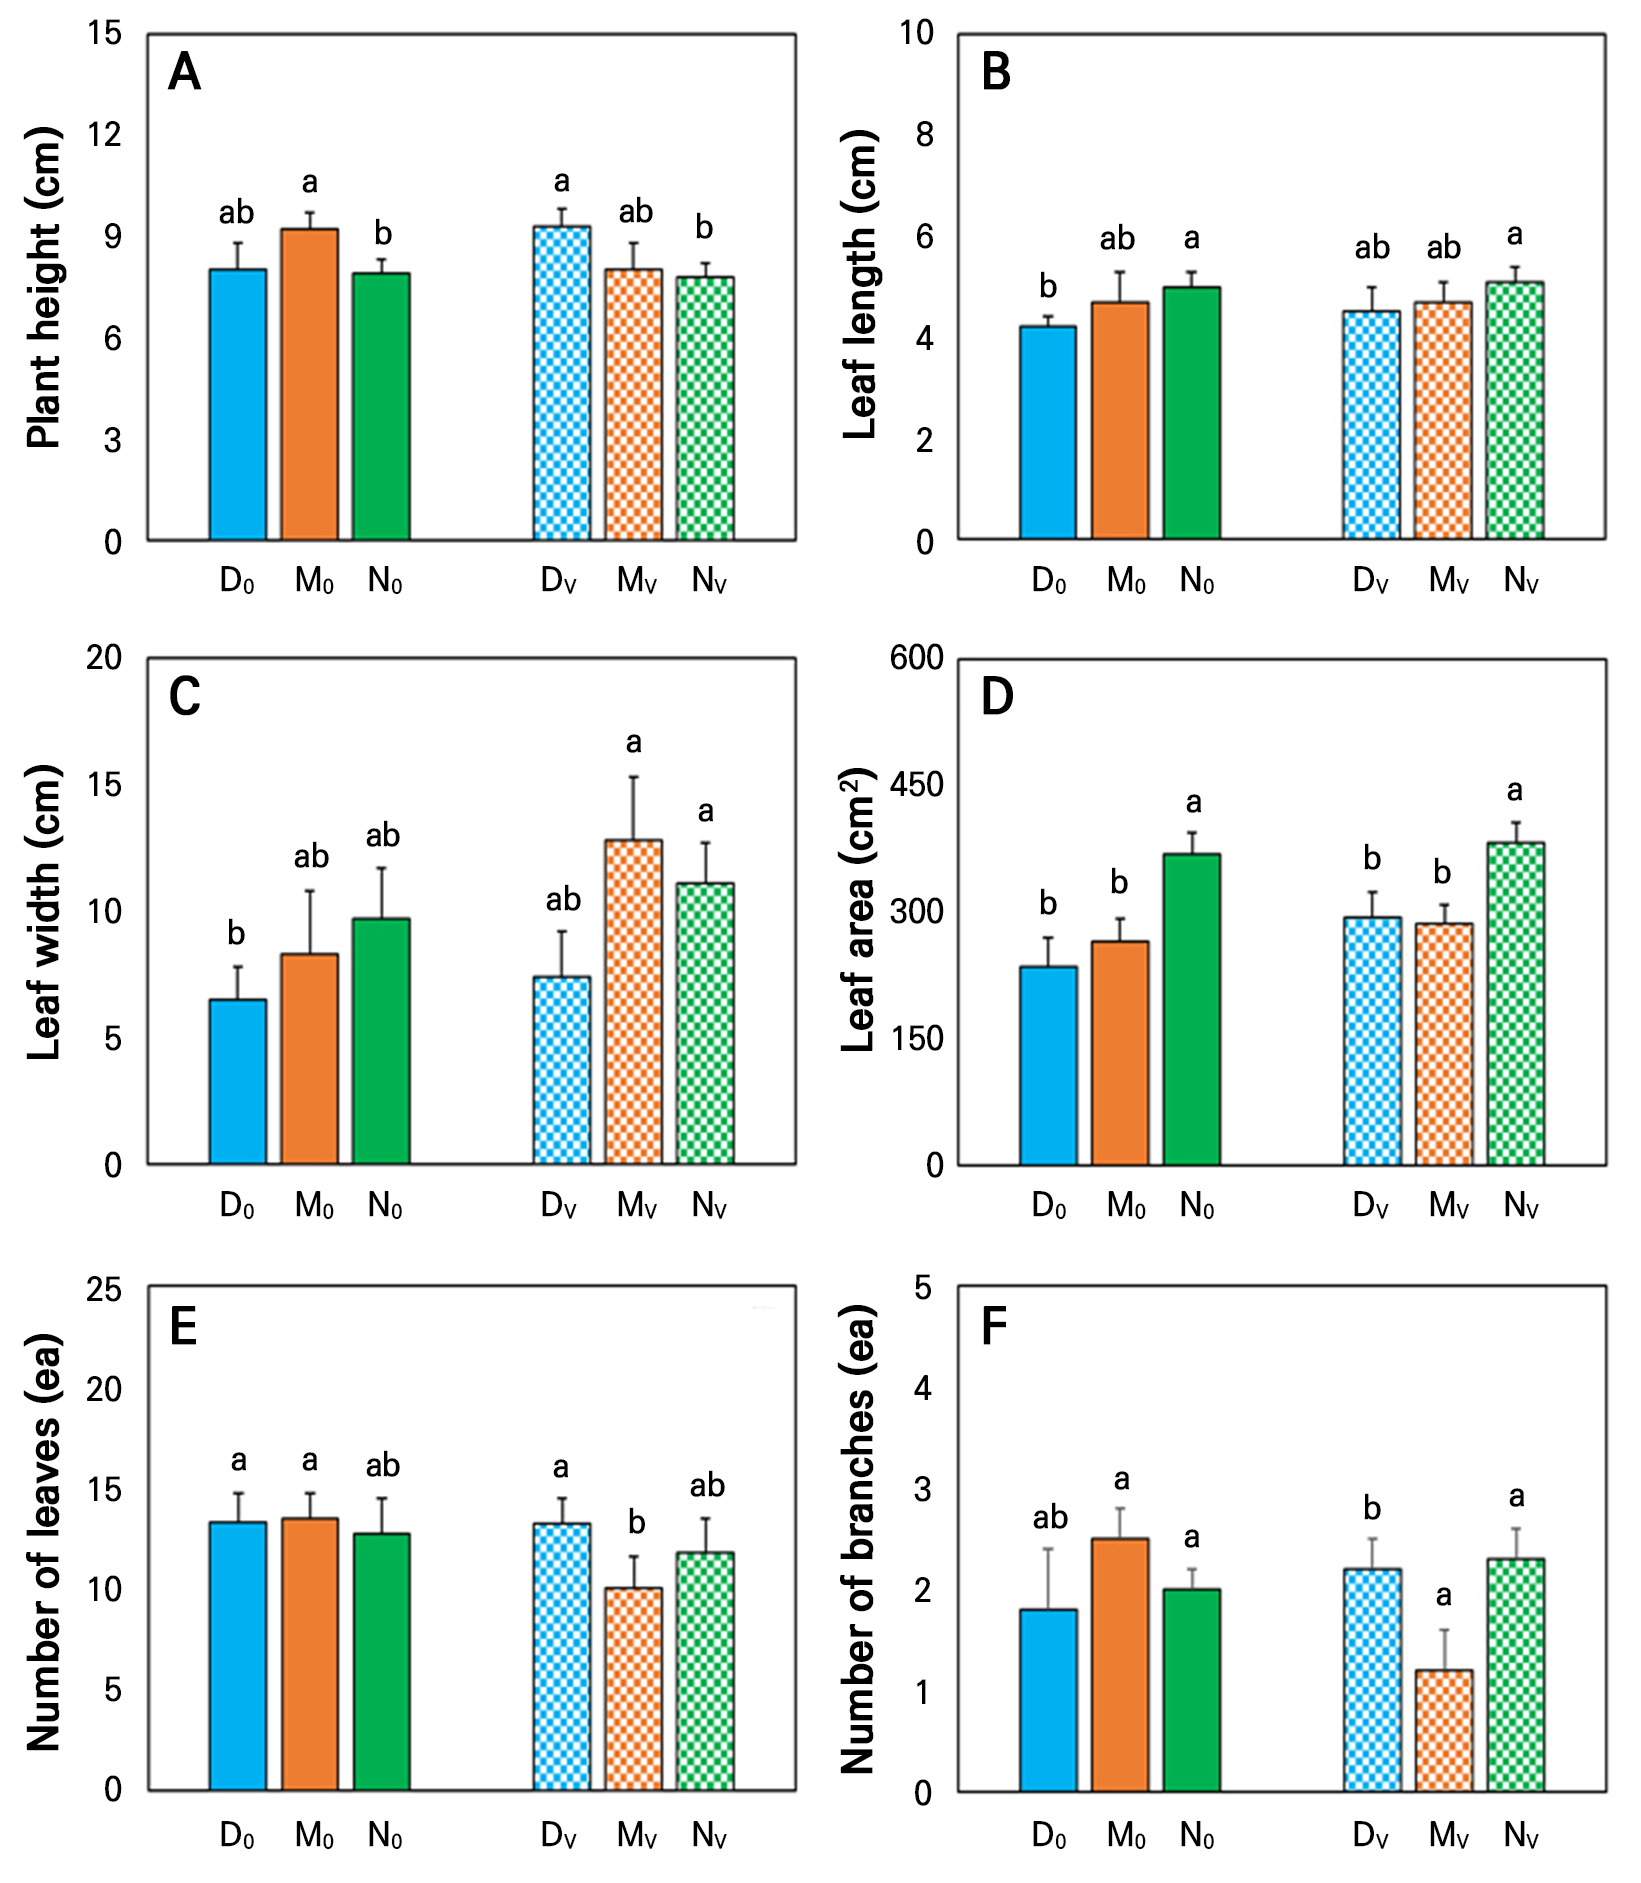
Fig. 3.
Effect of different aquaponic systems on the plant growth parameters of geranium. D0, DV, M0, MV, N0, and NV indicate six different aquaponic treatments, where 0 and V represent the absence and presence of volcanic stones in a system, respectively. Lines above bars represent the standard deviation of the mean (n = 5). Letters above the mean bars indicate significant differences between the treatments according to Duncan’s multiple range test (DMRT) at p < 0.05.
In similar type systems, leaf length, leaf width, and leaf area were also not significantly affected by added volcanic stone. Leaf length was around 19% higher in N0-treated plants, than those grown in the D0 treatment (Fig. 3B). However, there were no significant differences between the volcanic stone-included types of treatments. In addition, leaf width was not significantly different between the types of aquaponic systems when the volcanic stone was absent, as well as when volcanic stone was present (Fig. 3C). However, the leaf area of the geranium was around 30% larger in the N0 treatment, compared to those grown in the D0 and M0 treatments (Fig. 3D). In addition, the leaf area of the NV-treated geranium was 30% and 33% larger than for DV- and MV-treated plants, respectively. This indicates that comparatively, the NFT type aquaponic system is better for geranium growth in both the presence and absence of volcanic stone. The higher and stable concentration of NH4+ may be the reason for the better growth of geranium plants in the N0 and NV treatments. In addition, the design of the NFT system ensures that water floats in the tray where the plant is grown, and stagnant conditions of the water are not allowed, unlike in other types of system. This design was also an important reason for the better growth of plants in the NFT system, because it reduces the possibility of creating ion toxicity in the root zone of plants. Yang and Kim (2020) showed that ion toxicity developed in the root zone of plants over time in an aquaponic system, negatively affecting plant growth.
The number of leaves was significantly higher by 27% in N0-treated plants than in MV-treated plants. Leaf area was significantly larger in N0- and NV-treated plants, than in others (Fig. 3E). Stem diameter was higher in DV-treated plants than in others at a range of 30-60% (Table 2). The number of branches was significantly more than 66% higher in N0- and 92% higher in NV-treated plants than those grown in MV-treated plants (Fig. 3F). The SPAD value was significantly lower in N0- and NV-treated plants than those grown in M0 and MV treatments (Table 2).
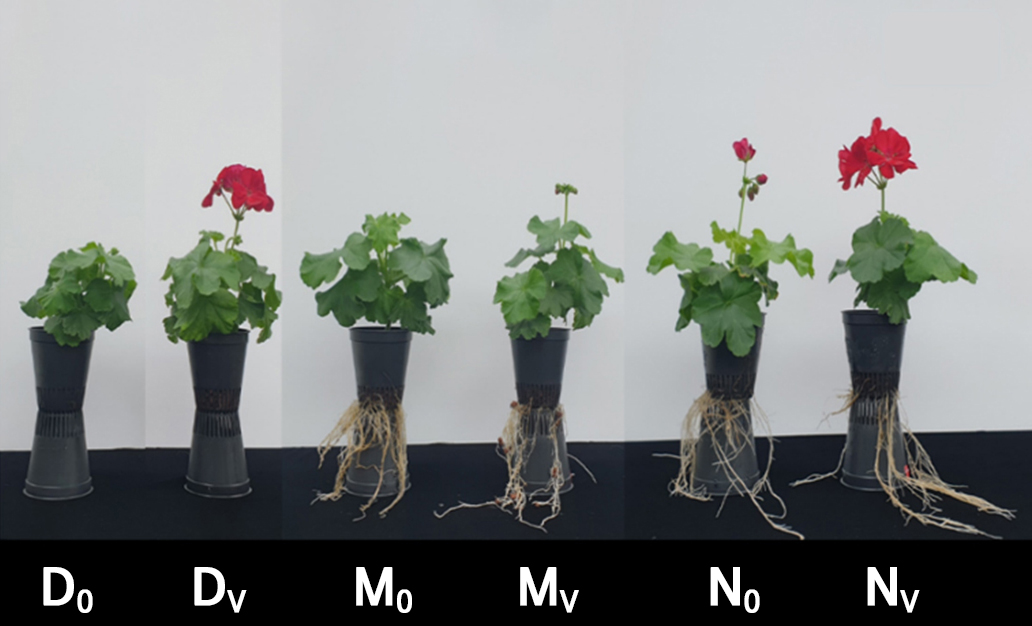
Total root length was the highest in NV-treated plants (Table 2). It was approximately two times higher in the N-system than for those that were grown in the D-system. The total root surface area was highest in NV-treated plants. It was 41% higher than in N0-treated plants. Furthermore, the lowest total root surface area was observed in D0- and DV-treated plants; both showed around 70% lower root area than those grown in NV treatment. The number of root tips were significantly higher in N0- and NV-treated plants than in the others. The D0- and DV-treated plants showed 59 and 34% smaller number of root tips than N0- and NV-treated plants, respectively. However, the average root diameter was lowest in N0- and NV-treated plants, and it was around 12% significantly lower than those grown in D0 and DV treatments. There was no significant difference in the shoot fresh and dry weights of plants among the treatments (Table 2). However, the root fresh weight was higher in NV-treated plants than in the others. Furthermore, the root fresh weight of the N0-treated plant was 16% and 20% higher than those in D0 and MV treatments, respectively.
Table 2.
Effect of different aquaponic systems on plant growth parameters of geranium at 6 weeks after treatment. D0, DV, M0, MV, N0, and NV indicate six aquaponic treatments, where 0 and V represent the absence and presence of volcanic stones in a system, respectively
| Treatment | Plant growth parameters | |||||||||||
|
Stem diameter (cm) |
SPAD (value) | Root |
Fresh weight (g) |
Dry weight (g) | ||||||||
|
Total length (cm) |
Total surface area (cm2) |
Number of root tips (ea) |
Average diameter (mm) | Shoot | Root | Shoot | Root | |||||
| D0 | 4.14y bz | 40.3 abc | 11.7 c | 40.5 d | 467 c | 0.85 a | 11.2 a | 1.9 cd | 0.95 ab | 0.19 a | ||
| M0 | 4.73 b | 45.8 a | 13.3 c | 63.8 d | 697 bc | 0.74 ab | 14.0 a | 2.0 bc | 1.06 ab | 0.14 ab | ||
| N0 | 3.92 b | 39.0 bc | 21.3 b | 91.2 b | 1133 ab | 0.69 b | 15.1 a | 2.5 ab | 1.10 ab | 0.20 a | ||
| DV | 6.37 a | 42.9 ab | 13.3 c | 38.7 d | 955 b | 0.78 a | 15.1 a | 2.0 bc | 1.22 a | 0.15 b | ||
| MV | 4.85 b | 44.1 a | 19.3 b | 70.1 c | 680 bc | 0.70 ab | 12.1 a | 1.9 cd | 0.92 b | 0.14 ab | ||
| NV | 4.36 b | 36.6 c | 29.6 a | 129.0 a | 1444 a | 0.68 b | 15.1 a | 2.7 a | 1.11 ab | 0.17 ab | ||
The root growth of a plant also depends on its shoot growth, including leaf development. This is because photosynthesis is mainly activated in leaves, and its main byproduct sugar is translocated to roots through phloem tissue (Puig et al. 2012). Additionally, sugar acts as a signaling molecule from shoot to root, adjusting root growth (Zhang et al. 2007). Furthermore, root growth is also influenced by the water and nutrient availability in the root zone (Scarpare et al. 2019). Although the water availability was sufficient in all aquaponic systems, it may be that their dissolved nutrients and their concentration are the reasons for the different root growth of plants under different treatments. In this study, we found that NH4+ and K+ ions were comparatively higher in N0 and NV treatments. In addition, leaf growth was also better in the N0- and NV-treated plants than in the others (Table 2).
Correlation
The principal component analysis (PCA) was also implemented to determine the correlation of the different growth parameters of geranium with the different aquaponic treatments (Fig. 5). Fig. 5 illustrates that PC1 indicates 50.73% variability, and PC2 indicates 25.13% variability. This PCA biplot represents clear segregation into two clusters among the parameters. The graph indicates that the number of leaves, stem diameter, and plant height were positively correlated. Meanwhile, leaf area, leaf length, number of root tips, and total root length were positively correlated. Furthermore, the maximum growth parameters were closer to the N0 and NV treatments. This analysis indicates that, considering the growth parameters of geranium, comparatively, the nutrient film technique (N) type aquaponic system is better than the others. Our previous research on geranium plants in aquaponic systems also showed that the number of leaves and plant height revealed a positive correlation (Choi et al. 2024).
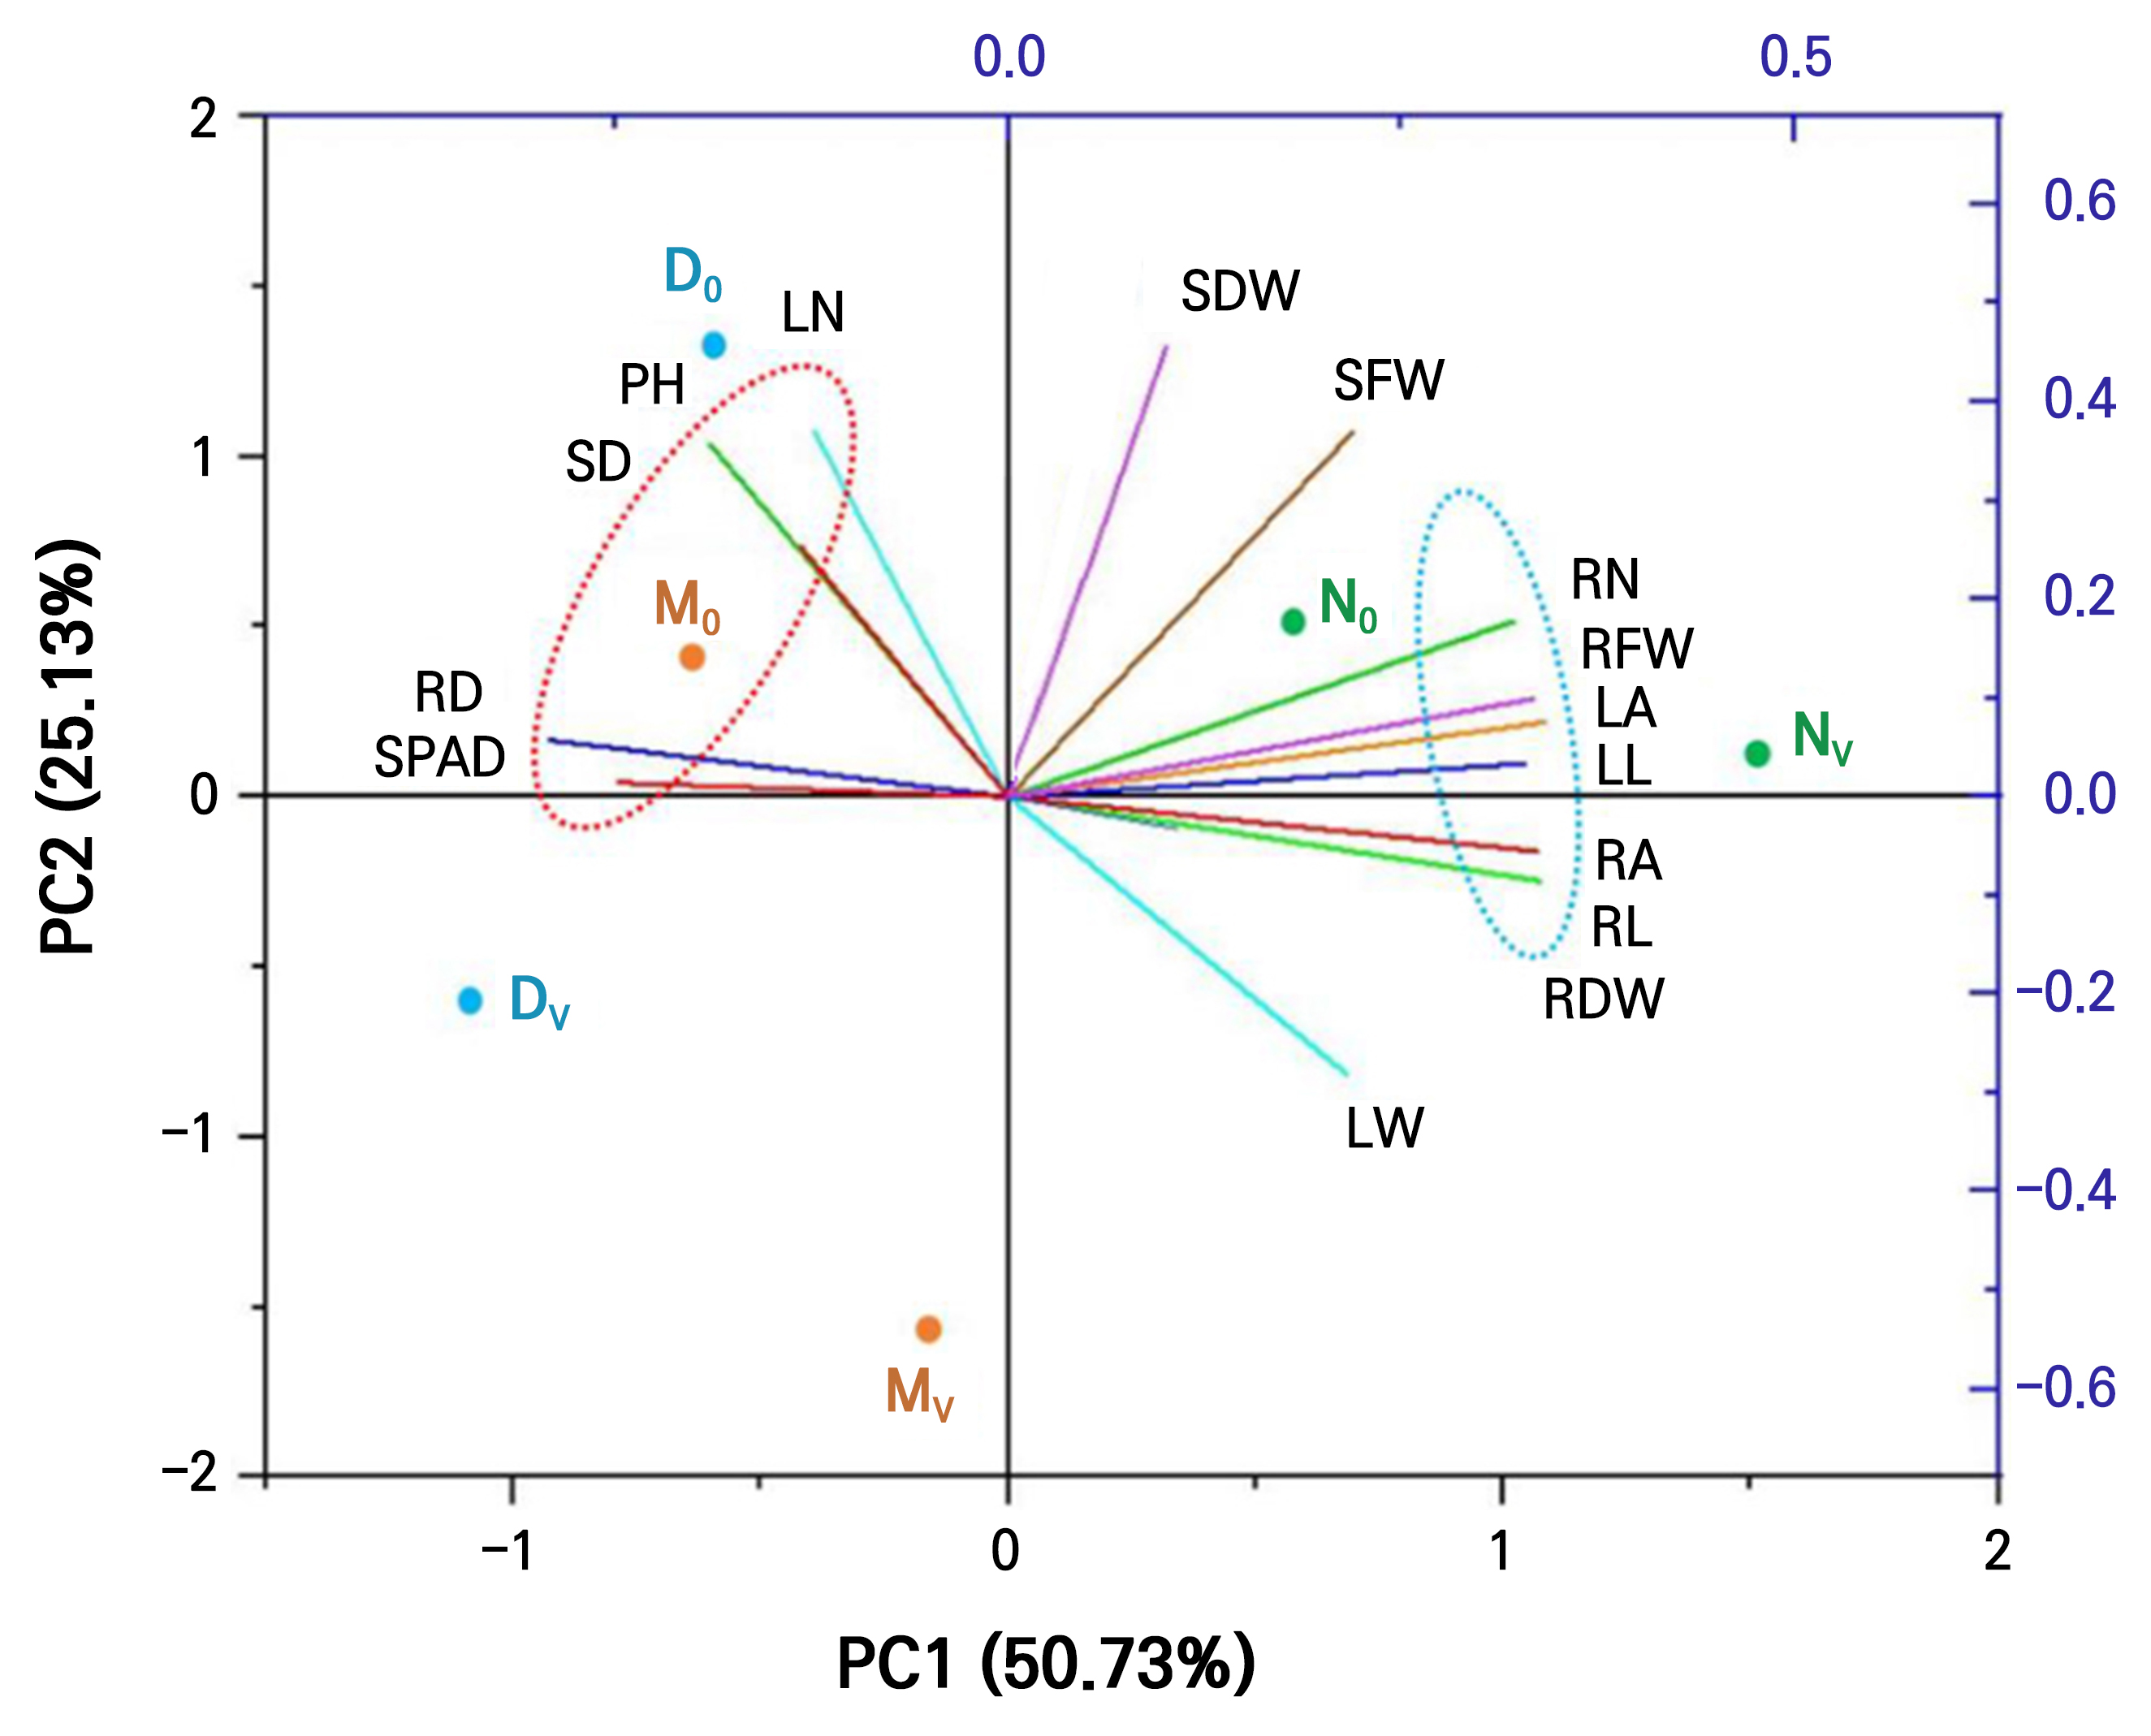
Fig. 5.
Principal component analysis (PCA) illustrates the relationships among the treatments of aquaponic system and plant growth parameters of geranium plant at 6 weeks after treatment under controlled conditions. D0, DV, M0, MV, N0, and NV indicate six different aquaponic treatments, where 0 and V represent the absence and presence of volcanic stones in a system, respectively. SPAD, SPAD value; RD, average root diameter; SD, stem diameter; PH, plant height; LN, number of leaves; SDW, shoot dry weight; SFW, shoot fresh weight; RN, number of root tips; RFW, root fresh weight; LA, leaf area; LL, leaf length; RA, total root surface area; RL, total root length; RDW, root dry weight; LW, leaf width.
Conclusion
In this study, we found that the concentrations of NH4+, NO3‒, and K+ ions increased with the treatment period in all treated aquaponic water (except MV for K+). However, at 6 weeks after treatment, the D0, DV, N0, and NV treatments showed a decreasing pattern for Ca2+ ions. This was because the EC of water also increased, but the pH fluctuated within a range, as it was controlled by KOH. Furthermore, the NFT-treated aquaponic system (N) was comparatively better than the other systems in terms of plant growth characteristics. In addition, the use of volcanic stone in an aquaponic system is preferable to maintain water quality and to reduce the possibility of water toxicity by reducing ionic reactions and dissolved ions in water. Further research is required to compare volcanic stone with other filtration materials.
