

Introduction
Materials and Methods
Leaf sampling
Leaf image acquisition
Image processing and trait extraction
Statistical analysis
Results
Discussion
Introduction
Global agriculture faces increasing pressure to enhance food security while adapting to rapid climate change (Wen et al. 2021). This challenge demands germplasm characterization methods that are rapid, cost effective, and non-destructive to support the development of resilient crop varieties (Mansoor et al. 2024; Baloch et al. 2025). Leaf morphometric traits are an appealing phenotyping resource because they are stable, easy to measure, and widely applied in the fields of plant biology, agronomy, paleobotany, and taxonomy (De Luna-Bonilla et al. 2024; Park et al. 2025). These traits capture variations in the leaf size, shape and structural complexity, providing essential insights into the photosynthetic efficiency, transpiration, stress tolerance and development patterns (El‐Hendawy et al. 2007; Dong et al. 2020; Thai et al. 2025; Toprak and Coşkun 2025). They are also influenced by environmental factors, such as the climate, geology, altitude and soil conditions, making them sensitive indicators of ecological variations (Cornelissen et al. 2003; Marron et al. 2007; Royer 2012). Leaf morphometry has been successfully employed for cultivar identification in crops such as grapevines and for reconstructing paleoenvironments from fossil leaves (Royer 2012; Chitwood et al. 2014).
Despite its broad utility, the potential of leaf morphometric descriptors if used to discriminate Capsicum accessions remains underexplored (Nishani et al. 2025). Chili leaves generally exhibit a consistent ovate-lanceolate shape with smooth margins and an acute apex, suggesting that subtle quantitative variations rather than gross morphological differences must be leveraged for phenotypic discrimination (Idrees et al. 2020). To evaluate such subtle variations, statistical and machine leaning tools, including clustering, principal component analysis (PCA), random forest (RF), and discriminant analysis are commonly used for morphometric classification (Al Hiary et al. 2011; Graf et al. 2024). Among these approaches, linear discriminant analysis (LDA) is one of the most widely used supervised techniques for dimensionality reduction and group discrimination. LDA maximizes the separation between predefined groups and identifies traits contributing most strongly to the class structure (Gardner-Lubbe 2021; Jameson 2024).
In this study, we evaluated eight quantitative leaf morphometric descriptors to examine ability to discriminate Capsicumannum accessions effectively. We hypothesized that leaf morphometric traits alone are insufficient to discriminate among a large number of C. annum accessions reliably if using LDA. Our dataset includes over 350 accessions, each intended to be a unique class/group for discrimination. In particular, the suitability of LDA as a classification method for chili germplasm based solely on leaf morphometric traits was assessed to gain insight into the development of a prediction method. Our objectives were to determine whether LDA can reliably separate accessions using these traits and to evaluate its potential as a rapid, nondestructive phenotyping approach for chili germplasm characterization.
Materials and Methods
Leaf sampling
In 2021 and 2022, leaf samples were collected from 371 and 357 Capsicum annuum accessions, respectively, from mid-June through the fruiting period for image-based phenotyping. All accessions were cultivated under the standardized management practices recommended by the National Seed Resources (https://www.seed.go.kr/sites/seed/index.do), with cultivation taking place at the Rural Development Administration (RDA), Deokjin-gu, Jeonju-si, Jeonbuk-do, Republic of Korea (35°49'51.6"N 127°03'46.0"E) following uniform schedules for irrigation, weeding, and general field management to ensure consistent growing conditions across genotypes.
For each accession, six fully expanded leaves free from visible pathogen symptoms, herbivore damage, or substantial epiphyll coverage were collected. The petiole was included in the leaf boundary for all subsequent image analysis and trait extraction steps. All samples were obtained from plants exposed to full sunlight to minimize leaf morphology variations associated with shading. Leaf sampling was conducted during daytime under natural field conditions. Immediately after collection, leaves were placed in plastic bags without additional moisture and transported indoors to minimize moisture loss and prevent deformation prior to imaging.
Leaf image acquisition
Leaf imaging was performed in an indoor studio (800 × 800 × 800 mm) equipped with an 18 W white LED light source (5600 K; CN-T96, Plastic, Republic of Korea) that provided stable and uniform illumination, thereby minimizing shadows and optical distortion. Images were captured using a Canon EOS D200II digital camera (Canon, Japan) fitted with an EF-S 18 - 55 mm lens and a 24.1-megapixel CMOS sensor. The camera settings included an exposure time of 1/25 s. Because convex lenses are prone to central thickening that can introduce geometric distortion, the camera’s built-in distortion correction function was activated to reduce measurement errors. Leaves were placed on a custom-made white background plate to ensure strong contrast with the leaf surface. All samples were arranged flat, with no overlapping and with the adaxial surface facing upward. Imaging was conducted under controlled lighting conditions, and the camera was positioned at a fixed distance to maintain a consistent scale across all accessions.
Image processing and trait extraction
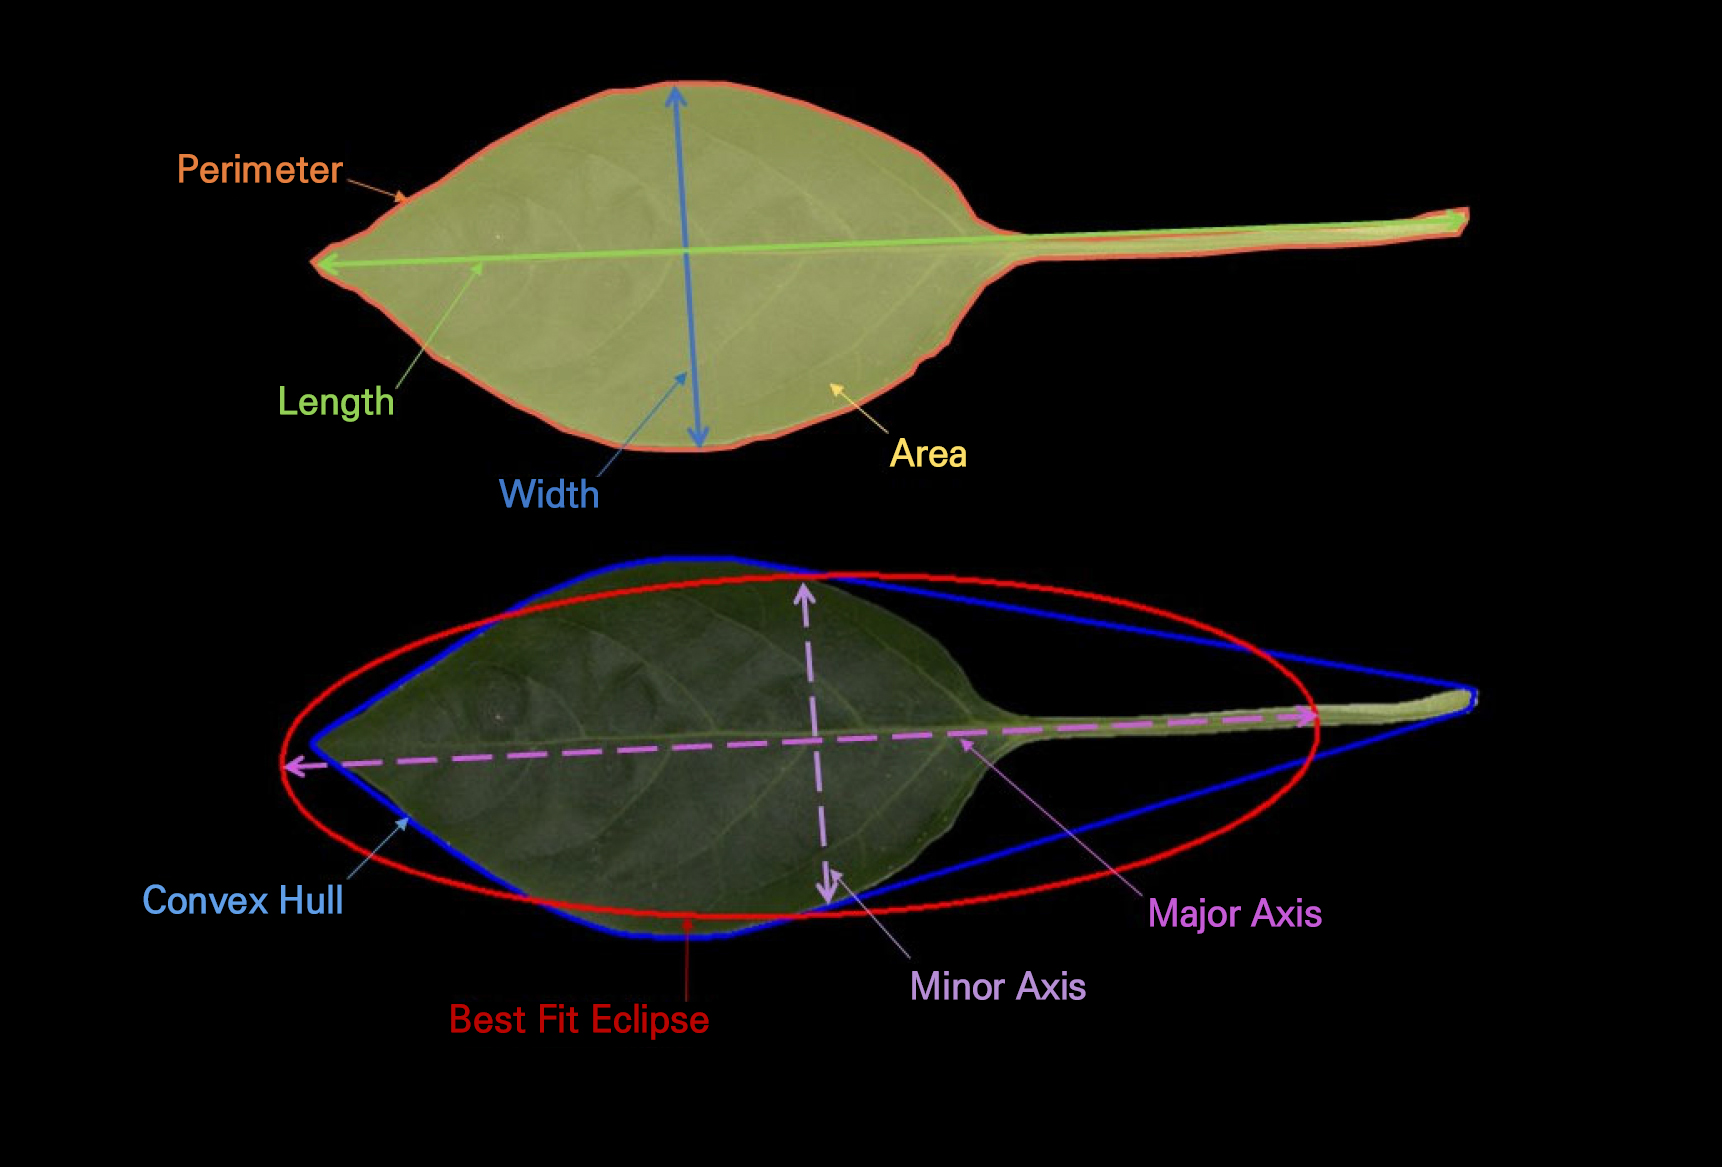
Leaf image processing was conducted using ImageJ software (National Institutes of Health, USA). All images were initially inspected for clarity and proper leaf placement. Subsequently, the contrast of each image was adjusted when necessary to ensure clear separation between the leaf surface and the background. A uniform thresholding procedure was applied to segment the leaf from the background, followed by binary conversion. Any minor artifacts or noise were removed using the “Outside,” “Fill Holes” and “Despeckle” functions to ensure accurate shape reconstruction. For each leaf, the outline was extracted using the “Analyze Particles” tool with standardized size and shape criteria to avoid any accidental selection of non-leaf objects. The scale for each image was calibrated using the pixel resolution prior to measurement. All trait extractions (Table 1) were performed using ImageJ’s built-in measurement suite. Eight quantitative leaf morphometric descriptors—leaf area, perimeter, circularity, leaf length, leaf width, aspect ratio, roundness, and solidity—were used to evaluate their ability to discriminate effectively among Capsicum annuum accessions (Table 1 and Fig. 1).
Table 1.
Morphometric traits obtained from chili (Capsicum annuum) accessions
| Trait | Description | Formula | References | |
| Leaf length | Maximum distance along the leaf’s major axis | cm | L = Major axis length | Park et al. 2025 |
| Leaf width | Maximum distance perpendicular to the major axis | cm | W = Minor axis length | Park et al. 2025 |
| Leaf Area | Total projected area of the leaf surface | cm2 |
A = Npixels × (pixel size)2 ; N ‒ Number of Pixels | Bankhead 2025 |
| Perimeter | Length of the leaf boundary | cm |
P = Nboundary pixels × pixel size ; N ‒ Number of Pixels | Bankhead 2025 |
| Aspect Ratio | Ratio of major to minor axis lengths, representing leaf elongation | No unit | AR = L/W | Fanourakis et al. 2021 |
| Circularity | Parameter that describes how closely a leaf’s shape resembles a perfect circle | No unit | Circularity = 4π×A/P2 | Fanourakis et al. 2021 |
| Solidity | Computed as the ratio of leaf area to its convex hull area, indicating leaf margin smoothness or the degree of lobing | No unit | Solidity = A/Aconvex hull | Fanourakis et al. 2021 |
| Roundness | Defined as the ratio of the minor axis to the major axis, describing the overall compactness of the leaf | No unit | Roundness = W/L | Fanourakis et al. 2021 |
Statistical analysis
All analyses were performed in R v4.5.1 using RStudio (integrated development environment for R, RStudio Inc., USA). The dataset was initially examined for missing entries, duplicated records, and apparent data-entry errors. Outliers were identified using the interquartile range (IQR) criterion and were removed to enhance the robustness of the subsequent analyses. Descriptive statistics (mean, median, and range) were calculated to summarize the dataset. Data distributions were evaluated using the Shapiro-Wilk test for normality, alongside skewness and kurtosis, and Levene’s test for homogeneity of variance. The performance of LDA depends on key assumptions, normally distributed predictors, homogeneity of variance-covariance matrices across groups, linear class boundaries and low multicollinearity among features (Jameson 2024). As chili leaf morphometric variables deviated significantly from a Gaussian distribution and exhibited substantial covariance heterogeneity (violating key LDA assumptions), and given the analytical intractability of classifying over 350 individual accessions with only eight highly correlated predictors, the following strategy was adopted: standardization and PCA, cluster definition (grouping factor), and discriminant analysis.
First, leaf morphometric data were standardized (z-scored) and Pearson correlation was used to construct the covariance matrix. PCA was then performed on the standardized data to capture major phenotypic variations and address multicollinearity. Second, k-means clustering was applied to the principal component (PC) scores to define broad phenotypic groups instead of using individual accessions as classes. The optimal number of clusters (k) was determined using the silhouette method, which yielded k = 8 clusters for the 2021 data and k = 3 clusters for the 2022 data. These clusters served as the predefined groups for the subsequent supervised analysis. Finally, Fisher’s linear discriminant analysis (LDA) was conducted using the PC as predictors and the derived k-means clusters as the classification factor, an approach more robust when data are non-normal, highly correlated, or exhibit unequal covariance structures.
Results
Descriptive statistics of leaf morphological traits revealed clear differences between the 2021 and 2022 seasons (Table 2). Leaves were generally larger in 2021, with a higher mean leaf area (0.589 cm2) compared to 2022 (0.510 cm2). The maximum leaf area also differed substantially between the years, reaching 3.066 cm2 in 2021, whereas it was 2.185 cm2 in 2022. Leaf width followed this pattern, whereas leaf length was slightly greater in 2022, indicating that leaves in 2021 were broader while those in 2022 tended to be longer and narrower. Additionally, leaf perimeter values were greater in 2022 than in 2021, suggesting that although leaves were narrower in 2022, they had more elongated or complex margins.
Table 2.
Summary statistics of chili leaf morphometric data
Shape descriptors (circularity, aspect ratio, roundness, and solidity) also supported these differences. Circularity and roundness values were higher in 2021 than in 2022 (Table 2), indicating more circular and broader leaf shapes in 2021. In contrast, leaves in 2022 were more elongated and less circular. The aspect ratio increased from 2.07 in 2021 to 2.62 in 2022, confirming that the 2022 foliage was more elongated. Solidity was slightly lower in 2022, suggesting more irregular or serrated leaf margins.
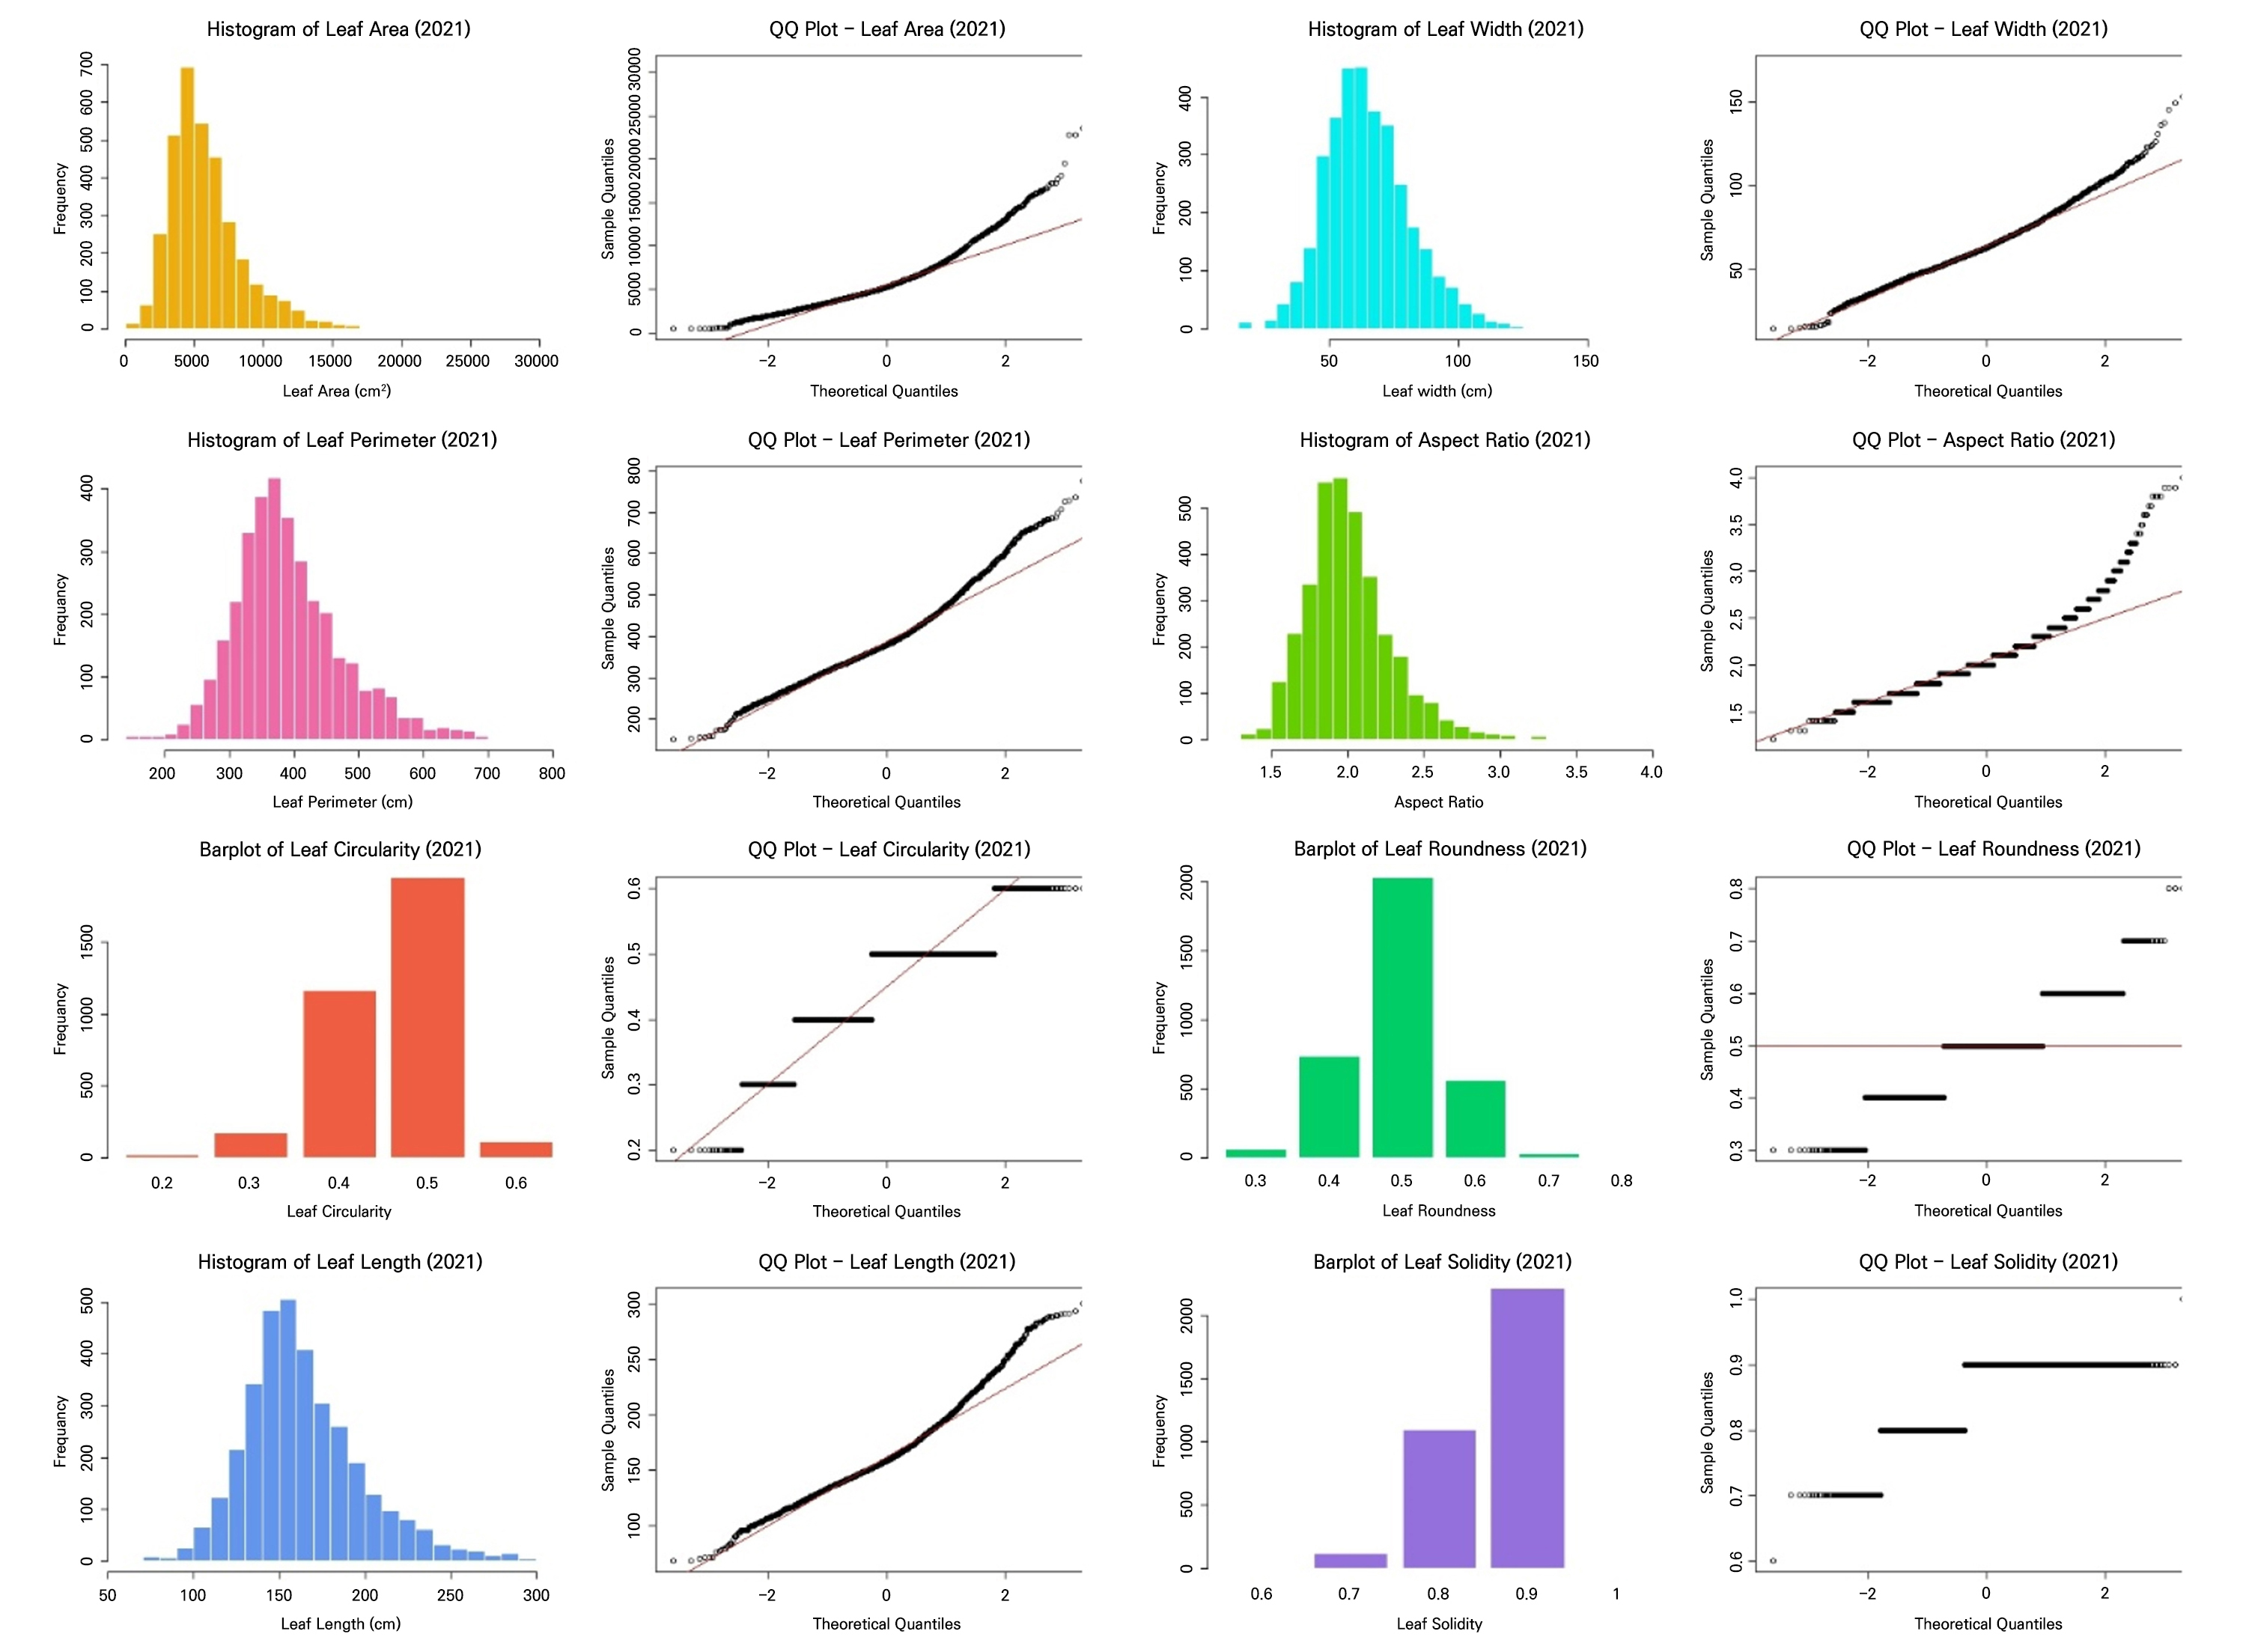
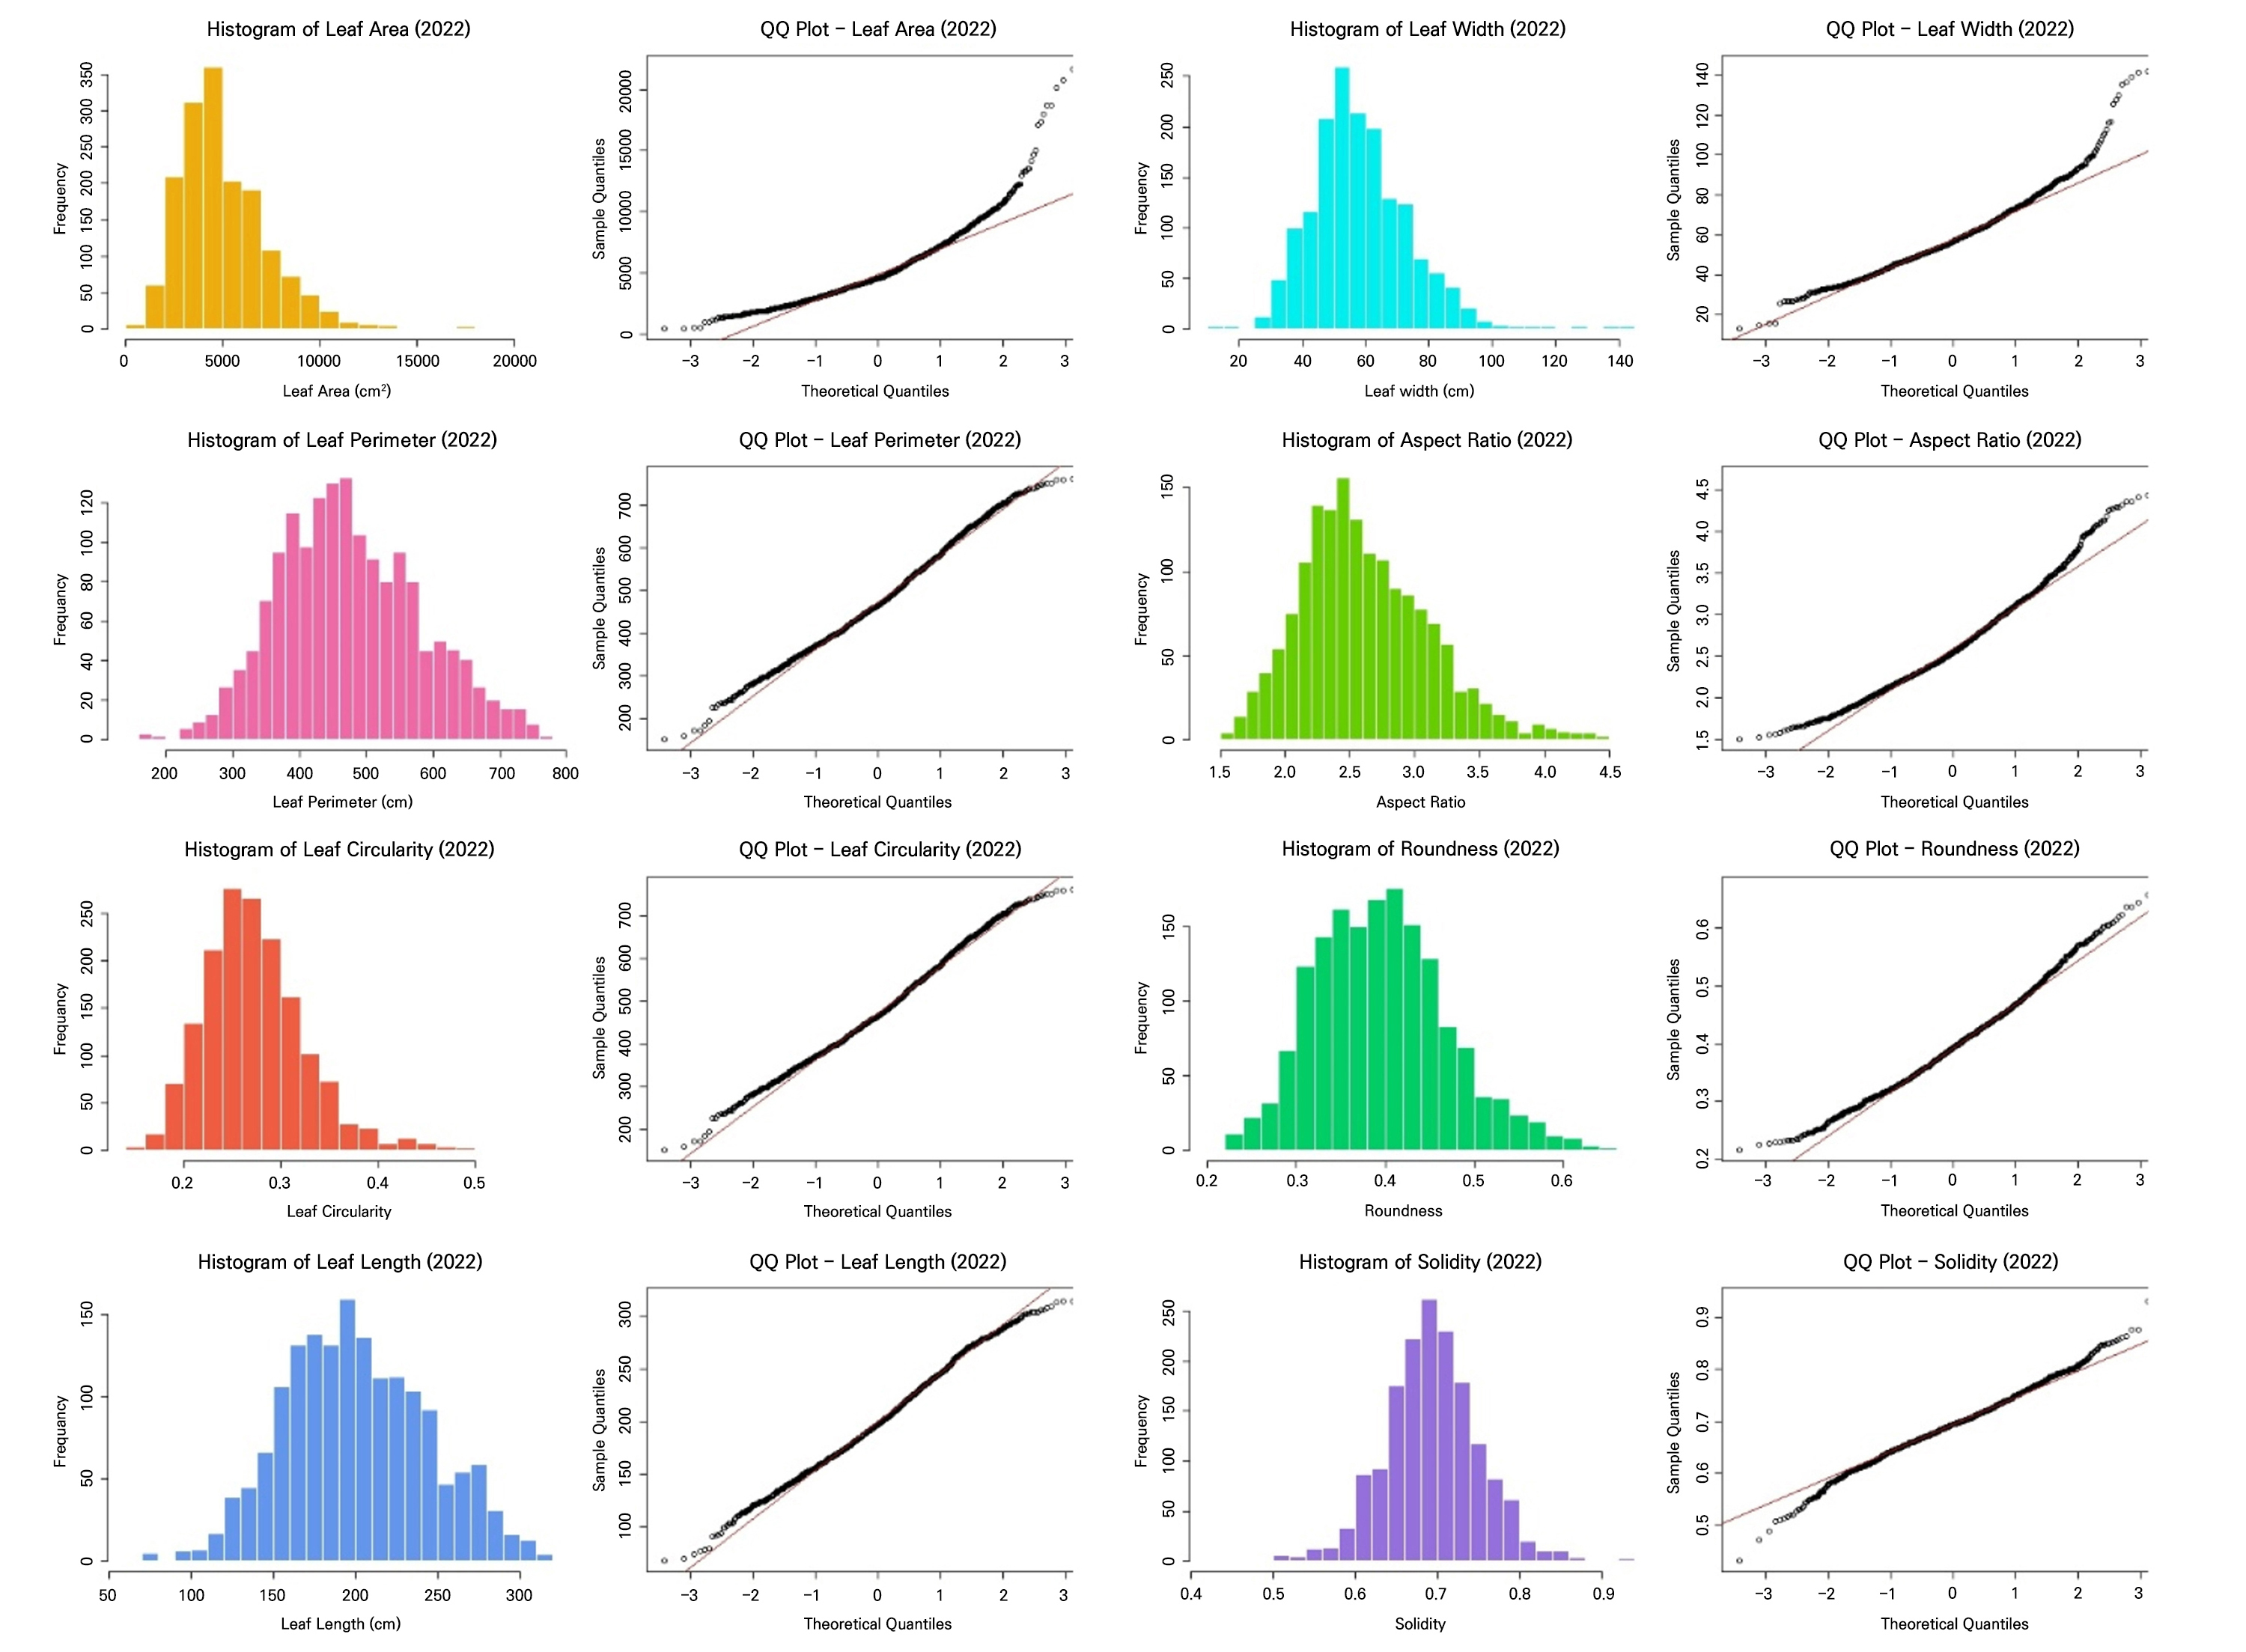
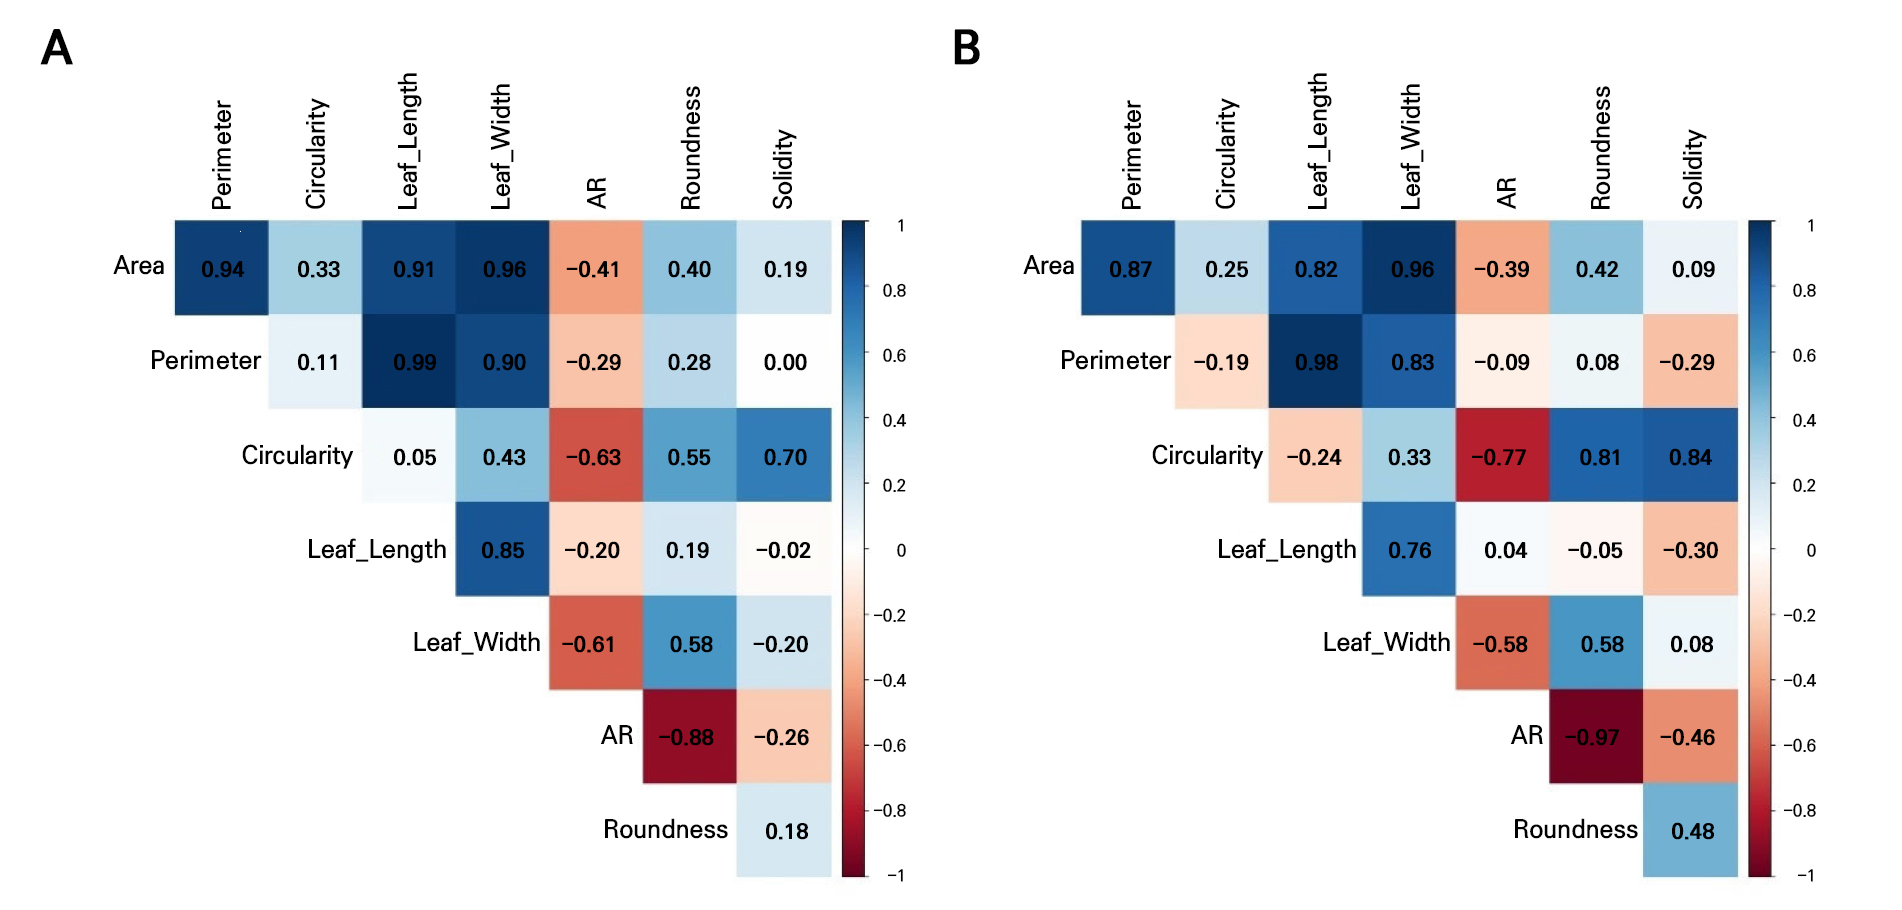
These results showed that both datasets fail to satisfy the key assumptions of LDA (Table 3, Figs. 2 and 3). All leaf morphometric traits deviated strongly from normality (Shapiro–Wilk, p < 0.001) with evident skewness and leptokurtosis, and variances were significantly heterogeneous across the groups (Levene’s test, p < 0.001). The results of the correlation analysis in Fig. 4 reveal pronounced multicollinearity in both years, with the area, perimeter, length, and width exhibiting very strong positive associations (r ≥ 0.9 in 2021; r > 0.8 in 2022). Additionally, circularity and solidity were highly correlated in both years (r > 0.7), and circularity showed a strong positive correlation with roundness in 2022 (r = 0.81). Conversely, the aspect ratio displayed strong negative correlations with roundness (r < ‒0.8), reflecting inherent geometric redundancy. The overall covariance structure was nearly identical between the seasons, indicating that both datasets contain tightly coupled shape and size descriptors that violate the independence assumptions required for LDA.
Table 3.
Summary of statistical tests assessing normality, skewness, kurtosis, and homogeneity of covariance among chili leaf traits
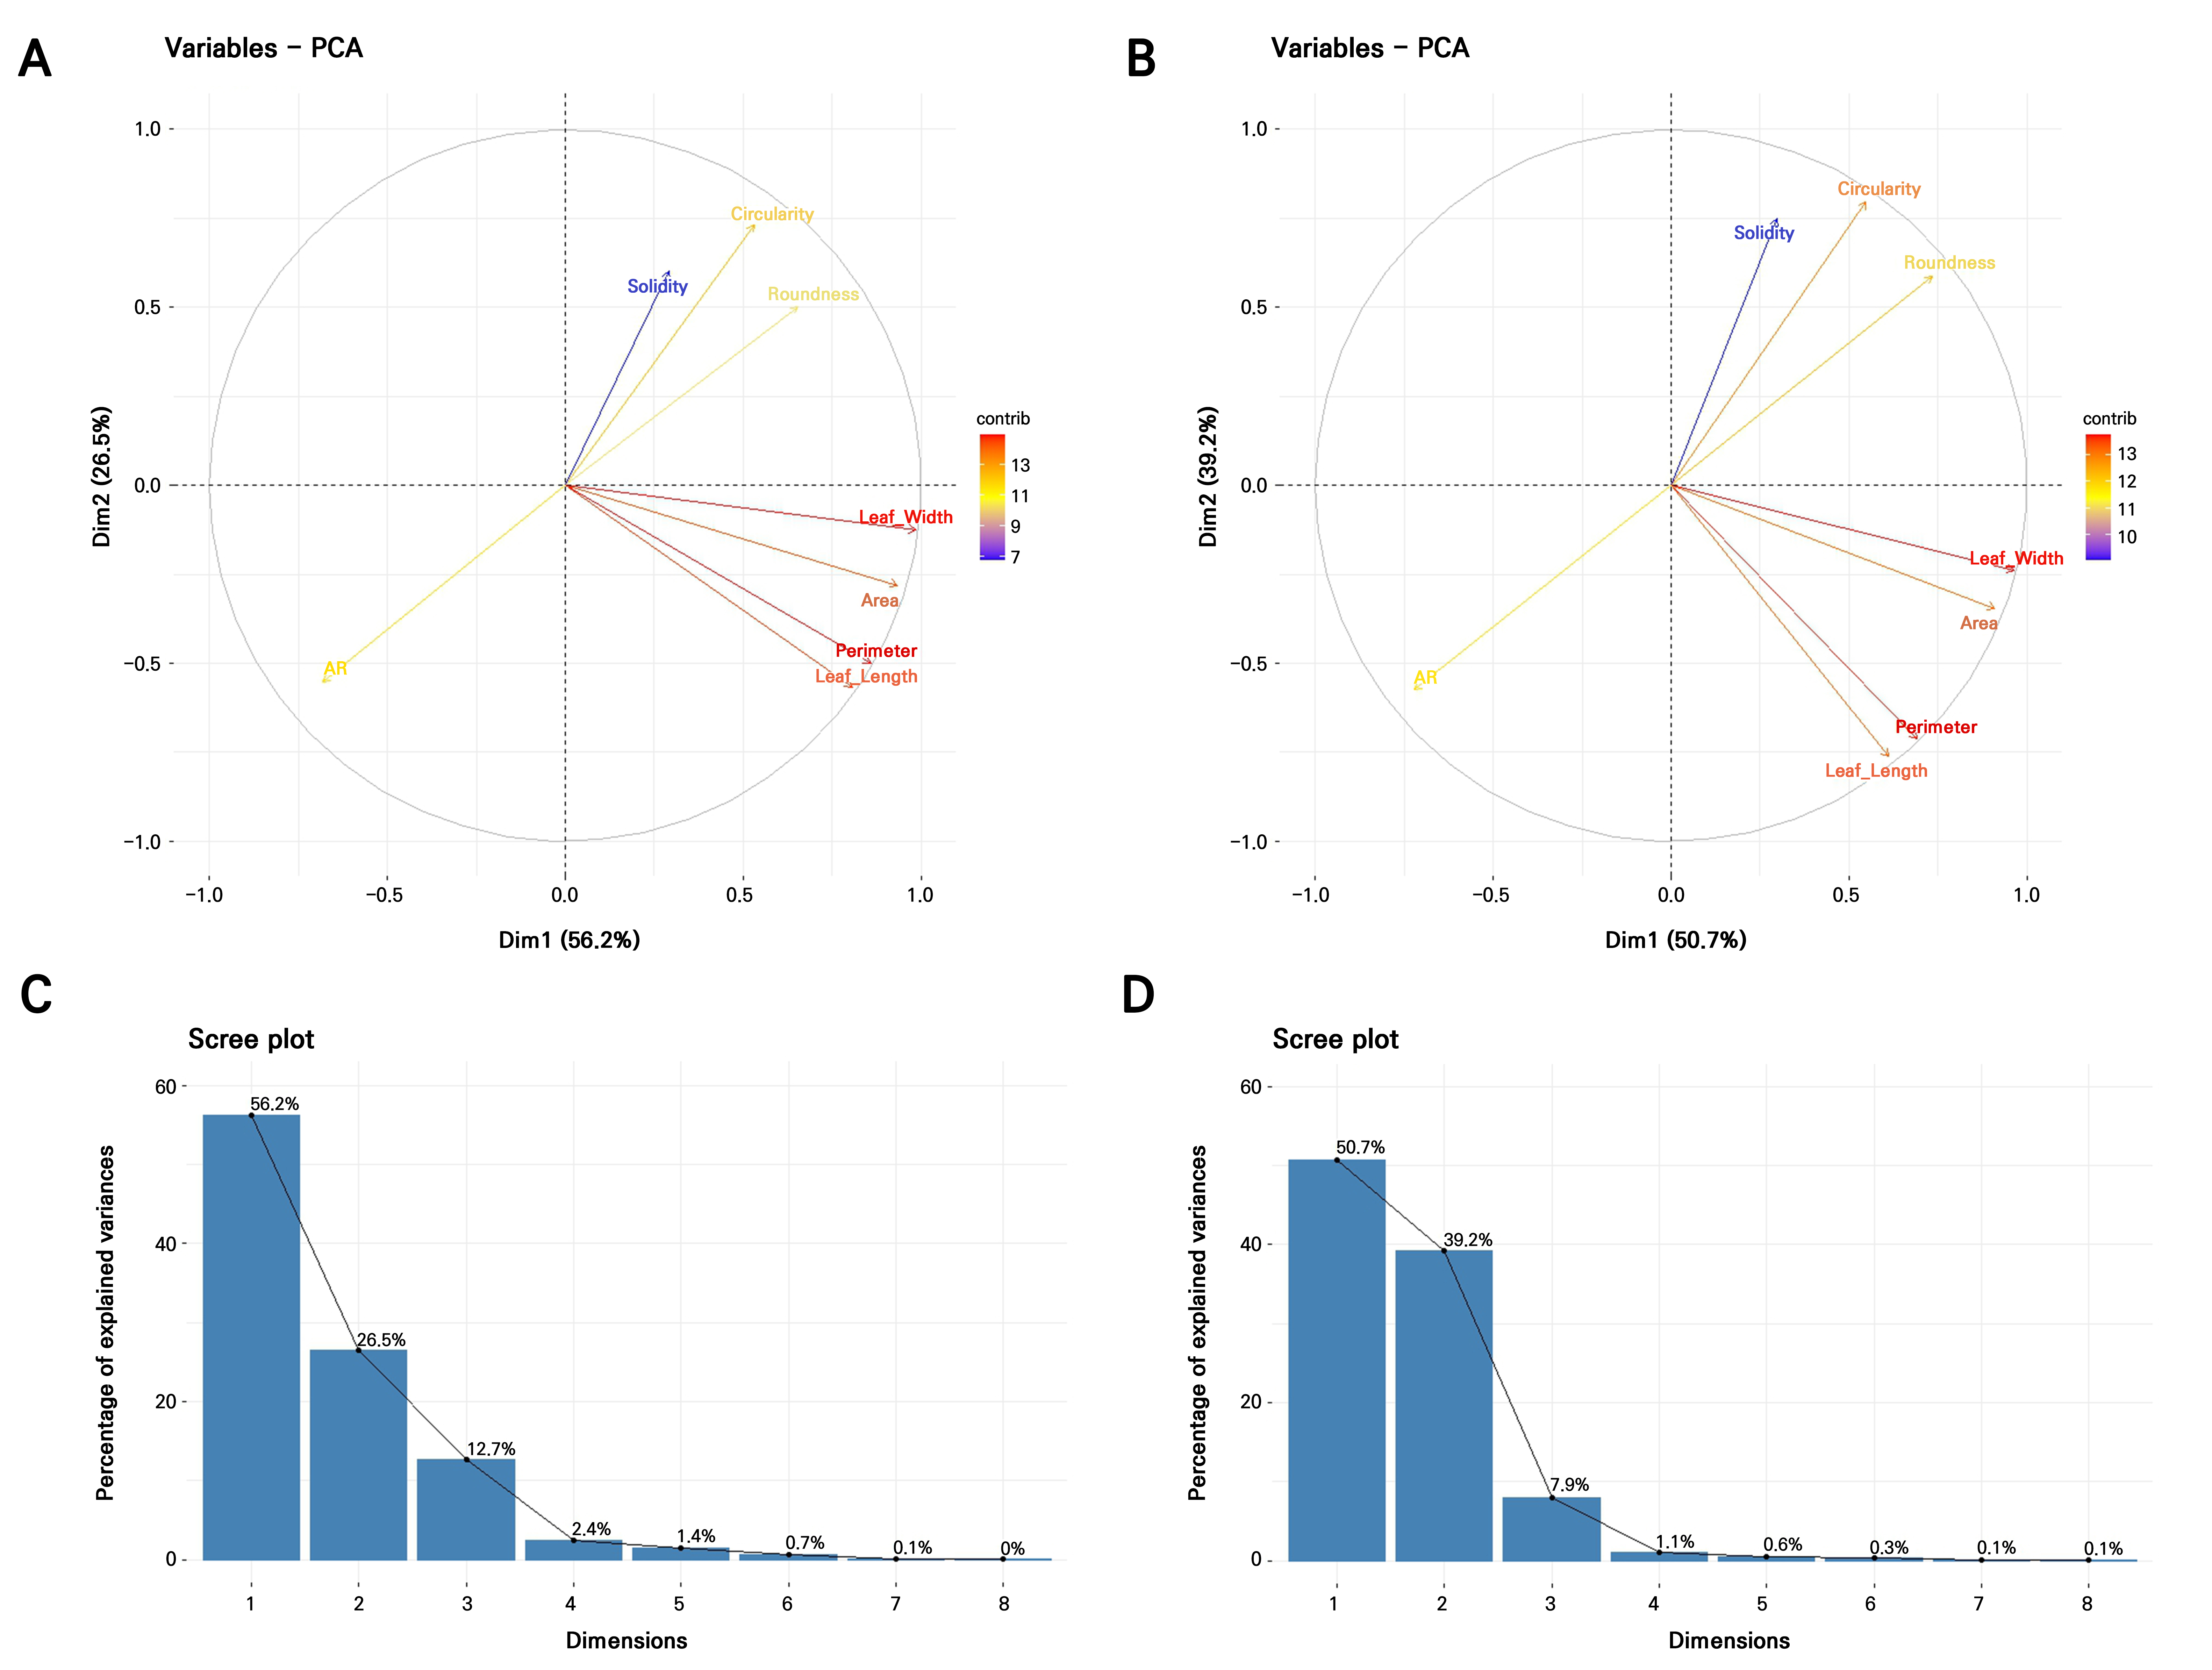
Given the aforementioned failures to satisfy the normality, equal covariance, or low multicollinearity criteria assumptions of LDA and considering the very large number of accessions (371 accessions in 2021; 357 accessions in 2022) combined with substantial overlap among individuals, it is unrealistic for LDA to discriminate more than 350 classes using only eight correlated quantitative predictors. To address these constraints, Fisher’s linear discriminant analysis was applied using principal components (PCs) derived from standardized data as predictors, with k-means clusters serving as the grouping factor (Fig. 5). This approach is more robust when data are non-normal, highly correlated, or exhibit unequal covariance structures (Qu and Pei 2024). The PCA indicated that the first four PCs captured more than 97% of the total variance in 2021, while the first three PCs accounted for over 97% of the variance in 2022 (Table 4, Fig. 6C and 6D). For both years, PC1 was strongly influenced by nearly all traits except for the aspect ratio, whereas PC2 reflected opposing contributions, with the area, perimeter, length, width, and aspect ratio loaded in one direction and the circularity, solidity, and roundness loaded in the opposite, highlighting a clear separation between size- and shape-related descriptors (Table 4, Fig. 6A and 6B).
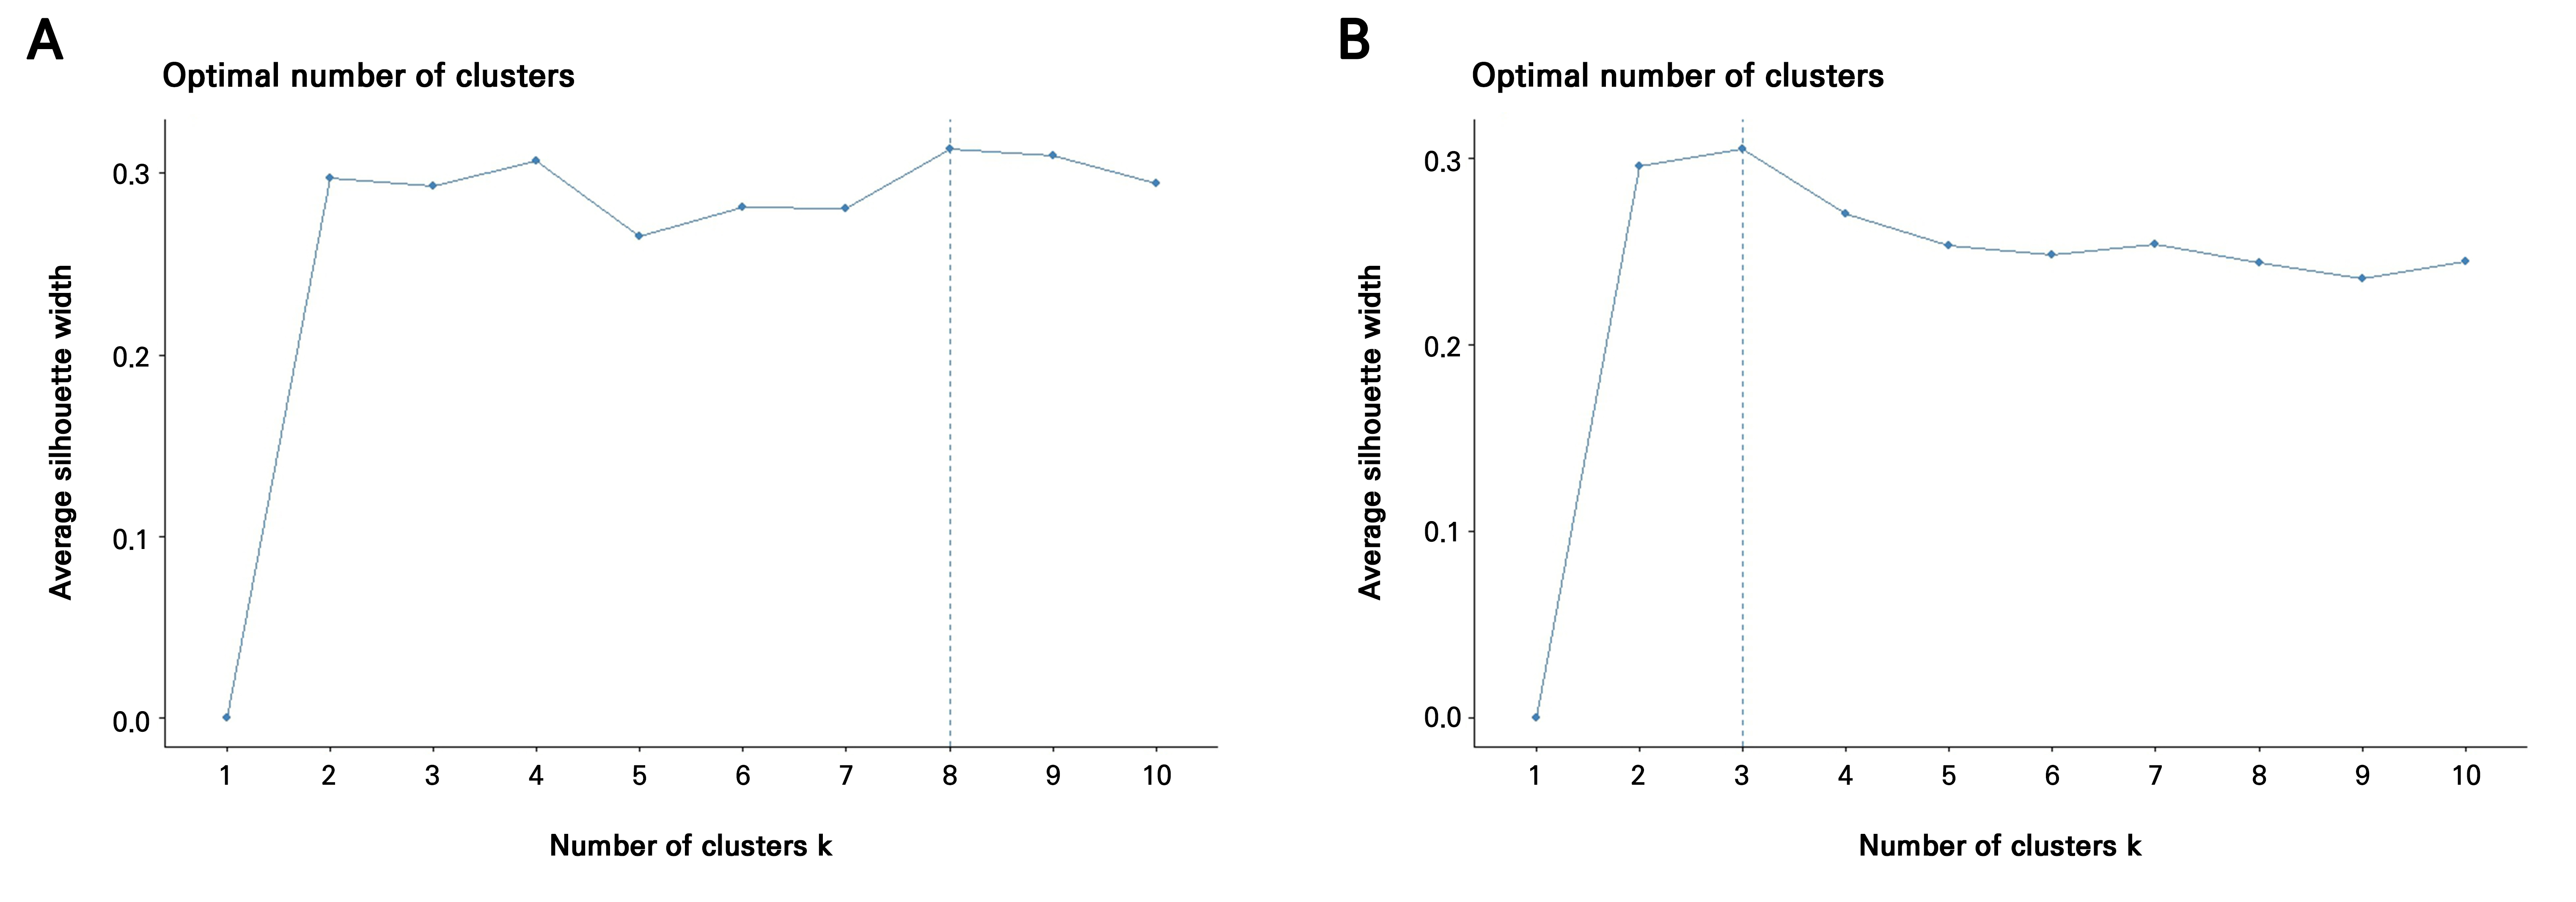
Table 4.
Principal component analysis with chili leaf traits across two years
The LDA revealed that most discriminatory power was concentrated in the first linear discriminant (LD1) for both years, explaining 63.26% of the variation in 2021 and 66.71% in 2022, followed by LD2 (23.59% in 2021; 23.19% in 2022) and LD3, which accounted for only minor proportions (13.15% in 2021 and 10.10% in 2022) (Table 5). Therefore, the first two LDs are sufficient for visualizing the separation of clusters (Fig. 7). In 2021, LD1 was strongly influenced by PC1 (loading = ‒1.26) and moderately by PC3 (‒0.51), indicating that the primary separation among clusters was driven by size-related traits. LD2 was dominated by PC2 (1.23), while LD3 was mainly defined by PC3 (1.45), reflecting secondary contributions from shape descriptors. In contrast, the 2022 dataset showed a reversed direction for PC1 on LD1 (1.47), suggesting a shift in how size traits contributed to group separation, while PC2 loaded negatively and strongly on LD2 (‒1.03). LD3 in 2022 was heavily influenced by PC3 (‒1.78), indicating that fine-scale shape variations contributed most to the third discriminant axis.
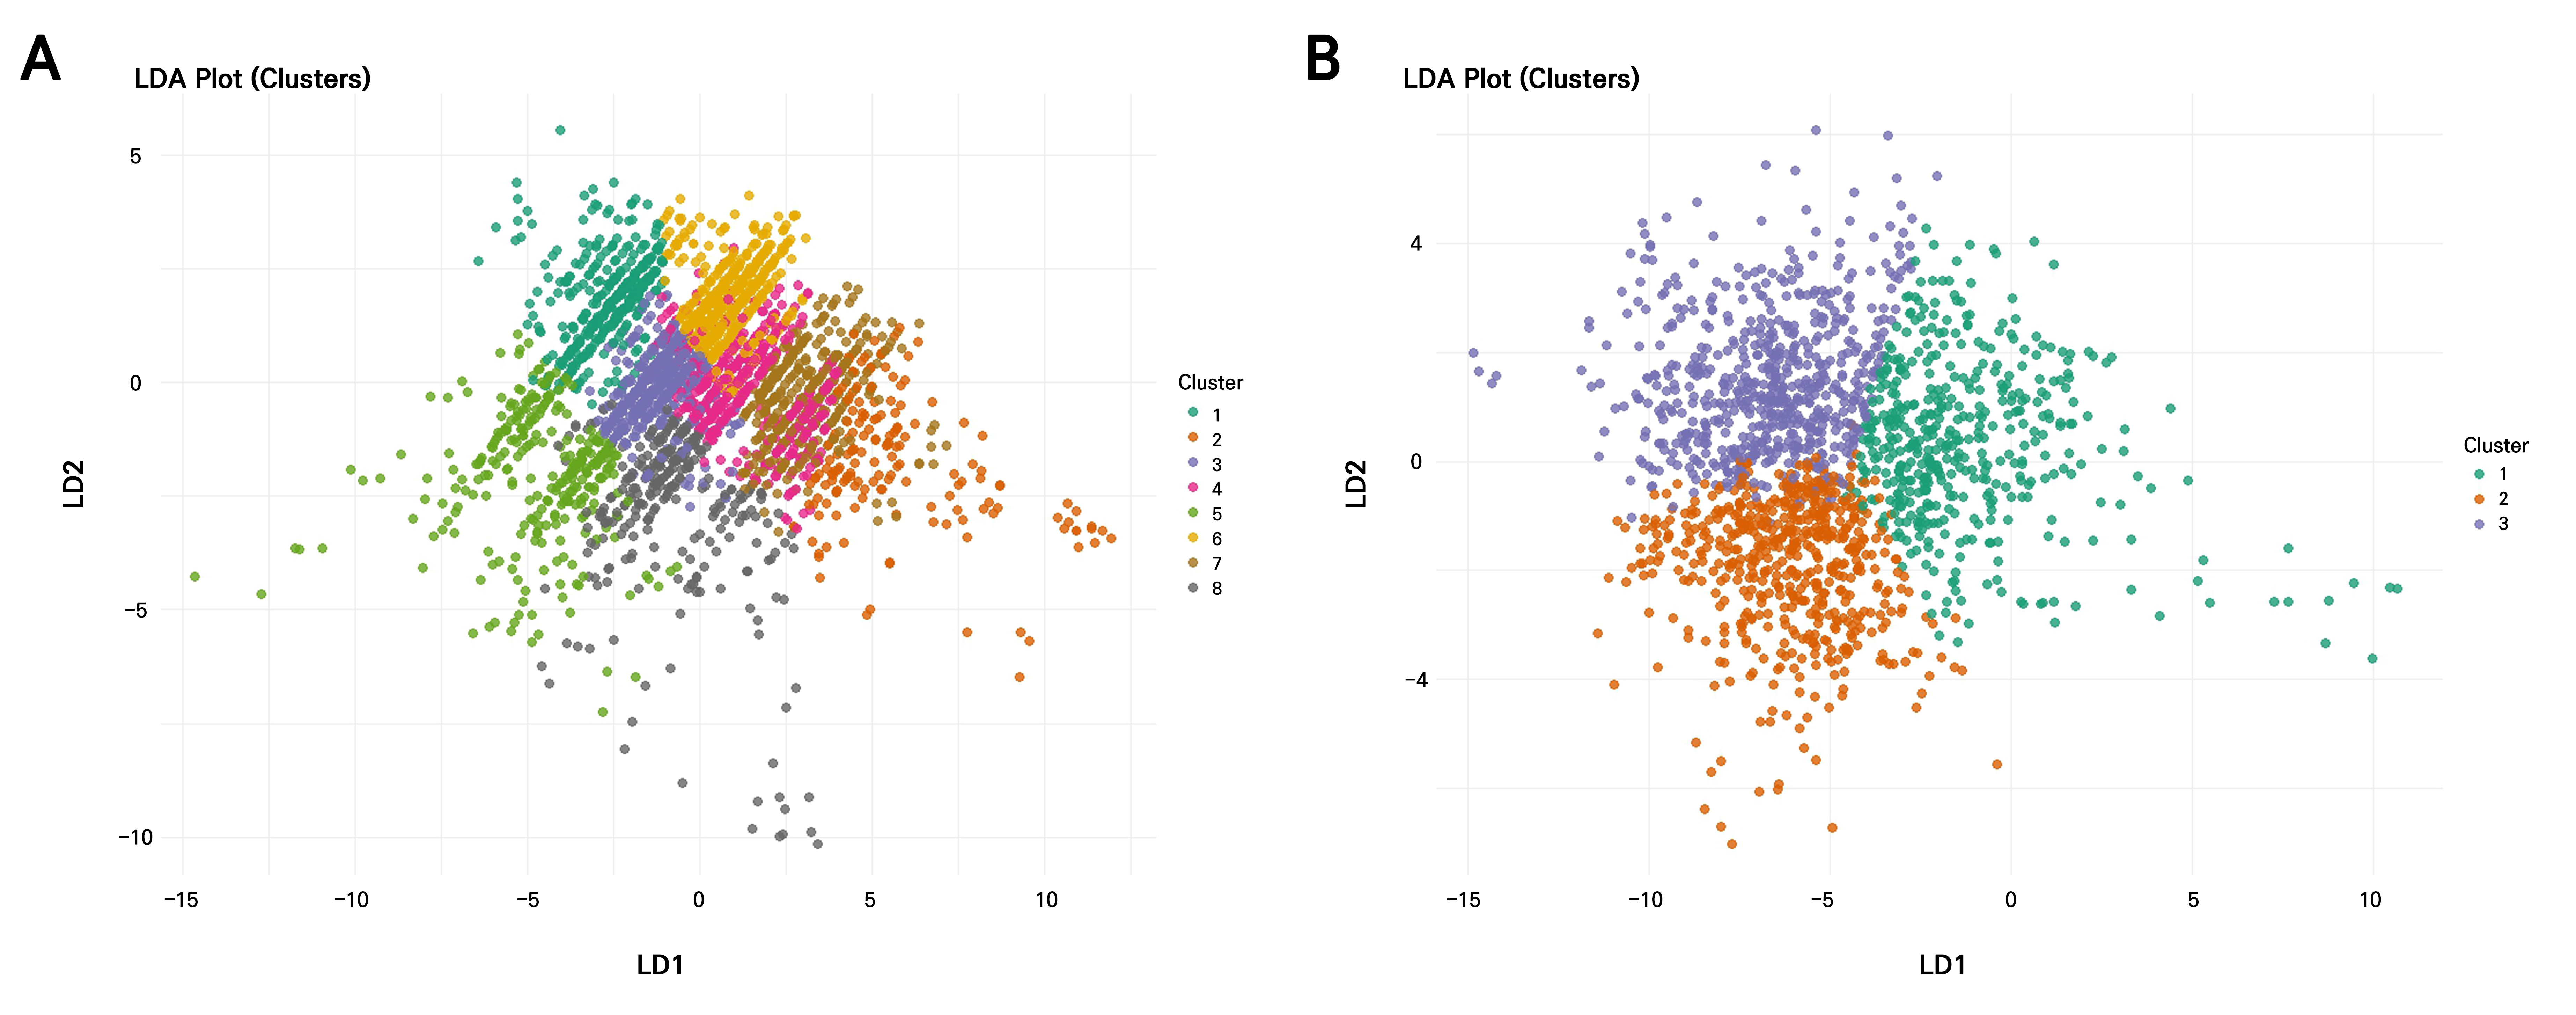
The LDA models showed very low classification performance for both years (Table 5). The overall accuracy rates from the hold-out test were only 7.8% in 2021 and 8.8% in 2022, far below what would be expected by chance when classifying several numbers of clusters. Cross-validation results confirmed this pattern. Leave-one-out cross-validation (LOOCV) produced accuracy rates of 8.9% in 2021 and 11.4% in 2022, while 10-fold cross-validation yielded similarly low rates (8.4% in 2021 and 9.5% in 2022). The corresponding Kappa values (0.078 in 202 and 0.093 in 2022) were close to zero, indicating almost no agreement between predicted and true groups beyond random chance.
Table 5.
Discriminant function coefficients, proportions of trace and performance from the linear discriminant analysis (LDA)
Discussion
This study evaluated whether basic leaf morphometric traits can reliably support the classification of a large collection of C. annuum accessions and whether LDA is an appropriate predictive tool for such datasets. The results strongly support the hypothesis that they do not, as both statistical diagnostics and classification performance outcomes indicated that these traits lack the discriminatory power required for accession-level separation. Despite evaluating over 350 accessions, the models failed to achieve meaningful classification accuracy, indicating substantial overlap in the morphometric trait space among accessions.
The poor performance of LDA can be attributed to strong violations of its underlying assumptions, specifically non-normal trait distributions, covariance heterogeneity, and high multicollinearity among descriptors. Moreover, the large number of classes combined with limited samples per accession contributed to unstable discriminant functions and weak predictive performance (Jensen 2018; Lapanowski and Gaynanova 2020; Gardner-Lubbe 2021; Ali et al. 2022; Qu and Pei 2024). These conditions led to extensive overlap among groups, confirming that the selected traits do not provide a sufficient signal for reliable classification under a linear framework.
From a biological perspective, the limited discriminatory capacity of these traits reflects the inherently conserved and environmentally plastic nature of leaf morphology in C. annuum. Traits such as leaf area, length, width, and perimeter primarily describe vegetative growth and resource acquisition strategies, which are strongly influenced by environmental conditions rather than genotype alone (Marron et al. 2007; Nishani et al. 2025). For instance, larger and broader leaves, as observed in 2021, are typically associated with favorable growing conditions that promote photosynthetic capacity, whereas narrower and more elongated leaves, as observed in 2022, may represent adaptive responses to environmental stress, such as higher temperatures (Fig. 8) or reduced water availability. These environmentally driven responses are consistent with previous findings in Capsicum and other plant species, where the leaf morphology exhibits substantial phenotypic plasticity (Royer 2012; Romero-Higareda et al. 2022).
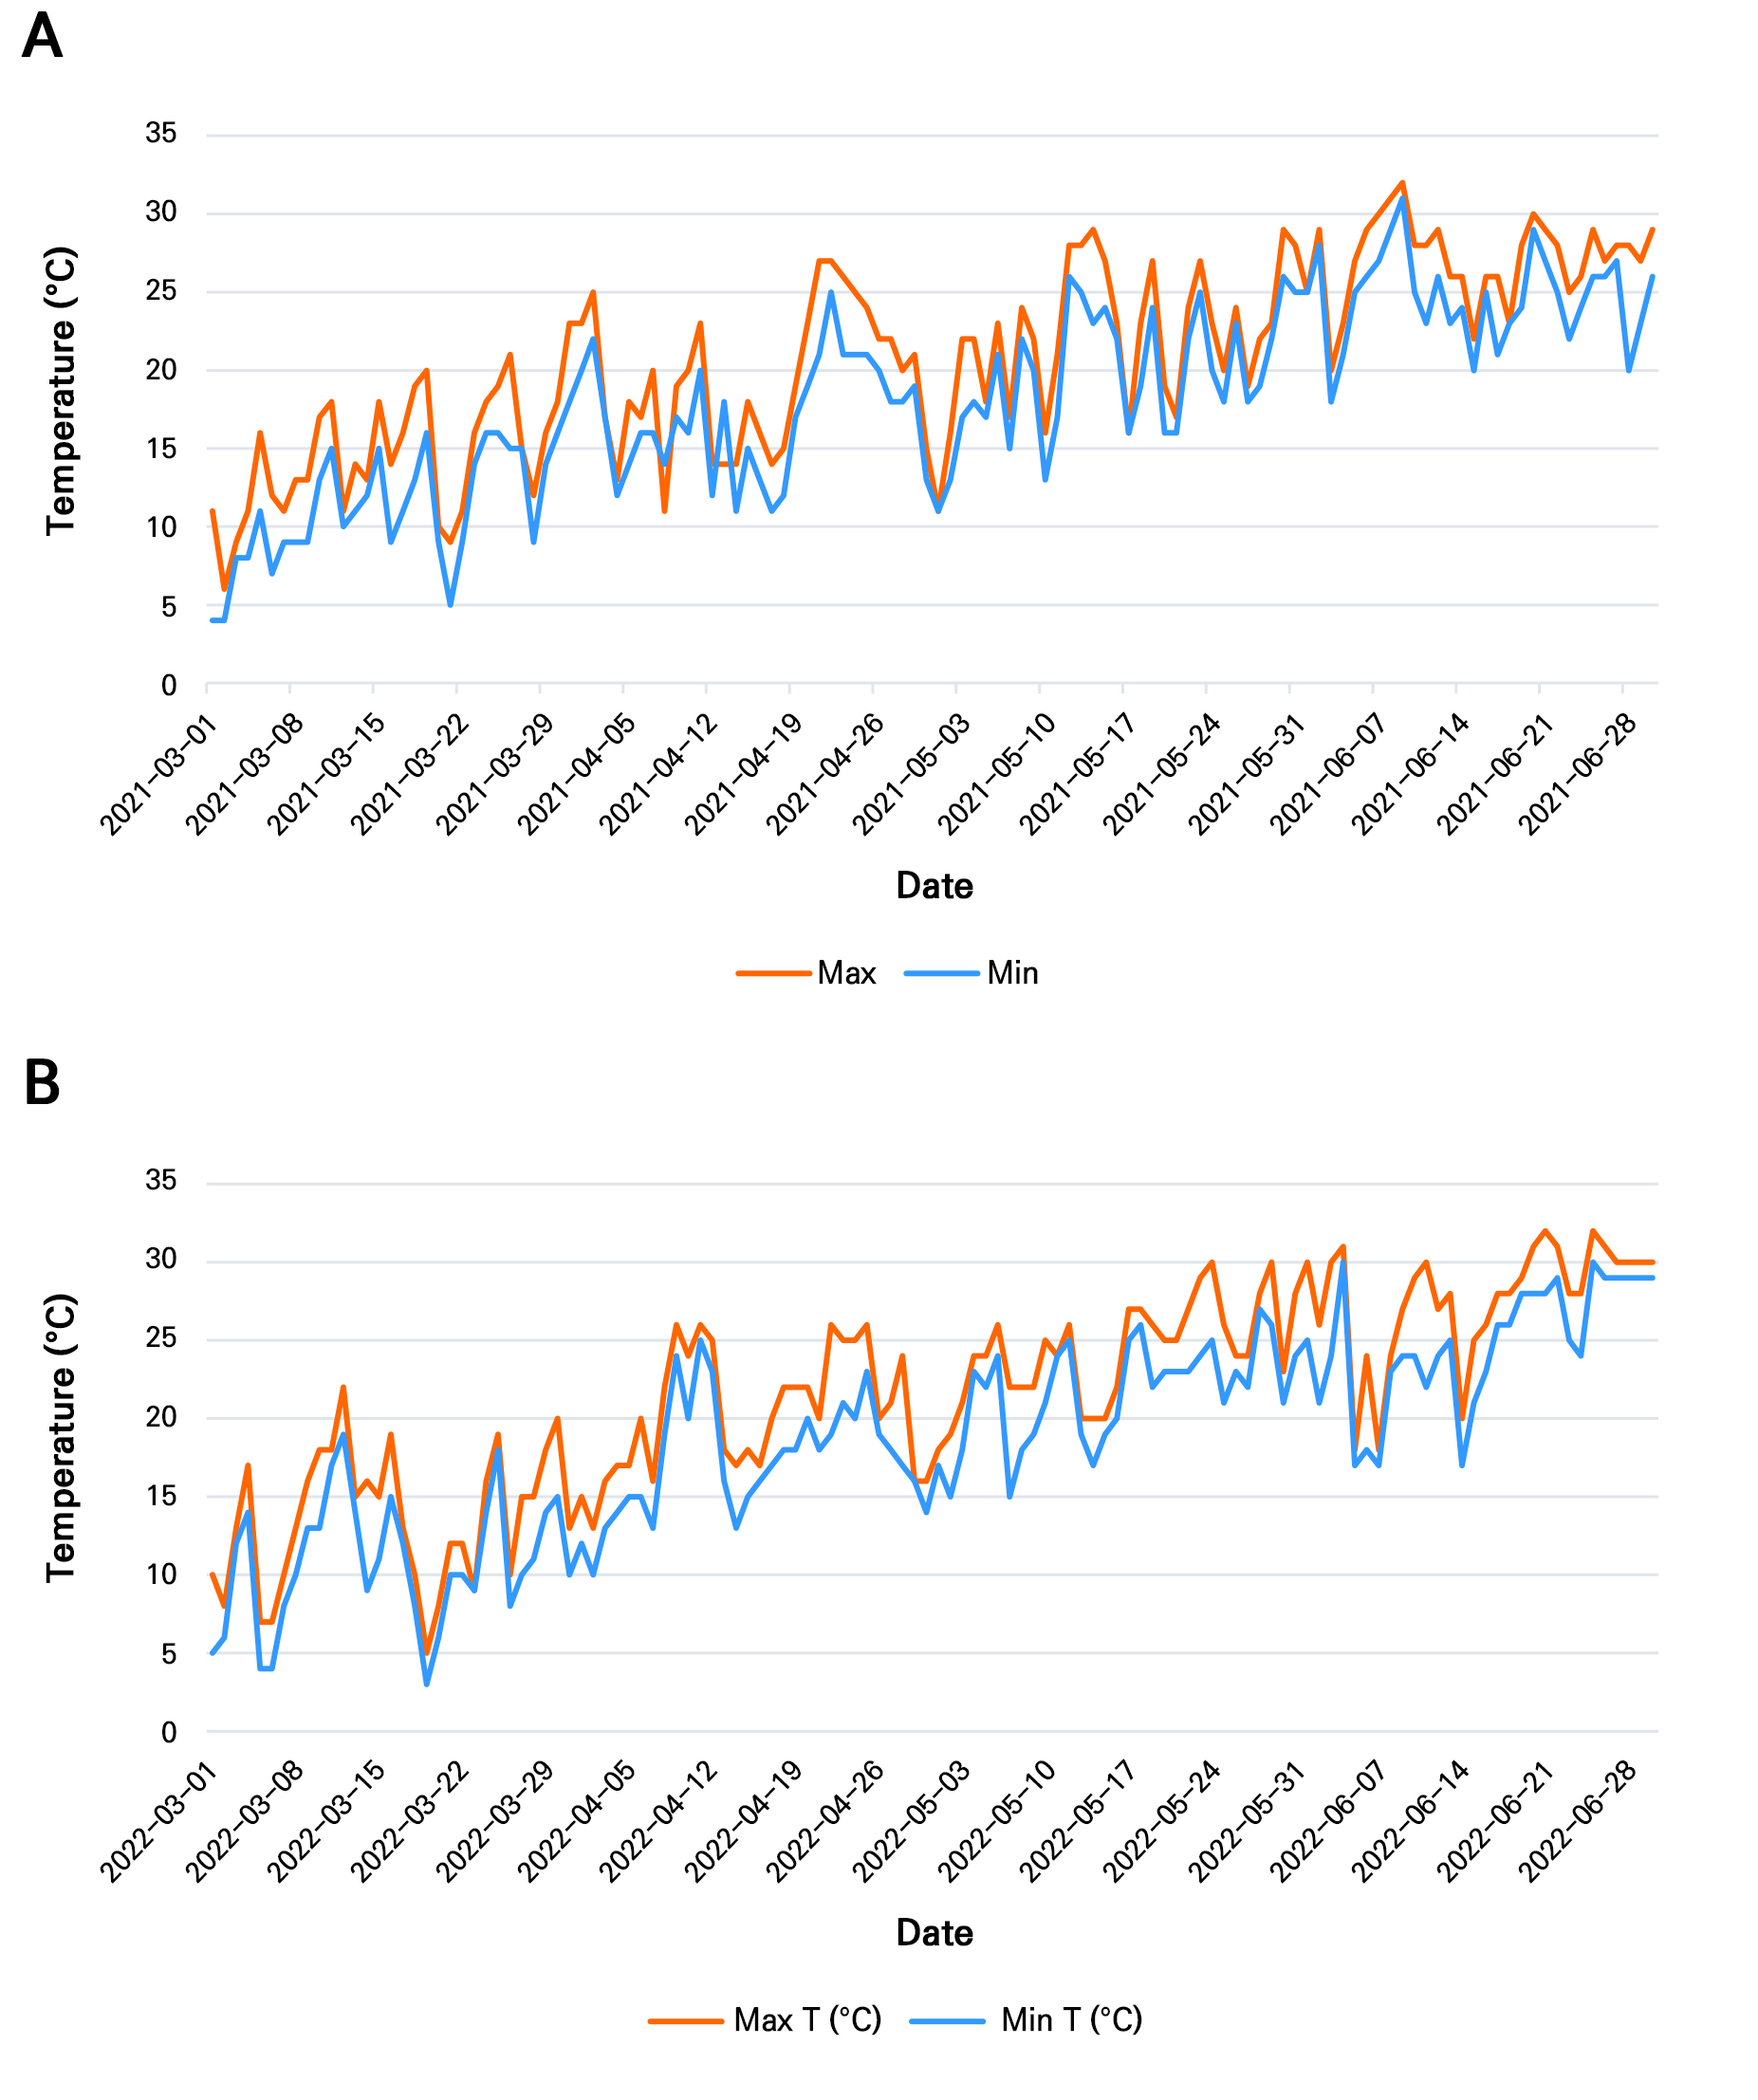
Fig. 8.
Daily maximum and minimum air temperatures (°C) recorded in Jeonju, South Korea (study location) during the chili (Capsicum annuum) growing period from March to June in (A) 2021 and (B) 2022. These data represent environmental conditions during the vegetative and early fruiting stages and provide context for the observed variations in leaf morphological traits (Source: https://www.timeanddate.com/weather/south-korea/jeonju).
The structure revealed by PCA and k-means clustering further supports this interpretation. Variations were primarily organized along axes representing size-related and shape-related traits, reflecting coordinated developmental processes rather than accession-specific differences. The strong multicollinearity observed among size-related traits (area, perimeter, length, and width) indicates a tightly integrated growth module, while shape descriptors such as circularity, roundness, and solidity represent a secondary module associated with leaf geometry. Although the aspect ratio contributed independently to shape variations, the overall morphospace remained highly overlapped among accessions. This suggests that the leaf morphology in C. annuum is governed more by general developmental and environmental gradients than by distinct genetic signatures (Baumgartner et al. 2020; Yang et al. 2025). Moreover, the relatively simple leaf architecture of chili, typically ovate to lanceolate and lacking pronounced lobes or serrations, further constrains the discriminatory potential of basic geometric descriptors (Royer 2012; Idrees et al. 2020; Fanourakis et al. 2021).
From a practical and horticultural perspective, these findings highlight an important limitation for germplasm characterization and breeding applications. Although leaf morphometric traits are easy to measure and well suited for high-throughput phenotyping, they do not adequately capture variations in economically important traits such as fruit morphology, yield, pungency, or resistance to pests and diseases (Poljak et al. 2024; Zhao et al. 2026). These agriculturally valuable characteristics are typically governed by more complex genetic, physiological, and biochemical processes and therefore require integrative phenotyping approaches. Previous studies have consistently demonstrated that fruit traits, biochemical profiles, and genomic markers provide stronger discriminatory power at the cultivar and accession level in Capsicum (Jones et al. 2011; Tripodi and Greco 2018; Alvares Bianchi et al. 2020; Hong et al. 2020; Lozada et al. 2023).
To improve classification performance capabilities, future studies should incorporate phenotypic descriptors with higher resolutions. Advanced morphometric approaches such as elliptic Fourier analysis (EFA) can capture detailed leaf boundary complexities and have been shown to outperform simple geometric traits with regard to cultivar discrimination (Viáfara-Vega et al. 2025). In addition, traits related to the venation architecture, stomatal characteristics, leaf texture, and spectral or colorimetric properties may provide more robust and genotype-specific signals (Chitwood et al. 2014; Thai et al. 2025). These features are increasingly accessible through modern high-throughput phenotyping platforms, including imaging systems and low-cost smartphone-based tools, enabling rapid and nondestructive data acquisition even in large germplasm collections (Tomaszewski and Kołakowski 2023; Park et al. 2025; Thai et al. 2025).
The limitations observed in this study do not invalidate LDA as a classification method but rather emphasize its dependence on an appropriate data structure. LDA remains effective when trait distributions approximate normality, covariance structures are homogeneous, and class boundaries are linearly separable. However, in datasets characterized by high class numbers, limited replication, non-linear trait relationships, and substantial overlap among groups, more flexible classifiers such as random forests, support vector machines, or other non-parametric approaches may yield improved predictive performance (Breiman 2001; Graf et al. 2024; Uniyal 2024). In this study, LDA was intentionally selected as a baseline model to evaluate the intrinsic discriminatory capacity of plant traits under a linear framework.
This study demonstrates that basic leaf morphometric traits are insufficient for reliable accession-level discrimination in C. annuum, thereby supporting the initial hypothesis. While these traits effectively describe general patterns of vegetative growth and environmental responses, they lack the specificity required for germplasm classification. Consequently, reliance on simple leaf descriptors alone in high-throughput phenotyping pipelines may lead to limited or misleading classification outcomes. Future research should integrate detailed morphological, physiological, and genomic data to enhance discriminatory power and improve the effectiveness of phenotyping approaches for better breeding and germplasm management.
