

Introduction
Materials and Methods
Plant Growing Conditions
Leaf Samples
Determination of Leaf Areas
Determination of Carbohydrates in Fruit
Fruit Weight and Soluble Solid Content
Photosynthesis Rate and Leaf Water Potential
Scanning Electron Microscope (SEM) Analysis
Statistical Analyses
Results
Plant Growth
Photosynthesis and Leaf Water Potential
Fruit Growth and Soluble Solid Content
Sugar Accumulation in Leaf and Fruit
Scanning Electronic Microscope (SEM) Image of Fruit Flesh
Discussion
Introduction
The cultural practice of removing the secondary-lateral branches in watermelon production is used to increase marketable fruit production by reducing wilt symptoms (Chang et al., 2004), and to optimize assimilate translocation to fruit (Kato et al., 1984). However, removal of the secondary-lateral branches of watermelon requires intensive input of human labor. Many studies have shown a close relationship between source biomass (i.e. leaves) and fruit yield. Ramirez et al. (1988) reported that removing more leaves significantly affected cucumber yield, while increased leaf numbers had a positive effect on the fruit growth of watermelon (Kato et al., 1984). A lower source-sink ratio also stimulates development of larger tomato fruits (Heuvelink and Buiskool, 1995). In addition to yield changes, the translocation pattern of assimilate has been shown to differ depending on the source. Leaves close to the fruit-bearing node are the most important source of assimilates for cucumber fruit (Murakami et al., 1982) and watermelon fruit (Lee et al., 2005). Alteration in source availability from early growth stages may result in a change in the number of fruit set and biomass per fruit, with no change in sugar content (Hubbard et al., 1990). However, Hubbard et al. (1990) reported that when 50% of plant leaves were removed 28 days before harvest, a significant reduction in the soluble solid content of fruit was observed. Our previous study examined secondary-lateral branch removal to determine the comparative differences in labor input as well as its impact on plant and fruit growth and fruit sugar accumulation (Choi et al., 2012). The results showed that during the fruit ripening period, younger and developing leaves on secondary-lateral branches had a higher growth rate and higher photosynthetic activity than leaves on lateral branches did. Thus, we postulated that active leaves on the secondary-lateral branches were likely to compete with the fruit as a sink during the fruit growing period, leading to slowed fruit growth. Later, the leaves on the secondary-lateral branch likely become a supportive source of carbon, leading to enhancement of sucrose accumulation in fruit. The present study, therefore, aimed to identify the role of active leaves on the secondary-lateral branches in the sucrose accumulation in fruit.
Materials and Methods
Plant Growing Conditions
Seeds of watermelon cultivar (Citrullus lanatus) ‘Sambok-kkul’(Seminis Korea, Co., Seoul, Korea) were sown on the 18th of June, 2011, and the seedlings were grafted onto rootstock of ‘Daeryeok No. 3’ (Lagenaria siceraria S., Dongbu Hannong, Co., Seoul, Korea). On the 22th of August, 2011, one hundred grafted seedlings were transplanted in each of two furrows mulched with polyethylene film. The plants were spaced at 350 mm intervals in a greenhouse (585 m2, 6.5 m wide × 95 m long) with a height of 2.5 m, located in Jincheon, Chungbuk (lat 36°83′04″N, long 127°56′54″E). An overhead sprinkler irrigation system was used for irrigation. At the six-true-leaf stage, plants were pinched to leave two primary-lateral branches on each plant. Only one pollinated flower was left on each plant. Prior to planting, soil was fertilized with NO3-N (353 mg∙kg-1 ), NH4-N (16.45 mg∙kg-1 ), P2O5 (1,152 mg∙kg-1 ), K (3.27 cmol∙kg-1 ), Ca (12.6 cmol∙kg-1 ), Mg (6.59 cmol∙kg-1 ), organic matter (5.8%), pH (6.8) and EC (3.5 dS∙m-1 ).Greenhouse environmental conditions were recorded every 30 min using an data-logger (ALMEMO-2890-9, AHLBORN GmbH, Germany). The temperatures for 24 h ranged from 19 to 42°C, with an average daily temperature at 27°C; relative humidity ranged from 45 to 100%; CO2 concentration ranged from 350 to 720 μmol∙mol-1 and photosynthetically active radiation (PAR) ranged from 0 to 700 μm m-2∙s-1 .
Secondary-lateral Branch Removal Treatments
This experiment consisted of two treatments (Fig. 1): removal of entire secondary-lateral branches (classified as 2C) and removal of secondary-lateral branches below fruit set node (classified as 2C-1).
Leaf Samples
Three types of leaves were used for analysis: the leaves born on the 5th node below fruit-set on primary-lateral branches (OL), the leaves born on the 5th node above fruit set in primary-lateral branches (EL) and the leaves born on secondary-lateral branches above fruit set (SL) (present only in 2C-1 plants).
Determination of Leaf Areas
Leaf area was calculated by scanning detached leaves (HP Scanjet 5550c, Hewlett Packard, Palo Alto, CA, USA) and analyzing the images with Adobe Photoshop CS (Adobe Systems, Inc., San Jose, CA, USA).
Determination of Carbohydrates in Fruit
Samples (5–10 g) of the center flesh of each fruit were placed in test tubes and kept on dry ice during in-field sampling. The samples were then stored at -20°C until isolation of water soluble carbohydrates. Squeezed fruit juice (8 mL) was centrifuged (15,000 rpm) for 15 min at 2°C. The supernatants were transferred to a new tube and kept on ice prior to filtration through a 0.45 μm nylon filter (Watman®, USA). Sugars were separated in an analytical HPLC system (Ultimate 3000, Dionex, Sunnyvale, CA, USA).
Fruit Weight and Soluble Solid Content
Four fruits from each treatment were randomly chosen to determine fruit weight and soluble solid content. The selected fruits were sliced, and rinds and seeds were removed. Juice was extracted from each fruit, and soluble solids concentration at 20°C was determined using Atago ACT-1 refractometer (Atago Co., Ltd, Tokyo, Japan).
Fig. 1.
The secondary-lateral branch removal treatment applied in horizontally trained watermelon grown at a greenhouse. Plants were trained with two primary-lateral branches after topping the main stem, and treated with either removal of the entire secondary-lateral branch (classified as 2C), or removal of the secondary-lateral branch below fruit set node (classified as 2C-1).
Photosynthesis Rate and Leaf Water Potential
Leaf photosynthesis was measured with an open infrared gas analyzer (model LI-6400, LI-COR Biosciences, Lincoln, Nebraska, USA) equipped with a 250-mm3 leaf chamber. A red-blue LED (light emitting diode) light source (6400-02B Red/ Blue LED) was used to provide 1,500 μmol∙m-2 s-1 of photosynthetically active radiation (PAR). Measurements were conducted at 20°C with natural CO2 condition. Thus, the CO2 efflux rate could be determined in the light (Rl) and in the dark (i.e., dark respiration rate, Rd). The CO2 efflux was measured 5 to 10 times at 30-s intervals. Measurement was repeated 3 times on four leaves randomly selected from 3 individual plants in each treatment.
Leaf water potential (MPa) was measured by a Dewpoint Potential Meter (WP4, Decagon Devices, Pullman, USA). This water potential meter also shows potential force (pF) value, which is defined as the base 10 logarithm of the suction expressed in cm of water, by converting MPa value into pF logarithm that -1 MPa corresponds to pF 4.01. Three leaves were randomly selected from individual plants in each treatment.
Scanning Electron Microscope (SEM) Analysis
For the SEM analysis, fruit flesh discs of approximately 3 × 3 × 1 mm in width, length and height from each treatment were quickly excised with a razor blade. After the samples were fixed in 2.5% of glutaraldehyde for 90 min, they were washed 4 to 5 times with 0.1 M of phosphate buffer (pH 7.2). The samples were dehydrated with 40, 60, 80, 90 and 95% of ethanol (5 min in each), followed by dehydrated with 100% of ethanol for 5, 15 and 30 min. Then the samples were stained with 0.03% of Coriphosphine O for 15 min, and examined using LSM510 (Carl Zeiss, Germany) with Excitation/Emission filter, bandpass 520 – 550 nm.
Statistical Analyses
Data were represented with mean values of 3 replications, and were subjected to analysis of variance using the (SAS Institute, Cary, NC, USA). Significant mean separation was done by Duncan’s multiple range tests.
Results
Plant Growth
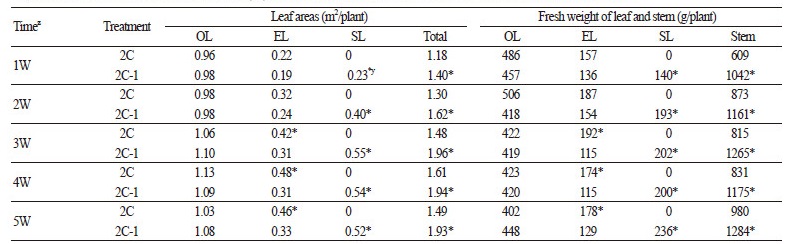
The EL area of the 2C-1 plants was significantly (p < 0.05) smaller than the EL area of the 2C plants; about 26%, 35% and 28% at 3, 4 and 5 weeks after pollination, respectively(Table 1). However, the total area of leaves from both primary- and secondarylateral branches was smaller in the 2C-1 plants than in the 2C plants; about 32%, 21% and 25% at 3, 4 and 5 weeks after pollination, respectively. The fresh weight of the 2C-1 ELs was significantly lower (p < 0.05); about 40%, 34% and 28% at 3, 4 and 5 weeks after pollination, respectively, than that of the 2C plants. However, the total fresh weight of 2C-1 leaves was higher than those under the 2C’s leaves; 20%, 23% and 40% at 3, 4 and 5 weeks after pollination, respectively (due to the leaves on the secondary-lateral branches above fruit set (SL) which were present only on the 2C-1 plants). The fresh weight of stem was higher in the 2C-1 plants; about 46%, on average, during the 5 weeks after pollination.
Photosynthesis and Leaf Water Potential
The EL of the 2C plants and the SL of the 2C-1 plants showed significantly higher photosynthetic activity at 2 weeks after pollination than other leaves; however, at 4 weeks after pollination, the highest photosynthesis activity and lowest water potential were observed in the SL of the 2C-1 treatment (Table 2).
Fruit Growth and Soluble Solid Content
Fruit growth was faster on 2C plants at both 1 and 2 weeks after pollination than it was in 2C-1 plants (Fig. 2A). At 1 week after pollination, the total fresh weights of fruits were 1.86 kg (± 0.05) and 1.41 kg (± 0.17) in the 2C and 2C-1 treatments, respectively. At 2 weeks after pollination, the total fresh weights of fruits were 3.81 kg (± 0.22) and 2.94 kg (± 0.22) in the 2C and 2C-1 treatments, respectively. However, from 3 weeks after pollination on, there was no difference in the total fruit weight between the two treatments.
Soluble solid content (°Brix) was higher in 2C-1 fruit, about 6.43% at 4 weeks and 6.93% at 5 weeks after pollination, respectively (Fig. 2B). At 4 weeks, the soluble solid contents of the 2C fruit was 9.80 (± 0.21) and that of the 2C-1 fruit was 43 (± 0.02). At 5 weeks, the soluble solid contents of the fruits were 10.83 (± 0.13) and 11.58 (± 0.19) respectively.
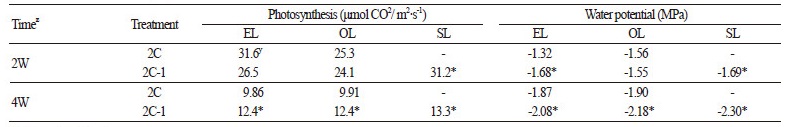
Fig. 2.
Changes in fruit weight (A) and soluble solid content in fruit (B) for 5 weeks after pollination in watermelon ‘Sambok-kkul’. Plants were trained with two primary-lateral branches after topping the main stem, and treated with either removal of the entire secondary-lateral branch (classified as 2C), or removal of the secondary-lateral branch below fruit set node (classified as 2C-1). Values represent mean values of five samples for treatment. Bars represent standard errors of five replications.
Sugar Accumulation in Leaf and Fruit
No major fluctuate changes in OL sucrose content were found in in either treatment, although sucrose accumulation was slightly higher in the 2C treatment at 1 and 2 weeks after pollination (Fig. 3A). However, the EL and SL sucrose content changed markedly during the 5 weeks after pollination. The EL sucrose content in the 2C plants increased from 0.15% (± 0.053) at 1 week after pollination to 0.47% (± 0.046) 2 weeks after pollination, and then dropped to 0.23%, 0.26% and 0.22% at 3, 4, and 5 weeks after pollination, respectively (Fig. 3B). The EL sucrose content in the leaves of the 2C-1 plants was between 0.1 and 0.2 g/100 g leaf dry weight until 4 weeks after pollination; however, and then increased 2 folds between 4 and 5 weeks after pollination. Interestingly, the SL sucrose content in the leaves of 2C-1 plants increased linearly during 5 weeks after pollination; in particular, it increased steeply from 0.39% (± 0.057) at 4 weeks to 0.51% (± 0.036) at 5 weeks after pollination. This 3.9-fold increase in SL sucrose content in the 2C-1 fruit between 4 and 5 weeks after pollination was very different from the 1.4-fold increase in SL sucrose content in the 2C fruit during the same period. No significant differences in glucose and fructose content in either leaves or fruits were noted (data not shown).
Scanning Electronic Microscope (SEM) Image of Fruit Flesh
Microscope images of harvested fruit flesh on harvest showed more cellulose in the 2C fruit than in the 2C-1 fruit (Fig. 4).
Fig. 3.
Changes of sucrose content in leaves (A, B) and fruit (C) for 5 weeks after pollination in watermelon ‘Sambok-kkul’. Values are shown for leaves born on the 5th node below fruit set in primary-lateral branch (classified as OL), leaves born on the 5th node above fruit set in primary-lateral branch (classified as EL) and leaves born on secondary-lateral branches above fruit set (classified as SL) grown under the 2C or 2C-1 treatment during 5 weeks after pollination. Values represent mean values of five samples for treatment. Bars represent standard errors of five replications.
Fig. 4.
Representative SEM image of fruit flesh of watermelon grown under the 2C or 2C-1 treatment at 5 weeks after pollination. The white arrows indicate cellulose content in the fruit flesh.
Discussion
Results from this study show that the removal of secondary-lateral branches below the fruit set node enhance fruit sugar content in watermelon, compared to removing the entire branches. We found a sharp increase in sucrose content in the fullyexpanded SL between 4 and 5 weeks after pollination under the 2C-1 treatment (Figs. 2 and 3), which was related with the highest photosynthetic activity and the lowest water potential in the SL when measured at 4 weeks after pollination, compared to all other leaves (Table 2 and Fig. 3). Interestingly, the enhancement of the sucrose content in the SL between 4 and 5 weeks after pollination coincided with the increase in the EL sucrose content in the 2C-1 treatment, while no significant change was found in the leaves of the 2C treatment. These results indicate that the SL provided assimilates to support the primary-lateral leaves (EL) as well as to contribute to fruit sucrose accumulation. In general, carbon allocation within a plant depends on complex rules linking carbon source organs (mainly leaves) and carbon sink organs (mainly stems, branches, roots and fruits). The complexity comes from regulations due to feedback mechanisms, interactions between different functions, and the spatial distribution of the different plant compartment (Génard et al., 2008). Certain agricultural practices, including pruning and training, can change carbon partitioning within the plant (Lakso and Grappadelli, 1992; Gifford and Evans, 1981). The functional transition, either from sink to source of carbon, or from source to sink, between younger and older leaves may affect the availability of carbohydrates for fruit development and quality, as demonstrated by a study involving radioactive labeling and removal of secondary shoots (Candolfi-Vasconcelos and Koblet, 1990). Active leaves on the secondary-lateral branch seemed to be a competing sink with fruit, which led to a slower fruit growth during fruit development, as shown in both the present study (Fig. 2A) and our previous study (Choi et al., 2012). However, the slower fruit growth caught up around 3 weeks after pollination and there was no difference in final fruit weight between two treatments at 5 weeks after pollination (Fig. 2). Carbon allocation that depended on the different sink strength or sink demand (Lacointe and Minchin, 2000) is therefore not the case for the higher sucrose content in the 2C-1 fruit. While sucrose accumulation in 2C-1 fruit started increasing steeply between 3 and 4 weeks after pollination, levels of glucose and fructose remained steady and those concentrations were the same as that in the 2C treatment. This result suggests that the accumulated sucrose was not synthesized from glucose and fructose available in the fruit, since the levels of those sugars remained constant (Chrost and Schmitz, 1996; McCollum et al., 1988; Hubbard et al., 1989), indicating enhancement of sucrose partitioning toward the fruit.
The more rapid growth rate of the 2C fruit than the 2C-1 fruit during the 2 weeks after pollination and the less crisp flesh of the 2C fruit (no data shown) may be explained by the higher cellulose content in the 2C fruit flesh (Fig. 4). In general, watermelon fruit contains a high percentage (85%, on average) of water, fats and protein in very small amounts, a fair proportion of carbohydrate present as cellulose, starch in small quantity, and higher quantities of sugars (Johnson et al., 2012). During fruit ripening, cell wall polysaccharides are extensively modified by a variety of ripening-related enzymes secreted from the symplast into the cell wall space. These changes affect the structure and strength of the wall, and ultimately bring about fruit softening. During ripening the pectins become increasingly soluble (extractable), and the cell walla swell. Therefore, with overripening (defined as a stage starting 2–7 days after ripeness), proportionally greater quantities of low-molecular size polymers are evident (Elkashif and Huber, 1988). These large branched pectic polysaccharides are intimately associated with the cellulose fibrils (Redgwell et al., 1992).
Taken together, these results indicate that, over the fruit-ripening period, the leaves on the secondary-lateral branch below the fruit-node are likely to be a supportive source, leading to enhancement of sucrose accumulation in fruit. Applying the cultural practice of partial branch removal should contribute to a farmer’s income by reducing labor costs (Choi et al., 2012) and improving fruit quality without compromising fruit yield.
