

Introduction
Materials and Methods
Plant Materials and Growth Conditions
Measurement of Plant Growth and Water Content
Electrolyte Leakage and Malondialdehyde and Hydrogen Peroxide Assays
Measurement of Oxygen Radical-scavenging Capacity
Enzymatic Antioxidant Assays
Statistical Analysis
Results and Discussion
Introduction
Turfgrass is a unique group of plant species cultivated for ornamental decoration, the embellishment of golf courses and sports fields, and land coverage (Chen et al., 2009). However, turfgrass is not purely ornamental; it has been used to improve and protect the environment from changes wrought by the growing economy. Investigating the effect of drought stress on turfgrass related to water saving is warranted because of rapid desertification and the occurrence of droughts caused by climate change and global warming (Shi et al. 2014). Water management is critical to maintaining the quality of turfgrass when water is scarce, which, if not addressed, can limit the extension of turfgrass area and its applications (Beard, 1989; Huang et al., 1997). The availability of water resources for turfgrass can be problematic, especially in some cities in Korea, where serious water scarcity stems from the large amount of water consumed by irrigation (Carrow, 1996). Research into the water use rates of different grass species and methods for improving water use efficiency are increasingly important in the turfgrass industry.
Drought can induce oxidative stress by stimulating the production of active oxygen species (Smirnoff, 1993; Perdomo et al., 1996; Zhang et al., 2005). Various environmental stresses, including drought, impede plant growth by reducing photosynthetic ability and carbon assimilation rate. Reduction of the carbon assimilation rate increases the flow of photosynthetic electrons to oxygen (O2), which exerts oxidative stress on plants by promoting the production of reactive oxygen species (ROS) (Bartosz, 1997). ROS damage proteins, lipids, pigments, and genes if not removed in a timely manner. Thus, most plants possess a mechanism to ameliorate oxidative damage, and produce enzymatic and non-enzymatic molecules (e.g., carotenes, ascorbate, and glutathione; also known as antioxidant molecules) that make up an antioxidant system (Baier and Dietz, 1998).
Under drought stress, hydrogen peroxide (H2O2) is produced by the antioxidant enzyme superoxide dismutase (SOD) as the first line of ROS scavenging; this is then converted into nontoxic water by catalase (CAT) and ascorbate peroxidase (APX) (Fridovich, 1975; Zhu et al., 2004; Shri et al., 2009). The oxidative H2O2 also triggers activation of stress signal transduction pathways (Foyer et al., 1997). Under heat stress, pretreatment with H2O2 regulates antioxidant enzyme activity (Uchida et al., 2002; Larkindale and Huang, 2004), enhancing plant survival (Gong et al., 2001). However, whether H2O2 is involved in the physiological responses of turfgrass to drought stress remains unclear.
Despite the increase in the use of turfgrass, it remains unclear whether pretreatment with H2O2 can alleviate the adverse effects of drought on turfgrass growth. Therefore, the objective of this study was to determine the effect of H2O2 pretreatment on the antioxidant responses of warm-season and cool-season turfgrass under drought stress. The results of this study will facilitate the elucidation of the adaptive mechanisms of turfgrass in response to oxidative stress caused by an insufficient water supply.
Materials and Methods
Plant Materials and Growth Conditions
This study was conducted at the Southern Forest Research Center, Korea Forest Research Institution, from February to December 2012. Turfgrasses used in this study were warm-season zoysiagrass (Zoysia japonica Steud, ‘Zenith’) and coolseason Kentucky bluegrass (Poa pratensis L., ‘Midnight’). Approximately 0.13 g of seeds of each cultivar were sown in a sand-filled pot with a diameter of 10.5 cm and a height of 9 cm. The sand was washed with water for 1 week before use. During the 4-week seed germination period, the plant growth chamber was maintained at a constant temperature of 25 ± 1.5°C, 60–80% relative humidity, and 12-hour light/dark conditions with a light intensity of 390 μmol∙m-2∙s-1. Seeds were watered twice per day. Germinated plants were watered twice daily and fertilized once per week with Hoagland’s nutrient solution (Hoagland and Arnon, 1950). During the experiment, the highest and lowest temperatures were 28 ± 1.7°C and 15 ± 1.2°C, respectively. After 110 days of growth, plants were moved to a greenhouse maintained at 25/20°C day/night, 65–75% relative humidity, and a 14-hour light/10-hour dark cycle with a light intensity of 730 μmol∙m-2∙s-1 on a sunny day. Plants were assigned to treatment groups using a completely randomized design with 10 replications per treatment. Groups consisted of one control group (well-watered) and four experimental groups, each exposed to one of four H2O2 levels (0, 50, 100 and 200 mM). Plants were sprayed with 100 mL each per pot at 3-day intervals during the 3-week period after seedling establishment. Plant growth was investigated and analyzed on day 11 after the plants were given no water for 10 days. Each treatment was carried out in quintuplicate.
Measurement of Plant Growth and Water Content
Shoot and root length and fresh weight (FW) and dry weight (DW) of shoots and roots were measured to determine the effect of H2O2 pretreatment on the plants’ responses to drought stress.
To determine water content, the FW of shoots and roots was measured. Samples were dried for 48 hours at 80°C and the DW was determined. Water content was calculated using the following equation:
Water content (%) = (FW-DW)/FW × 100
Electrolyte Leakage and Malondialdehyde and Hydrogen Peroxide Assays
To analyze electrolyte leakage, 0.1 g of fresh leaf sample was immersed in 20 mL of distilled water. The initial measurement of electrical conductivity (electrolyte leakage, EL0) was measured with an electrical conductivity meter (Starter 3000, Ohaus Co. Ltd., New York, USA). The sample was then shaken at 120 rpm for 24 hours using an agitator and extracted, followed by a second measurement of electrical conductivity (EL24). The sample was then extracted for 24 hours in an 80°C water bath, followed by a third measurement of electrical conductivity (ELt). The electrolyte leakage value was obtained using the following equation:
EL (%) = (EL24 - EL0) / (ELt - EL0) × 100
Membrane lipid oxidation was assayed by measuring the concentration of malondialdehyde (MDA), a product of unsaturated fatty acid decomposition. To measure MDA concentration, 0.2 g of fresh leaf sample was homogenized in 5 mL of 5% trichloroacetic acid (TCA) solvent, and centrifuged (12,000 ×g) at 4°C for 20 min using the method published by Heath and Pacher (1968). Two milliliters of 0.6% thiobarbituric acid (TBA) solvent was added to 2 mL of supernatant, followed by incubation in an 80°C water bath for 15 min. The extracted solvent was then centrifuged (12,000 ×g) at 4°C for 10 min, and the absorbance values at wavelengths of 450, 532, and 600 nm were measured using a spectrophotometer (UV-1800, Shimadzu, Tokyo, Japan). MDA concentration was determined by the following equation:
MDA (nmol·L-1) = 6.45 (A532 - A600) - 0.56 A450
To determine the concentration of H2O2, 0.3 g of fresh leaf sample was homogenized in 0.1% TCA solvent and centrifuged (12,000 ×g) at 4°C for 15 min using the method reported by Velikova et al. (2000) Five-hundred microliters of 10 mM potassium phosphate buffer (pH 7.0) and 1.0 mL of 1.0 mM potassium iodide solution were added to 0.5 mL of supernatant, and the absorbance at a wavelength of 390 nm was measured using a spectrophotometer. The H202 concentration was calculated using a standard curve.
Measurement of Oxygen Radical-scavenging Capacity
An electron donating ability (EDA) test using α,α-diphenyl-β-picrylhydrazyl (DPPH; Sigma-Aldrich Chemical Co., St. Louis, USA) was performed to evaluate the antioxidant capacity of the extracts (Blios, 1958). Briefly, 16 mg DPPH reagent was dissolved in 100 mL of 100% ethanol to yield a 4×10⁻⁴ M DPPH solution. The absorbance at 525 nm of a blank ethanol solution was adjusted to 0.95–0.99. Extraction of 0.3 g of fresh leaf sample was carried out with 3 mL of ethanol and 0.2 mL of the supernatant, and the extract was mixed with 0.8 mL DPPH. The reaction was incubated at room temperature for 10 min. Absorbance at a wavelength of 525 nm was measured using a spectrophotometer. The difference between the absorbance of the group containing the sample and that of the group without the sample was calculated as a percentage to assess EDA using the following equation:
EDA (%) = (1-ABS/ABC) × 100, where ABS is the absorbance of the group containing the sample and ABC is the absorbance of the group without the sample.
Enzymatic Antioxidant Assays
To determine glutathione (GSH) concentrations, 0.3 g of fresh leaf sample was homogenized in 5% TCA solution using the method published by Guri (1983); the mixture was then centrifuged (12,000 ×g) at 4°C for 20 min. Added to 0.5 mL of supernatant was 0.5 mL of distilled water, 2 mL of 0.2 mM potassium phosphate buffer (pH 7.0), and 0.1 mL of 5,5’-dithiobis (2-nitrobenzoic acid) (DTNB). Absorbance was measured at 412 nm using a spectrophotometer.
Activity levels of the antioxidant enzymes SOD, APX, CAT, and POD were determined using the following methods. For enzyme extraction, 0.5 g fresh leaf tissue was homogenized in a buffer mixture introduced by Shekhawat et al. (2010). The homogenate was centrifuged (5,000 ×g) at 4°C for 20 min, and the supernatant was used for enzyme estimation.
SOD activity was determined by measuring the degree of inhibition of the photochemical reduction of nitro blue tetrazolium (NBT), according to the method of Beauchamp and Fridovich (1971). APX activity was assayed by monitoring the rate of H20-dependent oxidation of ascorbic acid. Detailed methods to create the reaction mixture and estimate the APX oxidation rate are described in a previous report (Chen and Asada, 1989). Using the phosphate buffer mixture, CAT activity was estimated using the method published by Aebi (1974). POD activity was measured by monitoring oxidation of guaiacol in the presence of H2O2 at 436 nm, according to the method of Sadasivam and Manickam (1996).
Statistical Analysis
Experimental treatments were assigned to plants using a completely randomized design. Five out of 10 pots per treatment were randomly selected, and statistical significance of growth and physiological observations was determined by ANOVA using the SAS program (SAS Institute, Cary, NC, USA).
Results and Discussion
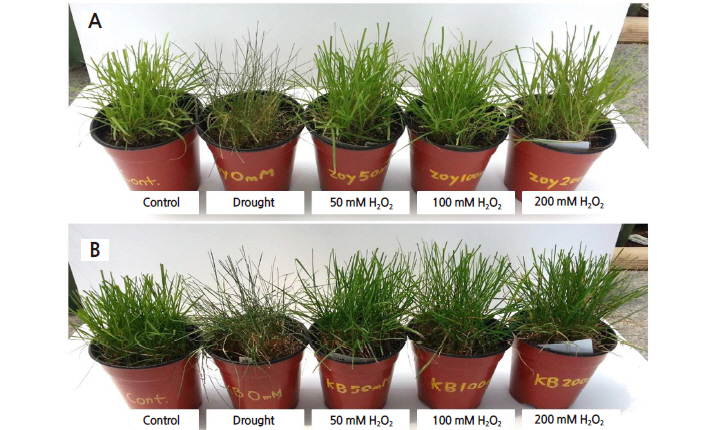
As shown in Table 1, compared with well-watered plants (control), the drought-only treatment with no H2O2 pretreatment resulted in significant decreases in plant height, length of the longest root, fresh weight of shoot and root, dry weight of root, and water content of shoot and root in both warm-season and cool-season turfgrasses (Fig. 1). The growth and development of plants can be severely inhibited under drought stress conditions (Jin et al., 2015); indeed, our study revealed limited turfgrass growth under drought conditions with no H2O2 pretreatment. Our results are consistent with previous findings on the effect of drought, including decreased turfgrass growth of Kentucky bluegrass (Fu and Huang, 2001; Liu et al., 2008), zoysiagrass (Chen et al., 2014), and tall fescue (Fu and Huang, 2001). Water shortage in the soil could reduce the quality of Kentucky bluegrass leaves by causing plant withering (Liu et al., 2008).
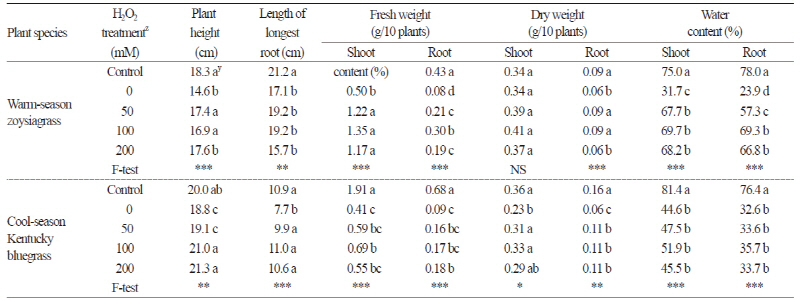
Compared to well-watered controls, drought-treated turfgrasses showed a reduction in growth, but H2O2 pretreatments improved plant height, fresh weight of shoot and root, dry weight of root, and water content of shoot and root in warmseason turfgrass. In cool-season Kentucky bluegrass, H2O2 pretreatments also increased plant height, length of longest root, fresh weight and dry weight, compared to the drought-only treatment with no H2O2 pretreatment. Thus, the growth of plants that underwent H2O2 pretreatments was significantly higher than that of those subjected to the drought-only treatment. These results indicate that H2O2 pretreatments could alleviate the growth inhibition of warm-season and cool-season turfgrasses caused by drought stress.
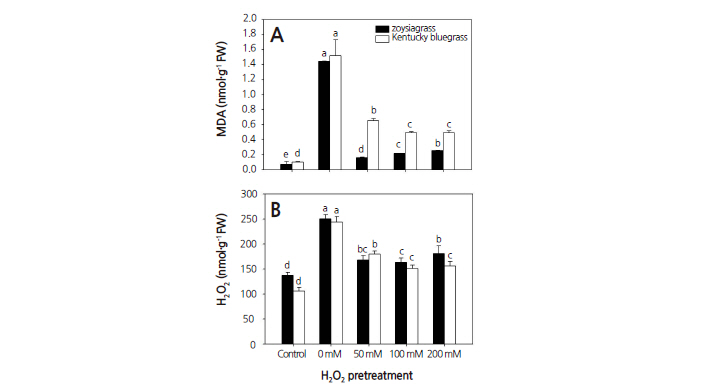
Under drought stress, the drought-only treatment with no H2O2 pretreatment significantly increased MDA concentration in both warm-season and cool-season turfgrasses compared to the control (Fig. 2A). MDA concentration in turfgrass subjected to H2O2 pretreatments was greater than that in the well-watered control, indicating that drought influenced the MDA concentration in both types of turfgrass. MDA concentration in both types of turfgrasses with H2O2 pretreatments showed a tendency to increase, although the amplitude of increase differed. Following pretreatments with 50, 100, and 200 mM H2O2, the MDA concentration in cool-season turfgrass was 4.1, 2.3, and 1.9-fold higher, respectively, than the corresponding MDA concentrations in warm-season turfgrass. By contrast, the H2O2 pretreatments significantly decreased the MDA concentration in both warm-season and cool-season turfgrasses compared to the drought-only treatment. The average decrease in MDA concentration in warm-season turfgrass was 82–89%, and 57–68% in cool-season turfgrass after H2O2 pretreatments. These results suggest that H2O2 treatments before drought stress were more beneficial for warm-season turfgrass than cool-season turfgrass.
Drought stress can induce generation of ROS (Farooq et al., 2009), which can damage cell membranes, thus causing MDA accumulation. MDA is an indicator of the degree of oxidative stress (Gill and Tuteja, 2010). Oxidative stress can promote lipid peroxidation and reduce the quality of Kentucky bluegrass (Zhang et al., 2005). Dryness and high temperature can also lead to an increase in lipid peroxidation and thus MDA concentration (Liu et al., 2008). Degeneration of the cell membrane is one of the physiological responses to drought stress. However, H2O2 pretreatments alleviated MDA production in both warm-season and cool-season turfgrasses under drought stress.
Drought-only treatment with no H2O2 pretreatment resulted in a significant increase in the H2O2 concentration in both warm-season and cool-season turfgrasses compared to the well-watered control (Fig. 2B). Although H2O2 pretreatments increased the concentration of H2O2 compared to the control, the H2O2 concentration showed a tendency to decrease in both warm-season and cool-season turfgrasses compared to the drought-only treatment. H2O2 causes oxidative damage to cells. Excessive accumulation of active oxygen species results in a build-up of toxic substances within the plant; these can oxidize DNA, proteins, and lipids (Fadzilla et al., 1997; Liang et al., 2003). In this study, drought significantly reduced the growth and water content of both warm-season and cool-season turfgrasses. This reduction may be partially caused by increased drought-induced oxidative stress, resulting in increased membrane permeability and MDA and H2O2 concentration. These physiological interferences and visually noticeable disturbances in both warm-season and cool-season turfgrasses can be mitigated by pretreatment with H2O2.
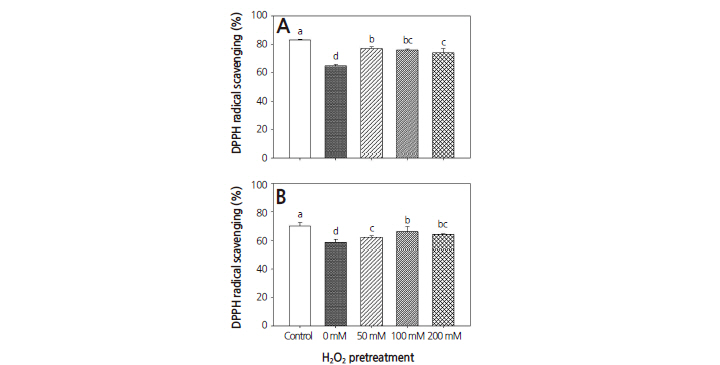
Alteration in the oxygen radical scavenging capacity of warm-season and cool-season turfgrasses was investigated following treatment with drought and H2O2. The oxygen radical scavenging capacity of both turfgrasses was decreased significantly after drought-only treatment. However, pretreatment with 50, 100, and 200 mM H2O2 resulted in an increase in oxygen radical scavenging capacity compared to the drought-only treatment in both warm-season and cool-season turfgrasses (Fig. 3). The radical scavenging response also depends on H2O2 concentrations, which might be associated with a dose effect on the dual roles of H2O2 in plants including a damaging toxic effect at toxic levels, but also a benefit to signal transduction (Dat et al., 2000). According to Rios et al. (2008), enhanced DPPH oxygen radical scavenging capacity is a component of the defense mechanism, together with increased levels of antioxidants, which removes active oxygen species produced by oxidative stress. Therefore, DPPH oxygen radical scavenging capacity can be used to assess the antioxidant capacity of plants, including warm-season or cool-season turfgrasses under drought conditions. Oxidative stress in the form of lipid peroxidation can occur when the scavenging capacity of a plant is overwhelmed by the production of ROS (Fu and Huang, 2001).
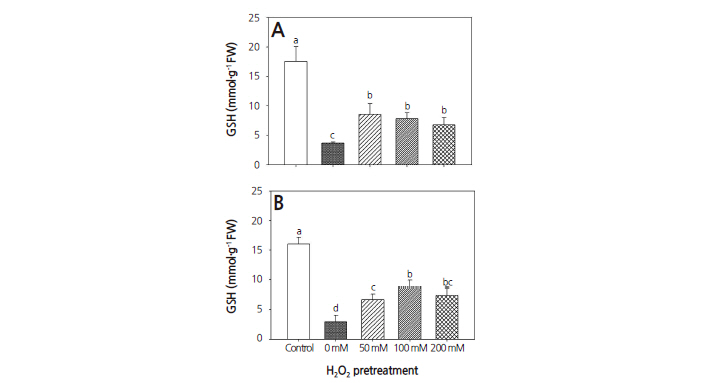
The changes in GSH concentration in both warm-season and cool-season turfgrasses had similar tendencies. The droughtonly treatment resulted in significant decreases in GSH concentration by 79.0 and 81.7%, respectively, compared to the control (Fig. 4). Pretreatments with 50, 100, and 200 mM H2O2 resulted in 51.2, 55.5, and 61.2%, respectively, less increases in GSH concentration in warm-season turfgrass, and 58.2, 45.2 and 53.9%, respectively, in cool-season turfgrass, compared to the control. However, warm-season and cool-season turfgrasses subjected to H2O2 pretreatments had significantly higher GSH concentrations than those that underwent drought-only treatment. Compared to well-watered controls, H2O2 treatment enhanced GSH concentration in both turfgrasses. Most plants possess enzymatic and non-enzymatic antioxidant defense mechanisms to prevent oxidative damage (Baier et al., 1998). Among various non-enzymatic antioxidant defense mechanisms, GSH is known to protect proteins from oxidation (Kranner and Grill, 1996). Reduction in GSH following exposure to drought stress can interfere with metabolic processes such as photosynthetic CO2 assimilation in leaves (Foyer et al., 1995; Noctor et al., 1969).
The drought-only treatment significantly decreased the activity levels of SOD, APX, CAT, and POD in warm-season turfgrass by 45.8, 30.2, 56.4, and 73.0%, respectively, compared to the control (Fig. 5). With pretreatments of 50, 100, and 200 mM H2O2, the activity level of SOD was decreased by 6.7, 32.2, and 40.1%, respectively, and POD activity by 21.1, 14.6, and 42.0%, respectively, compared to the control. However, APX activity was decreased by 18.4% following only the 200 mM H2O2 pretreatment. CAT activity decreased by 29.6 and 38.5% after pretreatment with 50 and 200 mM H2O2, respectively, compared to the control. H2O2 pretreatments resulted in significantly higher CAT activity than the droughtonly treatment.
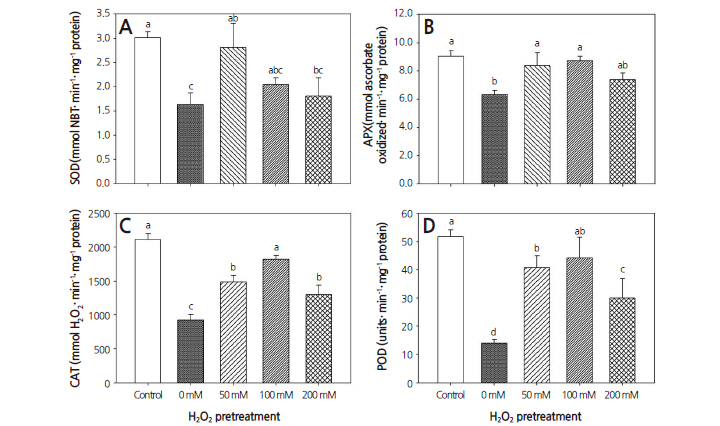
Pretreatment with 50, 100, and 200 mM H2O2 resulted in 72.1, 25.2, and 10.6% increases in SOD activity, respectively, and 32.6, 38.4, and 16.9% increases in APX activity, respectively. Pretreatment with 50, 100, and 200 mM H2O2 resulted in 61.3, 97.5, and 41.0%, increases in CAT activities, respectively, and 192.1, 216.1, and 114.8%, increases in POD activity, respectively, compared to the drought-only treatment. These results indicate that drought reduced SOD, APX, CAT, and POD activities; in contrast, H2O2 pretreatments improved the activities of these enzymes in warm-season turfgrass compared to the drought-only treatment. Comparisons among the three H2O2 pretreatments revealed that the increase in SOD, APX, CAT and POD activity was lowest after 200 mM H2O2 pretreatment.
In cool-season turfgrass, the drought-only treatment significantly decreased the activities of SOD, APX, CAT, and POD activities by 35.2, 50.6, 56.8, and 51.9%, respectively, compared to the control (Fig. 6). The H2O2 pretreatments also resulted in decreased activities of these enzymes compared to the control. After pretreatments with 50, 100, and 200 mM H2O2, SOD activity decreased by 35.2, 24.7, and 17.4%, respectively, compared to the control, and CAT activity decreased by 30.4, 12.8, and 15.6%, respectively. APX activity decreased by 50.7% after the 50 mM H2O2 pretreatment compared to the control. POD activity decreased by 20.1 and 6.0% after 50 and 100 mM H2O2 pretreatments, respectively, compared to the control.
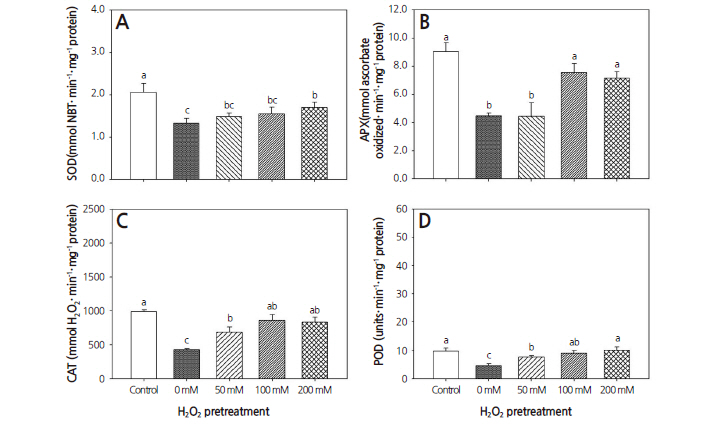
However, there was no significant difference in POD activity between 200 mM H2O2 pretreatment and the control. By contrast, the H2O2 pretreatments resulted in higher POD activity than the drought-only treatment.
After pretreatments with 50, 100, and 200 mM H2O2 followed by drought stress, SOD activity increased by 72.1, 25.2, and 10.6%, respectively, and CAT activity increased by 61.3, 97.5, and 41.0%, respectively. After pretreatments with 50, 100, and 200 mM H2O2, POD activity increased by 192.1, 216.1, and 114.8%, respectively, compared to the drought-only treatment. There was no significant difference in APX activity between the 50 mM H2O2 pretreatment and the drought-only treatment. However, APX activity increased by 68.9 and 60.6%, respectively, after 100 and 200 mM H2O2 pretreatments, compared to the control. These results reveal that drought reduced SOD, APX, CAT, and POD activities, while H2O2pretreatments caused better performance in warm-season and cool-season turfgrasses compared to the drought-only treatment. Comparison of the three H2O2 pretreatments indicated that the increase in SOD, APX, CAT, and POD activity levels was lowest in turfgrass under drought stress pretreated with 50 mM H2O2.
Our results reveal that the activities of SOD, CAT, and POD in cool-season turfgrass were lower than those in warmseason turfgrass; this might be partly associated with greater tolerance to drought or high temperature environments (Nicolas et al., 1984). As the main protective enzymes against drought stress, these enzymes were more sensitive to drought stress. However, H2O2 pretreatment before drought stress increased the resistance of warm-season and cool-season turfgrasses to membrane lipid peroxidation under drought conditions. The pretreated groups were less damaged by ROS than control plants. Exogenous application of H2O2 in several species has been reported to increase plants’ tolerance to oxidation stresses because of enhanced antioxidant activities and reduced membrane lipid peroxidation as a result of the acclimation response (Uchida et al., 2002; Azevedo Neto et al., 2005; Wahid et al., 2007).
However, if H2O2 is not eliminated in a timely manner, oxidative stress can result, leading to membrane lipid peroxidation and damage to the membrane system. Plants possess a mechanism for clearing active oxygen species, of which SOD, CAT, and POD are important components (Reddy et al., 2004). APX activity is increased by exogenous H2O2, but decreased by drought (Gong et al., 2005). Under drought stress, the balance between the production and clearance of active oxygen species in plants is disrupted. In this study, antioxidant enzyme activity in the drought-only treatment was significantly higher than that in the three H2O2 pretreatments. As explained by Azevedo Neto et al. (2005), this is consistent with the finding that H2O2 pretreatment reduces lipid peroxidation of the cell membrane by controlling the toxic O2•− radical, and H2O2 production via SOD under stress. The dismutation of O2•− by the SOD enzyme results in the generation of H2O2 and thus detoxification of the radical. Under stress, H2O2 can rapidly diffuse across membranes or be further degraded by other enzymes to protect cell organelles from the accumulated ROS, which can be explained by higher expression of the genes responsible for the enzyme production (Foyer et al., 1997; Foyer and Noctor, 2000).
These results suggest that exogenous H2O2 could alleviate drought stress in warm-season and cool-season turfgrasses by increasing the activity levels of antioxidant enzymes and decreasing lipid peroxidation. Thus, application of exogenous H2O2 can improve the drought tolerance of both warm-season zoysiagrass and cool-season Kentucky bluegrass under water-deficit conditions.
