

Introduction
Materials and Methods
Plant Materials
Artificial Inoculation of Clubroot Disease
Evaluation of Clubroot Resistance
Preparation of Libraries for Next-Generation Sequencing
Alignment and Detection of SNPs and InDels
Construction of the Phylogenetic Tree
Principal Component Analysis and Population Genetic Structure
Preparation of the CAPS SNP Marker Associated with Clubroot Resistance for Yeoncheon Strain
Results
Genome-Wide Association Study Using the GBS Data
Inoculation of the Yeoncheon Strain Causing Clubroot Disease
Results of Applying the Novel Marker
Comparative Analysis of the Test Results for Novel Marker and Previously Developed Markers
Discussion
Introduction
Kimchi cabbage (Brassica rapa ssp. pekinensis) is the main ingredient of Kimchi and a vegetable
traditionally used in Korea in stews, stir-fried or boiled dishes, and shabu-shabu. In addition, Kimchi is one of the world’s top ten longevity foods, whose nutritional excellence has been recognized, and its demand overseas is increasing.
Clubroot disease occurs over a wide range of domestic and overseas cruciferous vegetables, especially in the regions of domestic Kimchi cabbage cultivation where it disrupts the Kimchi cabbage supply. The Kimchi cabbage clubroot disease is not seasonal and occurs in all parts of the country including the Jeju Island. During an outbreak, the disease reduces the yield by 30-70%, threatening production stability.
Plasmodiophora brassicae is a pathogen that specifically affects cruciferous vegetables. It locally induces the indole-3-acetic acid (IAA) overexpression in the root, causing a nodule to form while in a mutual relationship with the host (Butcher et al., 1976; Dekhuijzen and Overeem, 1971). Glucosinolate is found exclusively in cruciferous vegetables, where it is ultimately converted into IAA during interactions between the myrosinase and nitrilase enzyme systems. Hence, it is regarded as a chemical factor inside the plant body that is involved in the pathogenesis of clubroot disease. The inextricable involvement of glucosinolate in clubroot pathogenesis has been identified in Arabidopsis model plant experiments (Grsic-Rausch et al., 1999, 2000). Analyzing the individual changes in glucosinolate content in the plant body during the pathogenesis of Kimchi cabbage clubroot disease confirmed an excessive increase in the contents of indolic and aliphatic glucosinolates in the root of Kimchi cabbage after inoculation (Ludwig-Müller et al., 1997). The Kimchi cabbage cultivars that are resistant or susceptible to clubroot disease were investigated with respect to the incidence and changes in the contents of indolic and phenyl glucosinolates in the root. Among the glucosinolates isolated from Kimchi cabbage root, glucobrassicin and gluconasturtiin contents had a positive correlation to clubroot incidence, but 4-methoxy- glucobrassicin content had a negative correlation (Lee and Kim, 2010).
Several methods using chemical agents, agricultural pesticides, or antagonistic microbes have been developed for the control of clubroot disease (Datnoff et al., 1987; Cheah et al., 2000; Yeoung et al., 2003); however, as they entail chemical control every cropping season, these methods are costly and require a lot of manpower. Moreover, the effect of the control lasts only during the controlled season, allowing the disease to recur upon successive cropping. Thus, in the long run, it is crucial to develop plant varieties resistant to clubroot disease. Nonetheless, even the resistant cultivars underwent a breakdown of resistance upon successive cultivation over three consecutive seasons. Yoshikawa (1981) reported that, in Japan, more than 50 Kimchi cabbage varieties for clubroot resistance (CR) were developed using the European fodder turnip, and when the resistant Kimchi cabbage varieties were released to the market after cultivation, a strain emerged that could cause clubroot disease in the resistant Kimchi cabbage varieties (Kuginuki et al., 1999; Tanaka et al., 1998). This resulted in most of the CR varieties having a breakdown of resistance, necessitating the development of diverse breeding sources containing different resistance genes to ensure stable annual Kimchi cabbage supply to private companies.
Among cruciferous vegetables, turnips (Brassica rapa L.) frequently exhibit CR. As turnips can be hybridized with Kimchi cabbages, they provide convenient means of introducing the resistance gene to Kimchi cabbage. In addition, cruciferous vegetables can be subjected to microspore culture, which can be used for cultivating the hybridized progeny of resistant turnip and high-quality Kimchi cabbage, and previous studies have shown the development of breeding sources accordingly (Park et al., 2011). The markers reported thus far for detecting Kimchi cabbage clubroot disease include Crr1-associated SSR marker (Suwabe et al., 2006), Crr2-associated SSR marker (Suwabe et al., 2006), Crr3- associated STS marker (Hirai et al., 2004), Crr4-associated RFLP marker (Suwabe et al., 2006), CRa gene-associated RFLP, STS marker (Matsumoto et al., 1998; Matsumoto et al., 2005), CRb-associated SCARmarker (Piao et al., 2004), CRc-associated AFLP marker (Sakamoto et al., 2008), and CRk-associated STS marker (Sakamoto et al., 2008). However, these markers require complicated methods and high-cost devices that restrict their use in small-scale enterprises. In addition, depending on the source, some of the available CR markers cannot be used.
This study applied molecular markers and artificial inoculation of clubroot disease in order to select diverse breeding sources that are resistant to clubroot disease. For the molecular marker analysis, six previously reported markers as well as the novel marker developed using the genome-wide association study (GWAS) based on genotype-by-sequencing (GBS) analysis were used. For the artificial inoculation, regional strains naturally grown at the Vegetable Research Division of the National Institute of Horticultural & Herbal Science (NIHHS) and the Yeoncheon strain obtained from the Korea Research Institute of Chemical Technology (KRICT) were used.
Materials and Methods
Plant Materials
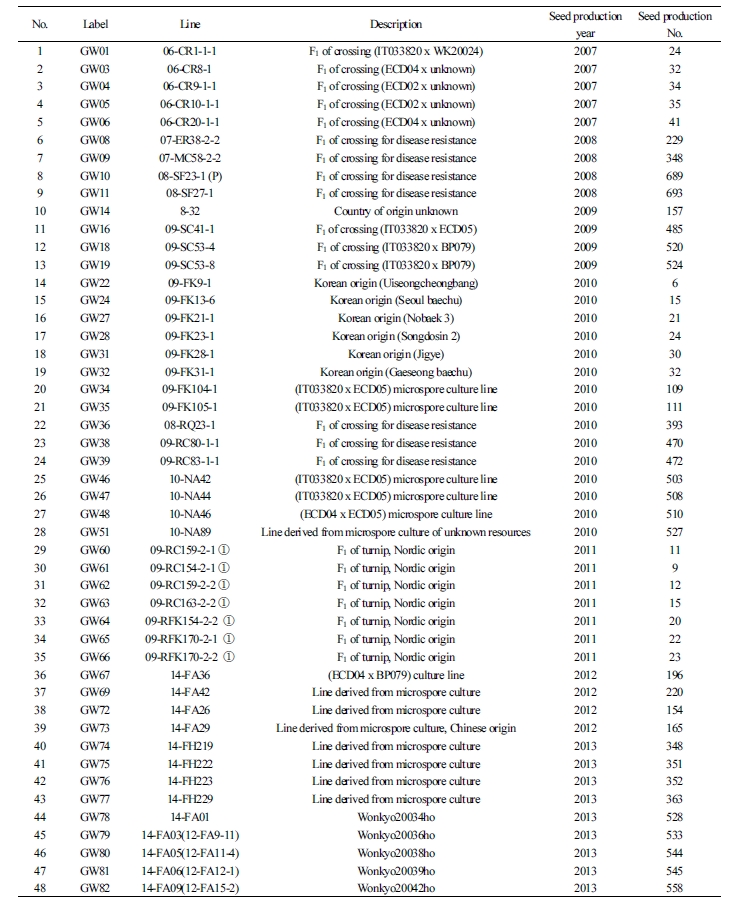
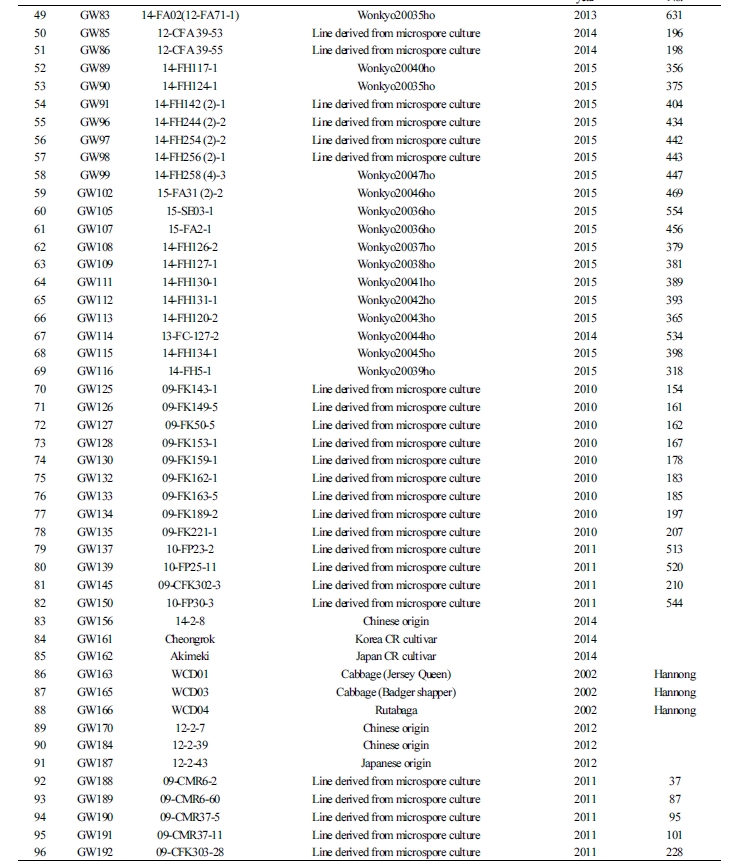
To select various CR genes that are found in Brassicaceae plants, cultivars bred through microspore culture and hybridization, between 2006 and 2016, were used as resources for 96 plants during breeding or introduction. To ensure the selection of a wide variety of resources, primary selection was made among the resources that exhibited resistance to clubroot disease after the artificial inoculation of the regional strains from Pyeongchang-eup or Bangnim-myeon (both in Pyeongchang-gun, Gangwon-do, South Korea) that were naturally grown at the Vegetable Research Division of NIHHS. The 192 selected resources were analyzed using the six previously reported molecular markers [Crr1a (Hatakeyama et al., 2013), Crr2, CRb, CRa, Crr3, and CRc].
The resources selected for the GWAS comprised 96 plants. They included 57 breeding materials that were difficult to analyze using the available molecular markers despite showing resistance to various strains causing clubroot disease in the primary analysis and 39 susceptibility resources, including the Korean commercial cultivar. The selected resources mostly consisted of the breeding sources grown using microspore culture and bud pollination at the Vegetable Research Division of NIHHS and three introduced varieties (Suppl. Table 1).
Artificial Inoculation of Clubroot Disease
For the artificial inoculation of clubroot disease, the soil-drench inoculation method was used. More than 10 seeds of each plant material were seeded on a seed-raising tray (50 holes), and when the cotyledons completely unfolded after 7 to 9 days, the soil-drench inoculum was applied. For the primary selection, the regional strains from Pyeongchang or Bangrhim that were naturally grown at the NIHHS were used. For the GBS analysis, the Yeoncheon strain of race 2, pathotype 3 obtained from the KRICT was used (Kim et al., 2016).
In order to prepare the suspension for inoculation, the inoculum was washed three times with distilled water to remove any foreign substances. Sterilized water was added, and a Waring blender was used for trituration. One double-layer gauze was used for filtration to remove plant tissues. The spore suspension was diluted to more than or equal to 2.5 × 10⁶ mL-1 concentration, and each plant body was given 5 mL for the soil-drench inoculation. Five to six weeks after the inoculation, the roots of the plants were checked for symptoms of the clubroot disease.
Evaluation of Clubroot Resistance
CR was determined by investigating the incidence based on club formation. A scale of five grades was used as criteria: from the plants showing no symptoms to those displaying the most severe symptoms, where grade 0 indicated no symptoms and grade 4 indicated severe symptoms (0 = clubroot disease did not occur; 1 = clubs have formed on the lateral root but they have reached only a slight hypertrophic state and are staying independent of one another; 2 = clubs have formed on the lateral root and they have reached a relatively large hypertrophic state; 3 = clubs have formed on the axial root and they are interconnected and in a considerable hypertrophic state; 4 = clubs have formed on the axial root and they are interconnected and in extremely hypertrophic state) (Kuginuki et al., 1999; Suwabe et al., 2003). The clubroot incidence represented by grades 0 or 1 indicates resistance, grades above 1.0 and below 3.0 indicate intermediate resistance, and grades above or equal to 3.0 indicate susceptibility (Lee et al., 2010; Jo et al., 2011).
Preparation of Libraries for Next-Generation Sequencing
Ninety-six plant materials were used in the GBS analysis conducted by Seeders Inc. After extracting the genomic DNA, ApeKI restriction enzymes were used to treat the DNA, and standard protocols (Elshire et al., 2011) were used to establish the GBS library as follows. The genomic DNA (100 ng·µL-1) of each of the 96 plant materials was treated with 3.6 U of ApeKI (New England Biolabs, Ipswich, MA) at 75°C for approximatively 4 h (20 µL reaction volume), and 200 U T4 DNA ligase was used to attach the adapter containing barcode and a common adapter to the restriction enzyme-treated fragments, after which pooling was carried out for preparing 96 samples. After pooling, the samples were cleaned up using the QIAquick PCR purification kit (Qiagen, Valencia, CA), and PCR was carried out as follows: 2 min at 95°C (one cycle), 30 s at 95°C (16 cycles), 30 s at 62°C, 30 s at 68°C, and 5 min at 68°C. To quantify the established GBS data, a high-susceptibility DNA chip of the Agilent Tape station was used. The Illumina HiSeq 2000 was used for DNA sequence analysis, and prior to further analysis, GBS sequencing data were demultiplexed using the barcode sequence to separate each sample. The resulting demultiplexed final read was 338,111,100. The barcode and adapter sequences were removed from the sequence file of each sample produced by the demultiplexing process of GBS data, and sequence quality trimming was carried out. The Cutadapt program (v.1.8.3) (Martin, 2011) was used for adapter trimming, while DynamicTrim and LengthSort programs of the SolexaQA package (v.1.13) (Cox et al., 2010) were used for sequence quality trimming.
Alignment and Detection of SNPs and InDels
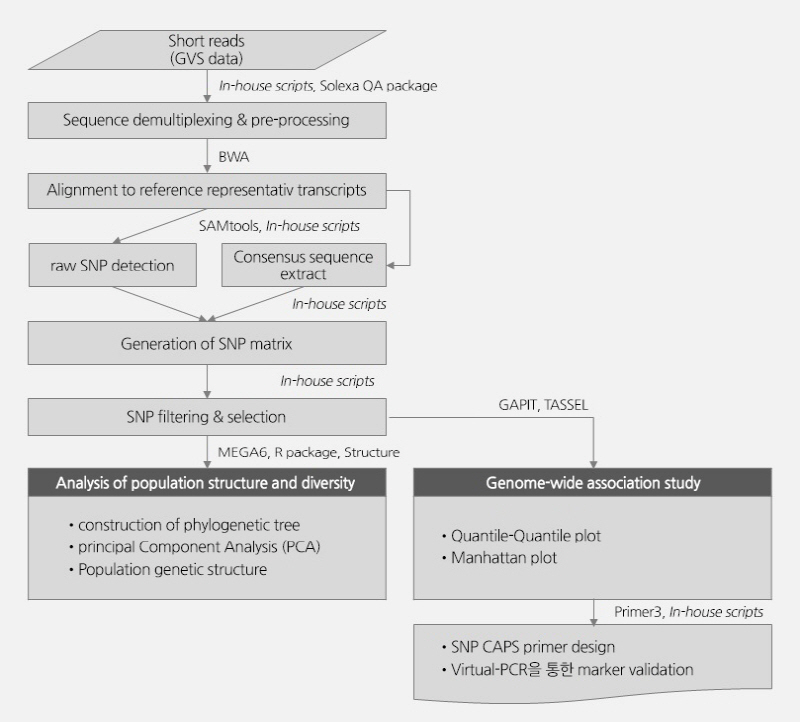
The cleaned reads of each sample obtained from the demultiplexing and sequence quality trimming were mapped against the reference genome using the BWA program (0.6.1-r104), and statistics were extracted. Mapping was performed prior to the detection of raw SNPs (In/Dels) between the reference genome and sequenced samples, through which the SAM format file was drawn. Default values were used, except for the following options: seed length (-l) = 30, maximum differences in the seed (-k) = 1, number of threads (-t) = 32, mismatch penalty (-M) = 6, gap open penalty (-O) = 15, and gap extension penalty (-E) = 8. For the detection of raw SNPs (In/Dels), the SAMtools program (v. 0.1.16) was used for the SAM format file, and the consensus sequence was extracted. Here, prior to the SNP detection, SNP validation was carried out using the SEEDERS in-house script, then the raw SNP (In/Del) detection was carried out with the minimal mapping quality (-Q) = 30, minimum read depths (-d) = 3, and maximum read depths (-D) = 105. Minor allele frequency (MAF) and missing data percentage (%) each were >5% and <30% in SNP matrix filtering result. Using the raw SNP of each sample, the union SNP matrix of the 96 Kimchi cabbage samples was recorded, and the SNPs that passed the filtering criteria were categorized as “Homozygous/Heterozygous/Etc.” For the phylogenetic analysis and allele association analysis of the union SNP matrix of the 96 Kimchi cabbage samples, SNP filtering was carried out. The 20,540 representative SNPs from filtering were used for the phylogenetic tree, principal component analysis (PCA), population structure and lineage, and allele association analysis. All the analyses are represented in a schematic diagram (Suppl. Fig. 1).
Construction of the Phylogenetic Tree
The 20,540 positions of representative SNPs selected by the filtering were analyzed for phylogenetic relationship using the MEGA6 program. The evolutionary history was inferred using the neighbor-joining method. The optimal tree with a sum of branch lengths = 6.34104059 is shown. The percentage of replicate trees in which the associated taxa clustered together in the bootstrap test (1000 replicates) is shown next to the branches. The tree is drawn to scale, with branch lengths in the same units as those of the evolutionary distances used to infer the phylogenetic tree. The evolutionary distances were computed using the Maximum Composite Likelihood method, and the results are shown in units of the number of base substitutions per site. The analysis involved 96 nucleotide sequences. All ambiguous positions were removed for each sequence pair. There were a total of 20,540 positions in the final dataset. Evolutionary analyses were conducted in MEGA6.
Principal Component Analysis and Population Genetic Structure
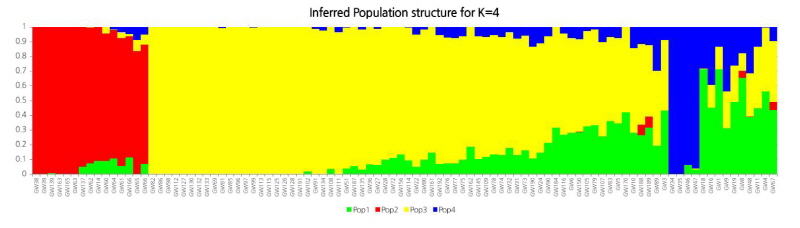
For the PCA of the representative SNPs selected by filtering, the R package SNPRelate (Zheng et al., 2013) was used. The phylogenetic relationship was investigated by mapping the primary and secondary principal components as a plot. The PCA was based on 20,540 SNPs of the 96 Brassica rapa individuals. The top two principal components, PC1 and PC2, explained 31.99% of the genetic variation. The representative SNPs selected by filtering were analyzed for population structure using the STRUCTURE program (v.2.3.4). The Delta-K method (an ad hoc quantity (Δk) described by Evanno et al., 2005) was used to calculate the appropriate K value. After ten repetitions, a peak was detected at K = 3, 4. The Delta-K value was the highest above 4,000 at K = 4. Each color of the population structure indicates a single population, and vertical bars indicate each individual. The colors in each individual show the rate of contribution from the ancestral population per segment.
Preparation of the CAPS SNP Marker Associated with Clubroot Resistance for Yeoncheon Strain
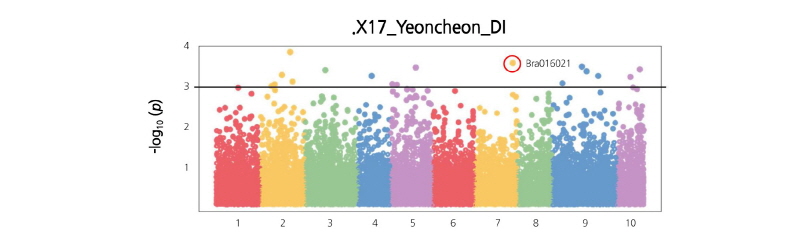
GWAS was performed using the GAPIT program (v. 2.0) (Lipka et al., 2012) for the 20,540 SNP positions and for the allele data based on the incidence after the CR Yeoncheon strain inoculation once it was converted to the form suitable for analysis. Nine primer combinations and restriction enzymes were selected via GWAS, and a preliminary study was carried out. For the DNA sample composition, resistance (DS; 1.0) and susceptibility (DS; 5.0) were chosen. Using the selected primer combination (Forward_23098226, 5'-TTCCTCCGCCGACGATTATG-3'; Reverse_23098858, 5'-ATCCGCACTTCATGACACGT-3'), an applicability test was carried out for the 96 lines and additional resources. The PCR conditions were 40 ng template DNA, 0.4 µM primer, 20 µL total volume, and commercial PCR premix (Onsol, Cat. No. OSP10030096). The device (Bioer, Life echo) was set for the following reaction conditions: 95°C; 3 min [95°C; 10 s, 60°C; 30 s, 72°C; 30 s] 35 cycles, 72°C; 5 min. The conditions for restriction enzyme treatment after the amplification were 20 µL PCR products, 5 U restriction enzyme (Taq I ), 1× reaction buffer, and total volume of 30 µL. Following the treatment at 37°C for over 2 h, 1.5% agarose gel was used for electrophoresis to separate the band patterns. To verify the determination of CAPS markers, an applicability test was carried out at the Taq I position using a newly prepared primer (forward, 5'-atcgcatgaagttgggagct-3'; reverse, 5'-ttctctacacggtggtgcttct-3').
Results
Genome-Wide Association Study Using the GBS Data
The 96 samples of Kimchi cabbages and turnips that exhibited resistance to various regional strains causing clubroot disease were analyzed by GBS, and their sequence read data were obtained. The obtained Kimchi cabbage GBS reads were mapped against the reference genome to search genome-wide single nucleotide polymorphisms (SNPs) and analyze the phylogenetic relationship. The Kimchi cabbage genome from the Brassica database (BRAD) was used for the reference genome and template information. The base sequence was 284,855,373 bp, the number of transcripts was 41,020, and the total base sequence of the transcriptome was 82,798,001 bp. Among the reads against the reference genome and organized after the alignment, 65.46% were mapped. The total number of reads for the 96 Kimchi cabbage samples was 338,111,100, and the total length of the base sequence of the reads was 34,149,221,100 bp. The proportion of the final reads after checking the barcode sequence and the restriction sites was 91.21% compared to the raw reads. A total of 308,157,402 trimmed reads was used in the analysis. As a result, 547,297 SNPs were detected, and 20,540 SNPs were finally selected by filtering (Suppl. Fig. 2). From the search for the templates of the selected 20,540 SNPs, 3,935 transcripts were found. Targeting the polymorphic SNP positions among the compared samples, the cleaved amplified polymorphic sequence (CAPS) SNP markers were developed. To analyze the phylogenetic relationship among the 96 selected samples, 20,540 representative SNPs selected by filtering were used, and phylogenetic analysis was carried out. The results separated the 96 Kimchi cabbage resources into four broad populations: ten resources were categorized in population 1, fifteen in population 2, sixty-seven in population 3, and four in population 4. The hybridized progenies of resistance resources were mostly distributed in population 1, while population 2 mostly contained the progeny resource of Nordic turnips. Population 3 mostly contained the cultivars grown at the Vegetable Research Division of NIHHS and the microspore culture lines. The four resistance resources selected after the microspore culture of the hybridized progeny of the turnip resistance resources “IT033820” and “ECD05” belonged to population 4 (Figs. 1-3). The p-value calculated from the association analysis was visualized using Manhattan plots (Fig. 4). Using the information of candidate SNPs obtained from GWAS, the CAPS markers were designed. Filtering criteria for GWAS was -log(P) ≥ 3, and from the resulting nineteen candidate SNPs for allele association, eleven were selected after the ANOVA test with p-value < 0.05. Finally, nine CAPS markers were prepared.
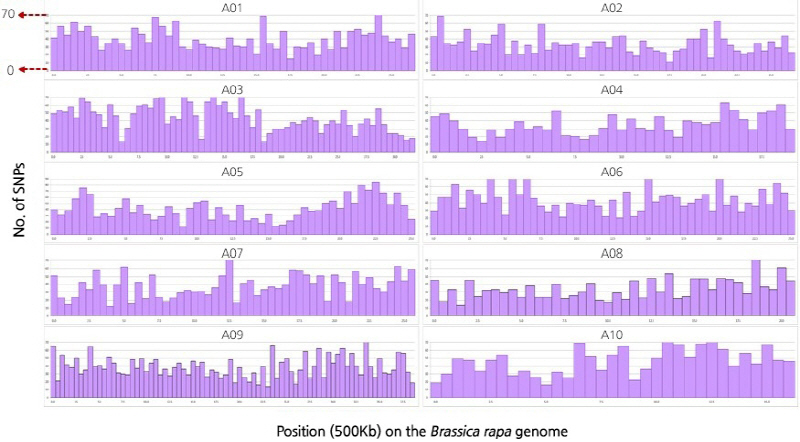
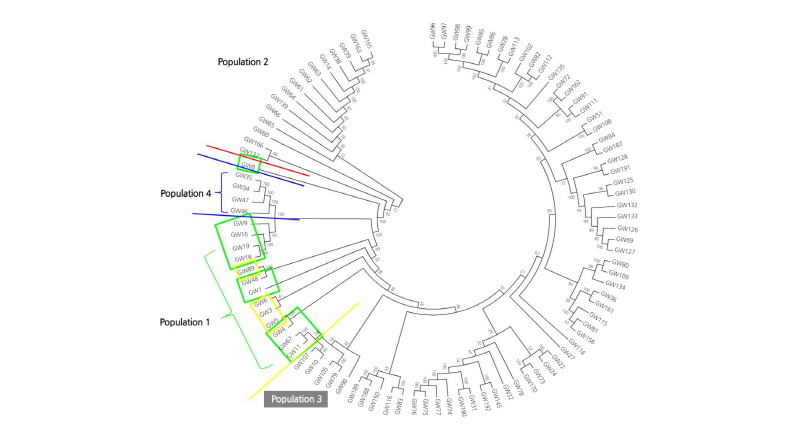
Fig. 1. Phylogenetic tree using 20,540 SNPs of 96 Kimchi cabbage samples. The tree was constructed by the neighbor- joining method (1,000 bootstraps). Bootstrap values (as percentages) are shown at internal nodes. The scale bar indicates the proportion of sites changing along each branch. Colors represent populations from different breeding materials (green = population 1, red = population 2, yellow = population 3, and blue = population 4).
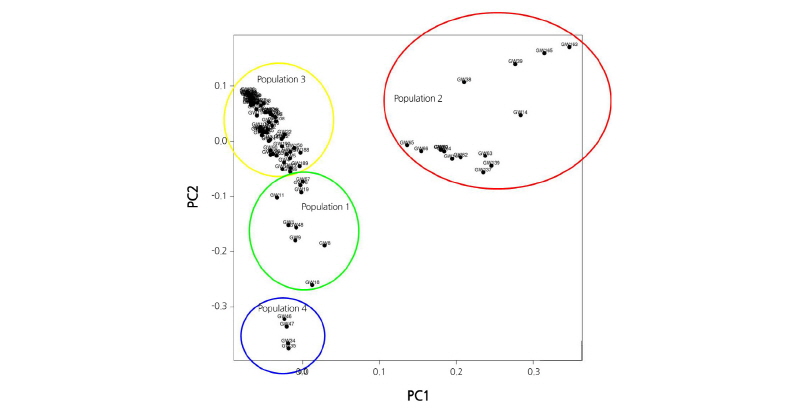
Fig. 2. Principal component analysis (PCA) plot using 20,540 SNPs of 96 Kimchi cabbage samples. The plot shows four clusters in leaves of plants. PCA loading plots for the four population components are shown. Colors represent populations from different breeding materials (green = population 1, red = population 2, yellow = population 3, and blue = population 4).
Inoculation of the Yeoncheon Strain Causing Clubroot Disease
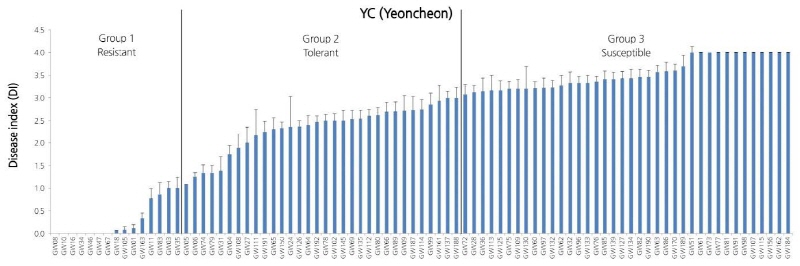
Artificial inoculation of the Yeoncheon strain causing clubroot disease (Kim et al., 2016) resulted in 85 plants (excluding the eleven that withered during inoculation) displaying patterns that went from resistance, to intermediate resistance, to susceptibility. Fifteen were resistance resources, thirty-one were intermediate resistance resources, and the remaining thirty-nine were determined as susceptibility resources (Suppl. Fig. 3). When the 96 Kimchi cabbage resources were categorized into four populations, the eight plants (excluding the two that withered) in population 1 showed resistance or intermediate resistance following the inoculation of clubroot disease, and the fourteen plants in population 2 (excluding the WCD1 that provided the criteria) showed intermediate resistance or susceptibility. From the 63 plants in population 3 (excluding the four that withered), eleven showed resistance, nineteen intermediate resistance, and thirty-three susceptibility following the inoculation. All four resources in population 4, originating from the microspore culture of the resistance turnip parent IT033820, exhibited strong resistance to the Yeoncheon strain causing clubroot disease.
Results of Applying the Novel Marker
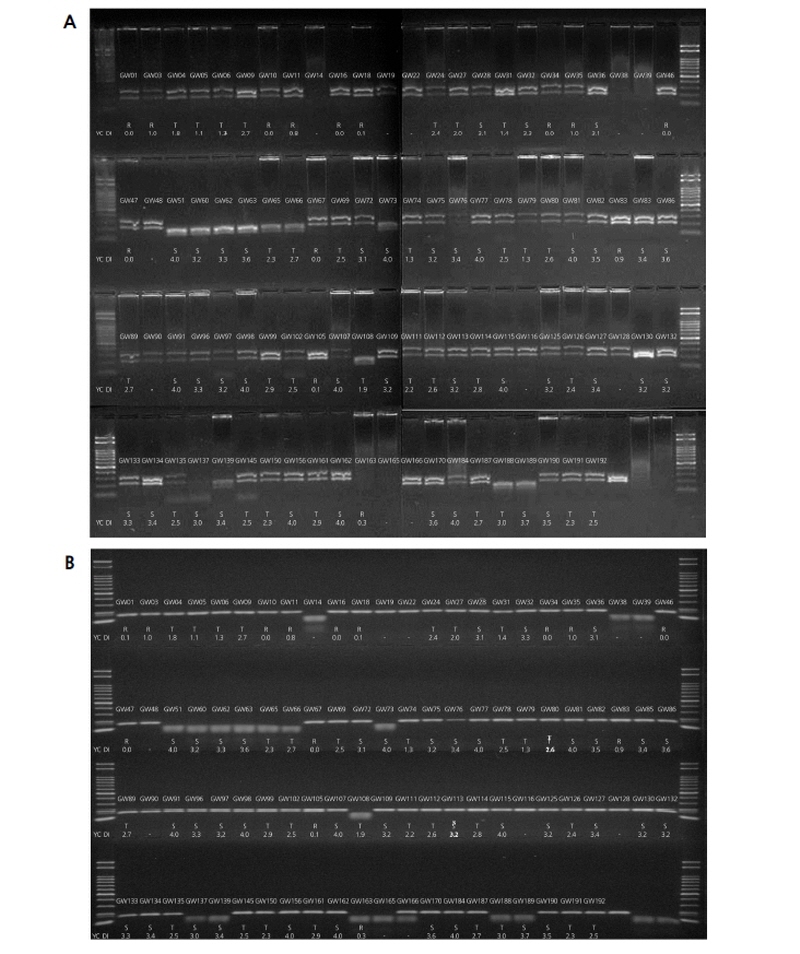
From the GWAS of the 96 selected resources displaying varying patterns of CR, nine CAPS markers were selected, and a preliminary study showed that the CAPS marker prepared based on Bra016021 could discriminate the resistance resources from the susceptibility resources. In order to select the molecular marker that can be used for a wide variety of resources, the nine resources used in GWAS in addition to the seven turnip CR resources obtained from the National Agrobiodiversity Center were used in testing the novel marker, and the results showed a clear discrimination of band patterns between resistance and susceptibility (Fig. 5A). When the selected molecular markers were used to analyze all 96 plants used in GWAS, the phenotype of clubroot disease consistent with the genotype was observed for fourteen resistance resources among the fifteen, except for GW163, which could not be adequately amplified. However, the intermediate resistance resources displayed an uneven phenotype pattern, with the majority of bands showing the pattern for resistance but the GW108 band showing the pattern for susceptibility (Suppl. Fig. 4A).
For the additional test of the selected molecular markers, 23 resources (eleven resistance, six intermediate resistance, and six susceptibility) were selected and analyzed. The results showed a close conformity between phenotype and genotype regarding resistance and susceptibility. In the case of GW81, however, the genotype showed resistance, while the phenotype indicated susceptibility (Fig. 5B). Nevertheless, since the corresponding molecular markers exhibited codominant band patterns, they were evaluated as having a high potential for development and used as a novel marker in the selection of resistance resources. This led to a retest based on the susceptibility of the Taq I position using a newly prepared primer. The results showed the distinction between the phenotype and the genotype concerning clubroot disease (Fig. 5C). When the developed molecular marker was used to analyze the 96 samples, clear discrimination between resistance and susceptibility was confirmed, and heterotype bands such as GW166 were observed (Suppl. Fig. 4B). The patterns for resistance bands GW10, GW16, GW34, GW46, GW47, and GW67 and susceptibility bands GW51, GW60, GW62, GW63, GW65, and GW66 could be clearly differentiated. Thus, the corresponding primer was determined to be a candidate for a novel marker that can be used alongside the available markers for selecting the resources resistant to the Yeoncheon strain.
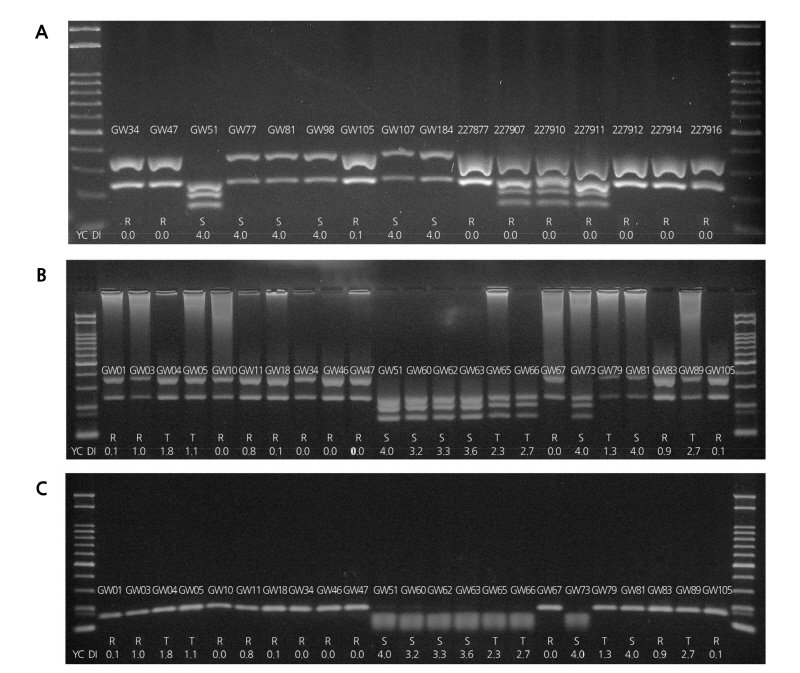
Fig. 5. PCR results using selected CAPS markers developed from Bra016021. A, PCR results of nine Kimchi cabbage and seven turnip breeding materials showing different phenotypes B, Adaption of the original marker on 23 plant materials. C, PCR results of the same 23 plant materials using an adjusted marker.
Comparative Analysis of the Test Results for Novel Marker and Previously Developed Markers
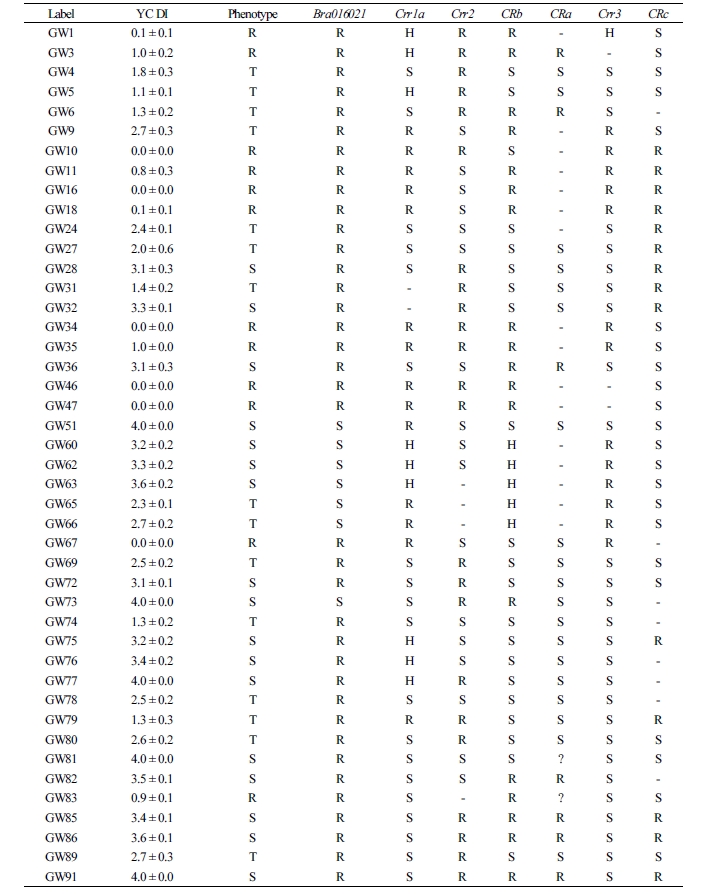
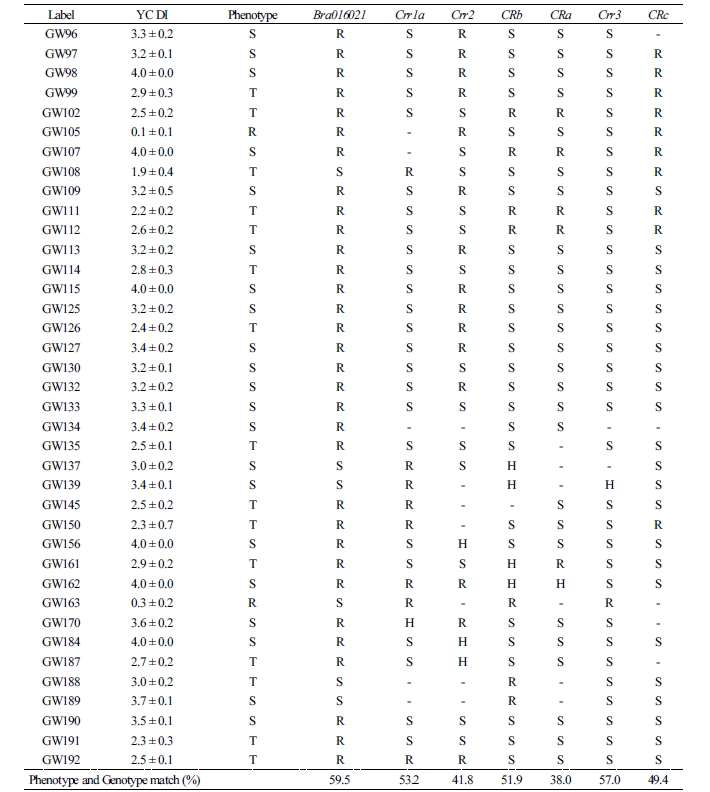
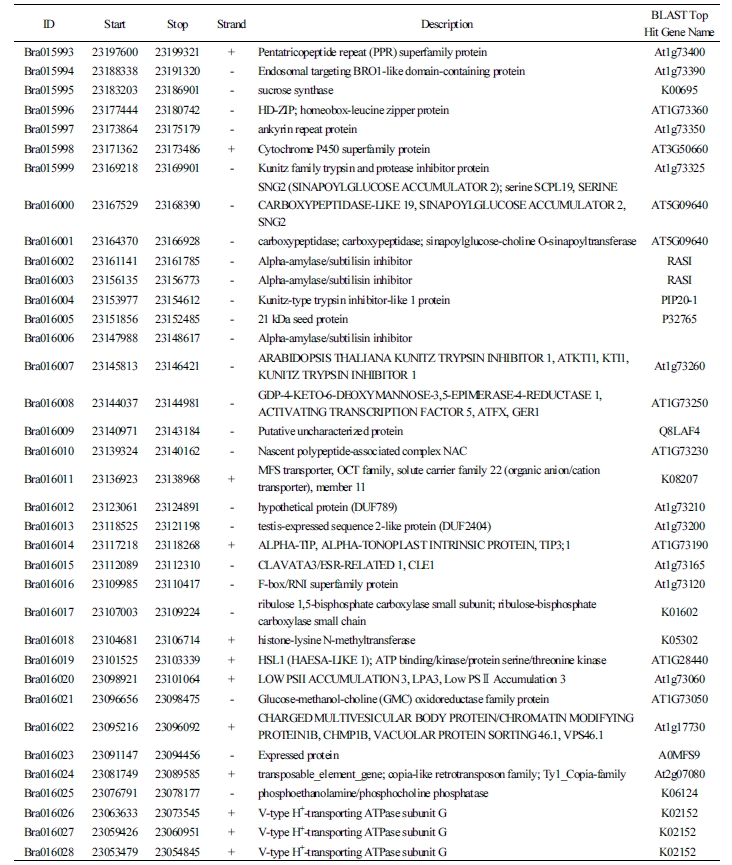
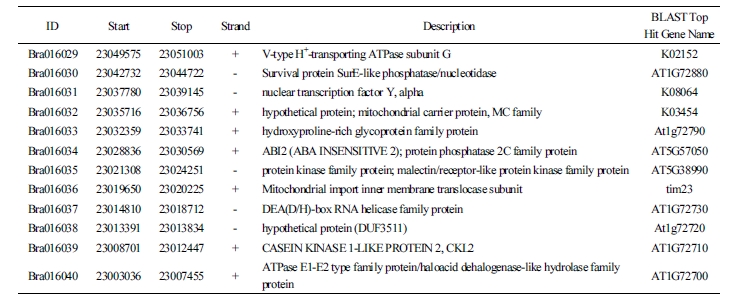
The test results of the novel marker Bra016021 developed in this study to select the resistance resources for Yeoncheon strain and the results of six previously reported markers (Crr1a, Crr2, CRb, CRa, Crr3, and CRc) were compared against the phenotype after the inoculation of clubroot disease (Table 1). For the match percentage between the phenotype and genotype in 82 resources (excluding the eleven that withered during inoculation of Yeoncheon strain), the novel marker Bra016021 showed the highest percentage (59.5%), followed by Crr3 (57.0%), Crr1a (53.2%), CRb (51.9%), CRc (49.4%), and Crr2 (41.8%), with CRa showing the lowest percentage (38.0%). In addition, the novel marker was shown to be evenly amplified in the four genetically unique groups, producing 100% match between the phenotype and genotype in populations 1 and 4. The two groups contain the resources exhibiting resistance or intermediate resistance to Yeoncheon strain causing clubroot disease that are likely to be highly useful in breeding. In population 2, the marker produced 100% match for discriminating the susceptibility resources, all of which were the progenies of Nordic turnips. However, in population 3, with varying patterns of resistance, most resistance or intermediate resistance resources showed agreement between the phenotype and genotype, while only two susceptibility resources, GW51 and GW73, showed agreement. When 47 genes found within 100 kb at either end of the novel marker were explored (Table 2), the gene at the position of Bra01602, based on which the CAPS marker was developed, was the one encoding glucose- methanol-choline (GMC) oxidoreductase family protein, with four V-type H+-transporting ATPase subunit Gs found at loci 21 kb apart.
Discussion
The CR genes thus far introduced into Kimchi cabbages originated from the turnip varieties Siloga, Milan White, Gelria, and Debra, and at least nine other resistance genes have been reported to be present in B. rapa. From Siloga, three CR genes, Crr1 (Kuginuki et al., 1997; Suwabe et al., 2003), Crr2 (Suwabe et al., 2003), and Crr4 (Suwabe et al., 2006), were introduced, and Crr3 (Hirai et al., 2004) was introduced from Milan White. CRb (Piao et al., 2004) and CRa (Matsumoto et al., 1998), were introduced from Gelria R and ECD02(136-8), respectively, and CRk and CRc were introduced from Debra (Sakamoto et al., 2008). Akiriso, the Japanese F1 cultivar exhibiting CR, led to the detection of the CRaki gene (Kato et al., 2012). Recently, a novel CR gene, Rcr2, was detected (Huang et al., 2017), and three CR QTLs associated with six phenotypes were detected using GBS analysis (Yu et al., 2017). The first CR gene to be reported was Crr1, located on A8. CRa is found on A3, followed by CRb, CRk, and Crr3, with Crr2 found on A1, CRc on A2, and Crr4 on A6. Upon transmission of the cabbage CR genes, Crr3, CRa, CRb, CRc, and CRk move as a single gene, while Crr1, Crr2, Crr4, and CRb (CRa) move as QTL. Further, while Crr3, CRa, CRb, CRc, and CRk are dominant genes, Crr1 and Crr2 are recessive genes.
The Bra016021 gene located on A7 that was selected as the CAPS marker in this study has been shown to encode a GMC oxidoreductase family protein in a study made with Fusarium oxysporum, a strain causing cabbage wilting. The pathogen Cong:1-1 originates from F. oxysporum, and a spontaneous nonpathogenic mutant, Cong:1-2, was also reported (Yoshida et al., 1998). When cabbages are infected by F. oxysporum, the physiological activities of the pathogen are regulated (Kawabe et al., 2011). Increasing the Cong:1-1 protein expression heightens the pathogenicity, whereas increasing the Cong:1-2 protein expression deactivates the strain to lower the pathogenicity. A defense mechanism was identified where the Cong:1-2 protein increases the expression of GMC oxidoreductase (ODX1). Further, the search for associated genes within 100 kb from the marker detected Bra016026, Bra016027, Bra016028, and Bra016029, the four V-type H+-transporting ATPase subunit Gs, at loci 21 kb apart. This was in agreement with the recent confirmation of eleven genes out of twelve that are expressed as V-type H+-transporting ATPase subunit Gs from three CR QTLs, Rcr4/A03, Rcr8/A02, and Rcr9/A08, in the Brassica database (Yu et al., 2017). Plant V-ATPases are found in the distal membrane of plant cells, where they are known to provide energy for transporting the ions and metabolites, to maintain solute homeostasis, and to facilitate vesicle fusion (Ratajczak, 2000). Thus, V-ATPases are the “housekeeping” genes that are known to influence plant growth and development by regulating the activities for cell survival under stress conditions such as salinity, drought, cold, acid stress, anoxia, and heavy metals (Dietz et al., 2001). Based on this, although still unclear, the reason for the four V-ATPases as associated genes in proximity of loci 21 kb from the marker may be attributed to the possibility that V-ATPases would regulate the transcription when clubroot disease is recognized as a stress condition.
The novel CAPS marker developed in this study for the selection of CR for the Yeoncheon strain can be used with common PCR as well as simple testing methods instead of high-cost devices. As it can select resistance resources even with simple testing devices and at a low cost, this novel molecular marker is likely to prove useful in Kimchi cabbage breeding for private companies. Furthermore, the GBS data analyzed in this study can be used for the development of molecular markers for selecting resistant resources for each strain causing clubroot disease.
