

Introduction
Materials and Methods
Plant Materials and Pre- or Postharvest Treatments
Evaluation of Cut Flower Quality
Antimicrobial Effect
Experimental Design and Data Analysis
Results and Discussion
Introduction
In Korea, around 22.5 ha of land was under hydrangea cultivation in 2021, worth 3,089,000 won (MAFRA, 2022). The consumption of cut hydrangea flowers has been increasing recently, but the study in various fields need to be improved (Lee et al., 2019). The flower wholesale market of Japan is the primary export market of cut hydrangea flowers from Korea. However, hydrangea flowers from Korea face several issues such as poor quality (27.1%), petal damage (23.7%), flower wilting (16.9%), petal abscission in the box (15.3%), and diseases (5.1%), which reduce their value in the Japanese wholesale market (Lee and Lee, 2018). To avoid such problems, it is important to manage the quality of cut flowers both before and after their harvest. Although both pre- and postharvest periods are major research fields, the research on postharvest management, also called the second production stage, is much less than that on preharvest management (Bang et al., 2019). Factors determining vase life is determined by phenotype, which appears by preharvest cultivation environment and variety, and postharvest factors (Fanourakis et al., 2013). Therefore, both kinds of research need to be more comprehensive. Before harvest, the quality of cut flowers is affected by several environmental factors in a greenhouse, including CO2. In a closed greenhouse, when plants absorb CO2 through photosynthesis after sunrise, the CO2 levels reduce to 150 mol·mol-1 in the greenhouse (Pan et al., 2019; KSFS, 2021; Jung et al., 2022; Lee et al., 2022). CO2 fertilization of 1,000–1,500 mol·mol-1 after sunrise increased the number of roses by 10–20%, and CO2 800 mol·mol-1 positively affects the flower spike length, the number of lateral branches, and flower buds, and day to the flowering of Phalaenopsis (Cho et al., 2020; RDA, 2020). The CO2 fertilization of 1000 mol·mol-1 prolonged vase life by 30 days and increased the sugar contents of the flower stalk on Phalaenopsis (Endo and Ikushima, 1997). The elevated CO2 fertilization increased the dry matter accumulation, water use efficiency and biomass of tomatoes (Yang et al., 2020).
Studies on postharvest management of Hydrangea macrophylla showed that the application of a vase solution of sodium metabisulfite (Na2S2O5) and pyrimethanil (C12H13N3) after being precooled at 0.5°C for 20 min did not extend the vase life (Schiappacasse et al., 2014). To determine the reasonable storage period and temperature for cut hydrangea flowers, Lee et al. (2019) stored the flowers at 5, 10, and 15°C for 5, 10, and 15 days, respectively. The storage at 10°C for five days was the highest extension of the vase life. The storage period was negatively correlated with the chlorophyll content of leaves. The treatment of vase solution with 150 mg·L-1 of carbacrol (an essential oil), and thymol with sucrose increased the vase life by 46% and the total solution uptake (Kilic et al., 2020). In addition, 250 mg·L-1 of 8-hydroxyquinoline sulfate (8-HQS) extended the vase life, and increased the vase solution uptake (Kazaz et al., 2019); however, 100–200 mg·L-1 of thymol with 1% sucrose solution extended the vase life than that achieved with 200 mg·L-1 of 8-HQS (Kazaz et al., 2020). Yang et al. (2021) suggested using fungicide in farm storage after harvest because treatment of 1% chrysal professional, RVB 0.1% and Floralife quick dip and Floralife Clear extended the vase life in farm storage, transport, and under preservative solution. Antimicrobial biocides such as sodium hypochlorite (NaOCl), sodium dichloroisocyanuric acid (DICA), 8-hydroxyquinoline citrate (8-HQC), 8-HQS, Physan 20TM, benzalkonium chloride (C17H30CIN), aluminum sulfate (Al2(SO4)3), silver nitrate (AgNO3), and silver thiosulfate (STS) extended the vase life by reducing bacteria in the vase solution for cut flowers (Macnish et al., 2008; Lee and Kim, 2019). However, it was toxic to flowers or caused environmental pollution at their disposal (Xie et al., 2008). As 8-HQS is harmful to humans, it has limited commercial use (Gebhart and Kappauf, 1980). NaOCl produces toxic substances such as trihalomethane (THM) and phenol chloride (Goo and Koo, 2020).
The electrolyzed water used in the production of eco-friendly horticultural crops was strongly (pH < 3.0), moderately (pH 2.7–5.0), and slightly (pH 5.0–6.5) acidic electrolyzed (Xiong et al., 2010). The slightly acidic electrolyzed water is obtained by dissolving dilute hydrochloric acid in water that generates chlorine at the cathode and hydrogen at the anode (Ahn, 2015). Slightly acidic electrolyzed water has an effective chlorine concentration of 20–30 µL·L-1 and pH 5.0–6.5 (Song et al., 2013). It induces injury by making porous holes in the cell membrane or the wall of bacteria. In addition, it is environmentally safe as it reduced to water over time (Yoon et al., 2021). Therefore, Korea and the United States designated both strongly and slightly acidic electrolyzed water as food disinfectants (Zacharia et al., 2011; Song et al., 2013; MFDS, 2022). Dipping treatment with 21–22 mg·L-1 (pH 5.6–5.8) was more effective in inhibiting the growth of Escherichia coli and Salmonella spp. in Chinese celery, lettuce, and salted young radish than the NaOCl treatment (Zacharia et al., 2011). Rinsing treatment with 20–28 mg·L-1 (pH 5.51) of slightly acidic electrolyzed water inhibited Yersinia enterocolitica from developing in cabbage (Yoon et al., 2021). However, the study of the slightly acidic electrolyzed water as a preservative solution for cut flowers has not been adequately investigated. This study investigates the effects of CO2 fertilization and vase solution treatment with slightly acidic electrolyzed water after harvest in extending the vase life and improving the quality of cut hydrangea flowers.
Materials and Methods
Plant Materials and Pre- or Postharvest Treatments
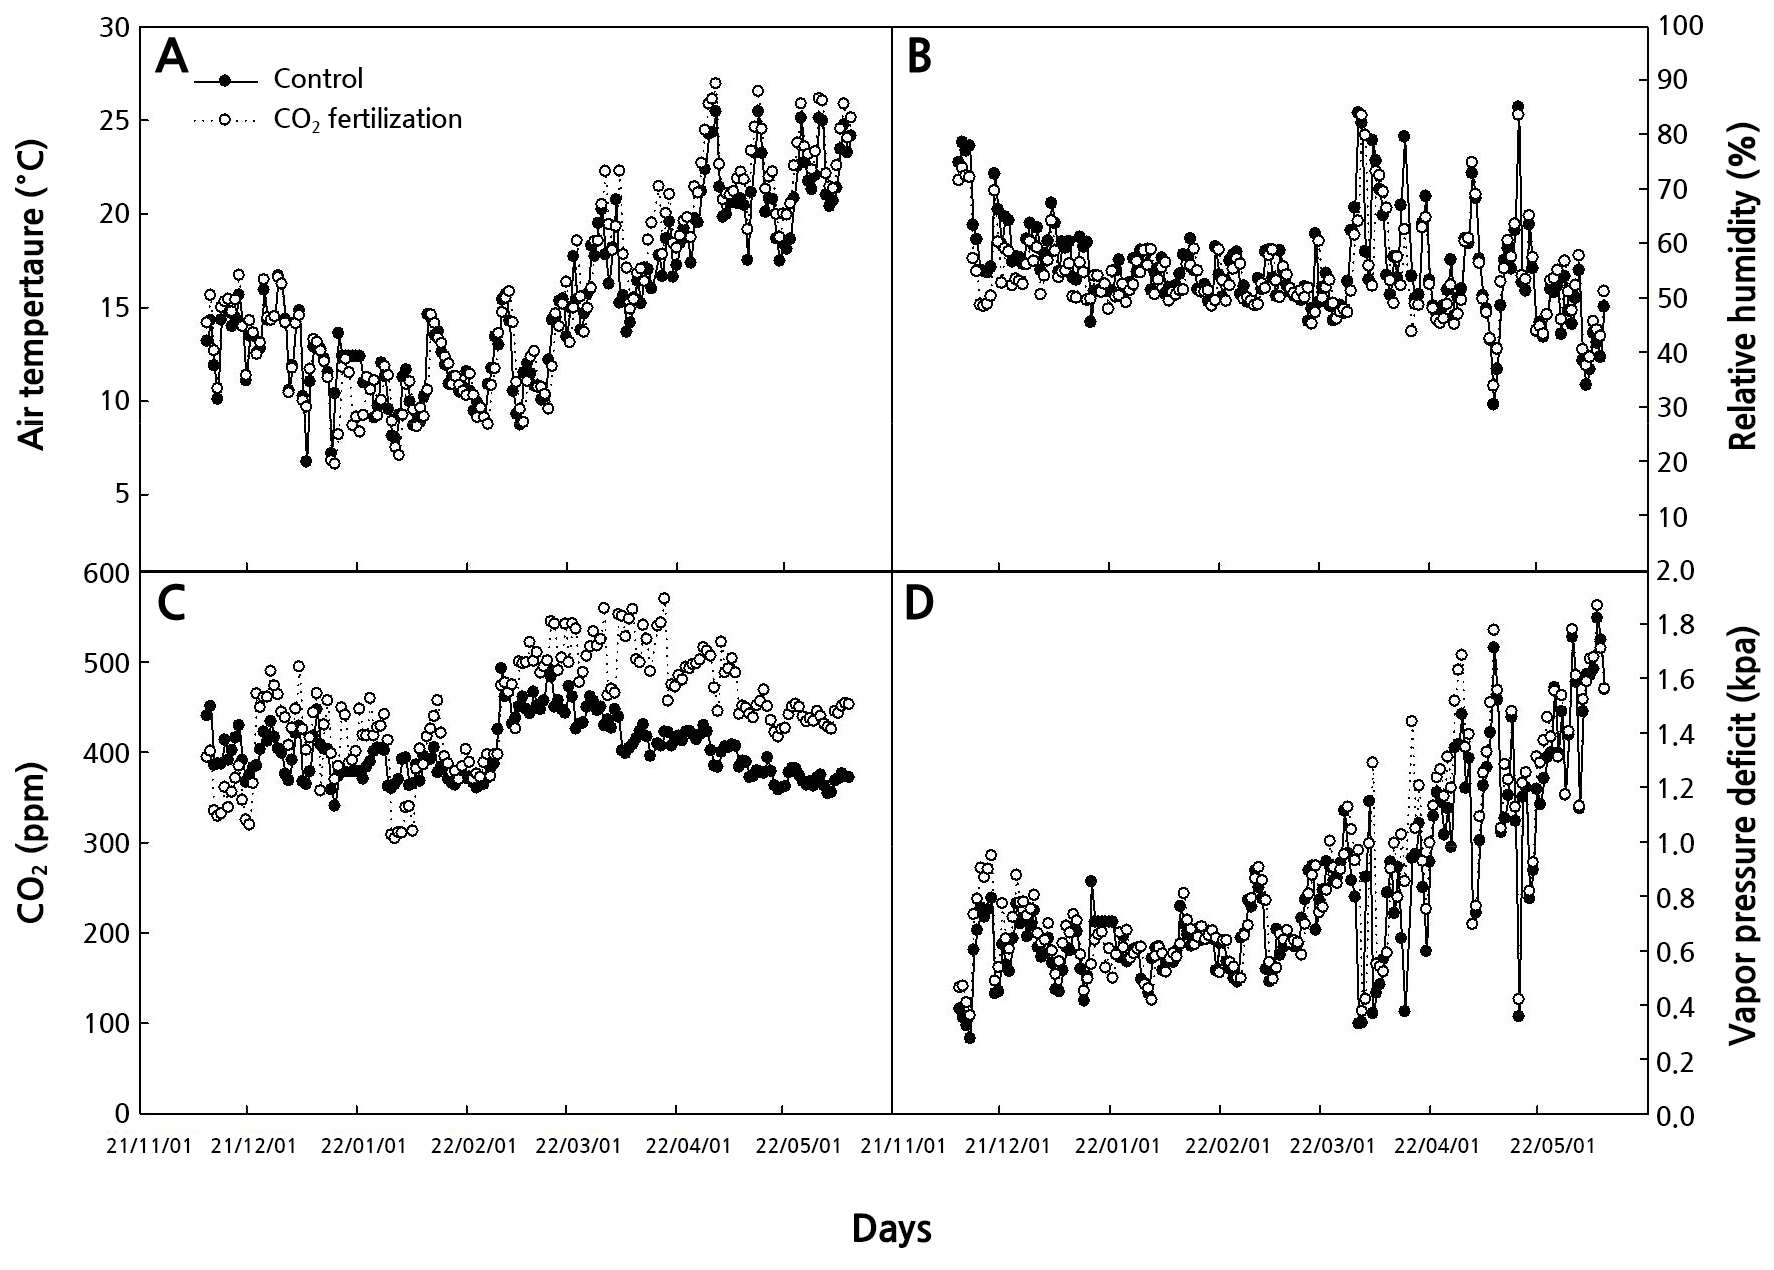
Hydrangea macrophylla ‘Moonstar’ was grown in a plastic greenhouse at Chonnam National University, Korea. The plants were grown in pots (48.5 × 30.6 cm, 25 L volume) filled with horticultural soil (Tobaek-i, Sunghwa Inc., Korea). Fertigation was conducted using a Multi-coat (Haifa, Korea) of 6 g per pot once and the pots were then irrigated overhead. The greenhouse's light, air temperature, and relative humidity were the natural environment, and the farming data logger (DAONi-con, Daonrs Inc., Korea) measured the greenhouse environment. The high air temperature manages using both top or side ventilators from April to May (Fig. 1). CO2 fertilization inside the greenhouse averaged 800 mol·mol-1 utilizing a carbon dioxide gas supply device from November 2021 to May 2022 (Daonia, Daonrs Inc., Korea) from vegetative reproduction in plant height averaged 15 cm to harvest after flower bud formation. The carbon dioxide measurement sensors (CM1107, Cubic, China), temperature and humidity measurement sensors (PT100 RTD, Deajin Sensor Electric Works, Korea) measured environment of the greenhouse. The flowers were harvested when they reached the commercial harvest stage, where about 80% of the florets showed the colors of the cultivar (Kazaz et al., 2020; Yang et al., 2021) and immediately placed in tap water at 4°C and stored for two days to simulate the distribution process involving farm storage (Lee et al., 2019). The stems were recut at 30 cm, and all but two leaves were removed. The slightly acidic electrolyzed water was used 30 µL·L-1 HOCl (pH 5.0–6.5, CNK Life Korea Inc., Korea) with tap water. The chlorine concentration was measured using HI96771 Ultra High Range Chlorine Portable Photometer (ISM, Hanna Instruments Inc., USA), and the pH was measured using a pH meter (Orion Star A211 pH Benchtop Meter, Thermo Scientific, USA). The vase solution treatment was conducted using 5 µL·L-1 HOCl, and the stems were randomly placed in a 1 L glass container containing 300 mL. The environment of the test room was air temperature of 24°C, relative humidity of 54%, and light intensity at 15.4 µmol·m-2·s-1 PPFD with a 12 - hour photoperiod.
Evaluation of Cut Flower Quality
The vase life was recorded as the duration (days) after simulating the process of distribution from farm storage until the flowers began to exhibit vase life termination symptoms, such as wilting flowers, bent neck by an angle greater than 45°, and decolored flowers (Yang et al., 2021). The relative fresh weight (RFW, %) and vase solution uptake (mL·d-1·g-1 FW) were measured every day and calculated every two days using Jowkar (2015) formula. The total vase solution uptake (g·mL-1) is the total amount of solution uptake by fresh weight per gram for six days after treatment, which is when the vase life termination symptoms appear (Kilic et al., 2020). The flower color was the L value (lightness: 100, darkness: 0), a value (red-green: + red, –green), and b value (yellow-blue: + yellow, –blue) using a color spectrometer (CR-400, Minolta, Japan). The △E, chroma C, and hue angle H values were calculated to compare the flower color while harvesting and during vase life termination (McGuire, 1992; Oh et al., 2015). The chlorophyll contents of the leaves were measured using a soil plant analysis development (SPAD) chlorophyll meter (SPAD-502Plus MINOLTA, Japan). The flower size was using the widest flowers after six days of treatment (Kim and Lee, 2022).
Antimicrobial Effect
To determine the total bacteria number of the end of stems, it was taken from each stem using the sterilized a 3M Pipette Swap (3M Korea Ltd., Korea) in three replications, mixed 101–102 fold serially diluted sterile distilled water (DW), and 1 mL sample cultured in a 3M Peterifilm plates (3M Korea Ltd., Korea ; Lee and Kim, 2019). It incubated at 30°C for 24 h to investigate the presence of bacteria in Petrifilm and mesured the number of colonies (Lee et al., 2019).
Experimental Design and Data Analysis
The cut flowers were placed in a completely randomized block design with nine replicates. Analysis of variance was used to analyze the data, and Duncan’s new multiple range tests (DMRT) and the Student's t-test at p = 0.05 were performed as post hoc analyses. Statistical analysis was conducted using the SAS software (Statistical Analysis System, version 9.4, SAS Institute Inc., Cary, NC).
Results and Discussion
The quality of cut hydrangea after harvest according to CO2 fertilization in the greenhouse was analyzed. CO2 fertilization decreased the fresh weight and flower size, and the leaves' chlorophyll contents were no different than that of the control (Table 1). Tomatoes subjected to CO2 fertilization using 800 mol·mol-1 of CO2 during cultivation had a greater leaf area and higher dry or fresh weight of the fruits compared to that achieved using 400 mol·mol-1 of ambient CO2 (Yang et al., 2020). The 1,000 mol·mol-1 CO2 fertilization was different on the fresh weight and the strawberries' diameter compared to that of the control (Choi et al., 2017). A previous study has shown that in Phalaenopsis, CO2 fertilization increased the fresh weight, the number of inflorescences, and the flower size, but the treatment effects differed based on the fertilization season (Endo and Ikushima, 1997). The flower size of Phalaenopsis was similar to that of its control under CO2 fertilization of 800 mol·mol-1, which suggests that the EC and N:K ratios were more influencing factors than CO2 fertilization (Cho et al., 2020). In contrast, when the high concentration of CO2 is fertilized, the leaves' stoma closes, reducing the transpiration and increasing the plant's temperature (KSFS, 2021). CO2 fertilization increased the net photosynthetic rate and relative growth rate of Chrysanthemum, Saintpaulia, Nephrolepis, Kalanchoe, and Begonia; however, inappropriate concentration for a long period causes negative ablation (Mortensen, 1984). Therefore, CO2 fertilization to improve the quality of cut hydrangea flowers will require an appropriate fertilization concentration and fertilization time and will need studies on various concentrations of CO2 fertilization. The flower color of CO2 fertilization of ‘Moonstar’, which petal color had pink, has a lower brightness L value, and b value (yellow-blue: + yellow, –blue) increased, and the color expression was relatively poor. There was no difference in the chroma value, which was clear, and the h value was high (Table 1; McGuire, 1992). These results are similar to those of a study, which reported no difference in the c value of strawberries regardless of the CO2 fertilization treatment (Choi et al., 2017).
Table 1.
Effect of CO2 fertilization in cultivation on the fresh weight, flower color, flower size, and chlorophyll contents of leaves on cut hydrangea ‘Moonstar’ flowers after harvest
| Treatment |
Fresh weight (g) | Flower color |
Flower size (cm) |
Chlorophyll contents | ||||
| L | a | b | cz | hy | ||||
| Control | 44.1 | 57.3 | 23.6 | –9.1 | 21.1 | 333.5 | 18.0 | 50.6 |
| CO2 fertilization | 34.4** | 48.9*** | 23.3 | –7.5* | 20.9 | 341.6*** | 16.0** | 49.6 |
The initial sterilization of the vase solution and the end of stems on cut hydrangea flowers is neccssary after harvest. Its effect differs from that achieved by using a fungicide to extend the vase life (Yang et al., 2021). The CO2 fertilization + HOCl treatment extended the longest of the vase life. The HOCl treatment extended the vase life regardless of the CO2 fertilization treatment (Table 2). The cut flowers of CO2 fertilization, which had lower fresh weight and smaller flower size after harvest than the control, had the effect of extending vase life by HOCl treatment (Tables 1 and 2). The vase life was influenced more by the HOCl treatment than by CO2 fertilization (Table 2). The largest total vase solution uptake was observed with the CO2 fertilization + HOCl treatment, which also resulted in the longest extension of the vase life. In the CO2 fertilization treatment, the HOCl treatment (2.2 × 10⁵ CFU·L-1) reduced bacteria on the end of stems by 54% compared to that achieved without HOCl treatment (1.0 × 10⁵ CFU·L-1; Fig. 2C and 2D). The oxidation and reduction potentials of slightly acidic electrolyzed water change the flow of electrons inside the cell, thereby changing the ATP production and metabolic flow, which acts on cell walls, lipids, and DNA, paralyzing the metabolic function of microorganisms in the stem (Song et al., 2013; Goo and Koo, 2020). The HOCl treatment inhibits bacteria and increases the water uptake (Table 2 and Fig. 2). The slightly acidic electrolyzed water causes extensive sterilization of plant pathogens such as Colletotrichum acutatum, Botrytis cinerea,Phytophthora capsici, and Penicillium hirsutum, has higher sterilization than that of NaOCl, and it has sterilization both bacteria and fungi (Yoon, 2006; Song et al., 2013). The CO2 fertilization + HOCl treatment was higher relatively fresh weight and vase solution uptake than those of the control after 6 days of treatment (Fig. 3). The CO2 fertilization + TW or HOCl treatments maintained the initial fresh weight for up to 6 days after treatment (Fig. 3A). The vase solution treatment using free available chlorine of 10–40 mg·L-1 extended the vase life of the rose and maintained the initial fresh weight for 10 days after the treatment (Lee and Kim, 2013).
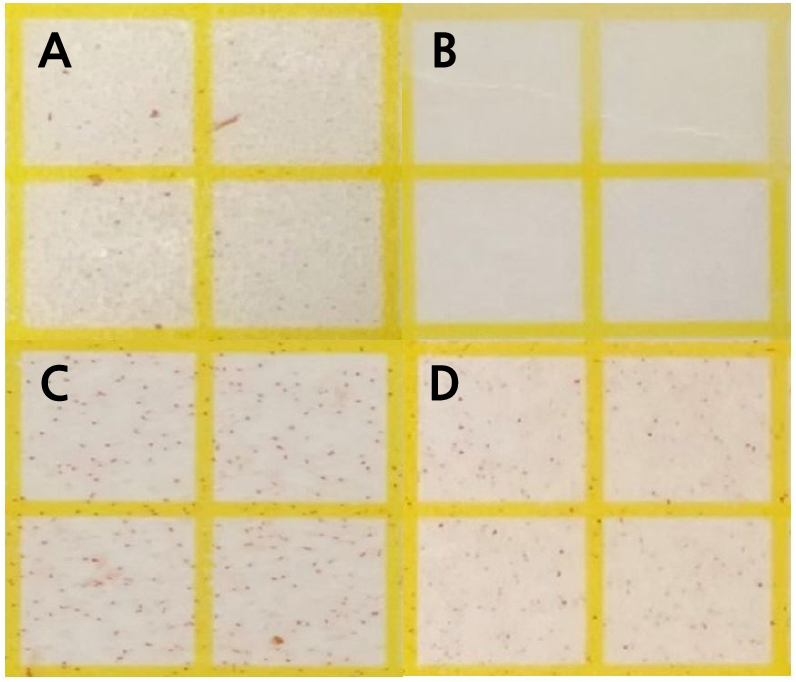
Fig. 2.
Bacteria reaction in the stem cut surface of CO2 fertilization or vase solution treatment of slightly acidic hypochlorous water (HOCl, pH 5.0 – 6.5) treated as A: tap water (TW), B: HOCl 5 µL·L-1, C: CO2 fertilization + tap water (TW), and D: CO2 fertilization + HOCl 5 µL·L-1 postharvest on cut hydrangea ‘Moonstar’ flowers on 5 days after treatment.
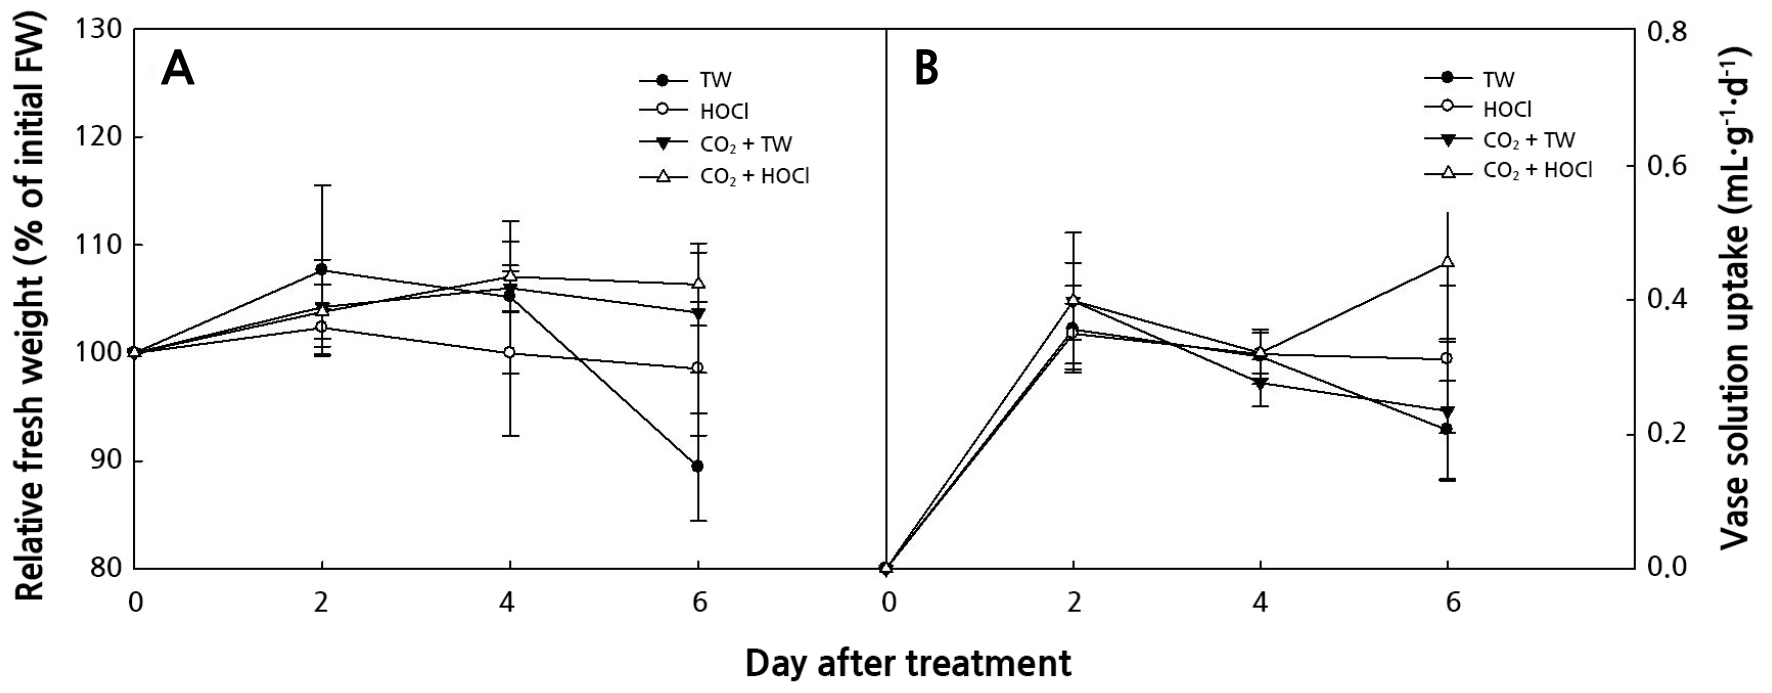
Fig. 3.
Effects of CO2 fertilization in cultivation or vase solution treatment of slightly acidic hypochlorous water (HOCl, pH 5.0 – 6.5) postharvest; tap water (TW), HOCl 5 µL·L-1, CO2 fertilization + tap water (TW), and CO2 fertilization + HOCl 5 µL·L-1. The relative fresh weight (A) and the vase solution uptake (B) of cut hydrangea ‘Moonstar’ flowers after harvest. The test room was maintained at 24°C of air temperature, relative humidity of 54%, and light intensity of 15.4 µmol·m-2·s -1 PAR in a 12 h photoperiod. Vertical bars indicate the standard error (n = 9).
Table 2.
Effect of CO2 fertilization on cultivation and slightly acidic hypochlorous water (HOCl, pH 5.0 – 6.5) postharvest on the vase life and total vase solution uptake on day 6 after treatment of cut hydrangea ‘Moonstar’
| Treatment | Vase life |
Total vase solution uptake (g·mL-1) | |
| CO2 fertilization | Vase solutiony | ||
| Control | Tap water | 7.2 cz | 0.89 b |
| HOCl | 7.9 b | 0.98 b | |
| CO2 fertilization | Tap water | 7.5 bc | 0.91 b |
| HOCl | 8.6 a | 1.18 a | |
| CO2 fertilization (A) | ** | * | |
| Vase solution (B) | *** | *** | |
| A × B | ns | ns | |
The symptoms of vase life termination in control did cause bent neck and wilting flowers before decolored flowers, while other treatments did not cause bent neck and cause the wilting and decoloration of flowers (Fig. 4). The b value is from yellow (+) to blue (–), and the h value (hue angle) is defined as the angle between the hypotenuse and 0° on the a value (bluish-green/red-purple) axis; h is calculated from the arctangent of the b/a value (McGuire, 1992). The b and h values of petals were higher for CO2 fertilization treatments regardless of HOCl treatment (Table 3). The b and h values of the petals increased after CO2 fertilization treatments, regardless of the HOCl treatment. Cho et al. (2020) showed that the petal color of Phalaenopsis was not affected by CO2 fertilization and the EC level (Cho et al., 2020). A smaller △E value means that the flower color is not much different from that observed immediately after harvest (Oh et al., 2015). △E value, chlorophyll contents of leaves, and flower size did not differ in all treatments (Table 3). Cho et al. (2020) showed that the flower size of Phalaenopsis was similar to that of the control under CO2 800 mol·mol-1 fertilization, and the EC and N:K ratios were more vital influencers than CO2 fertilization.
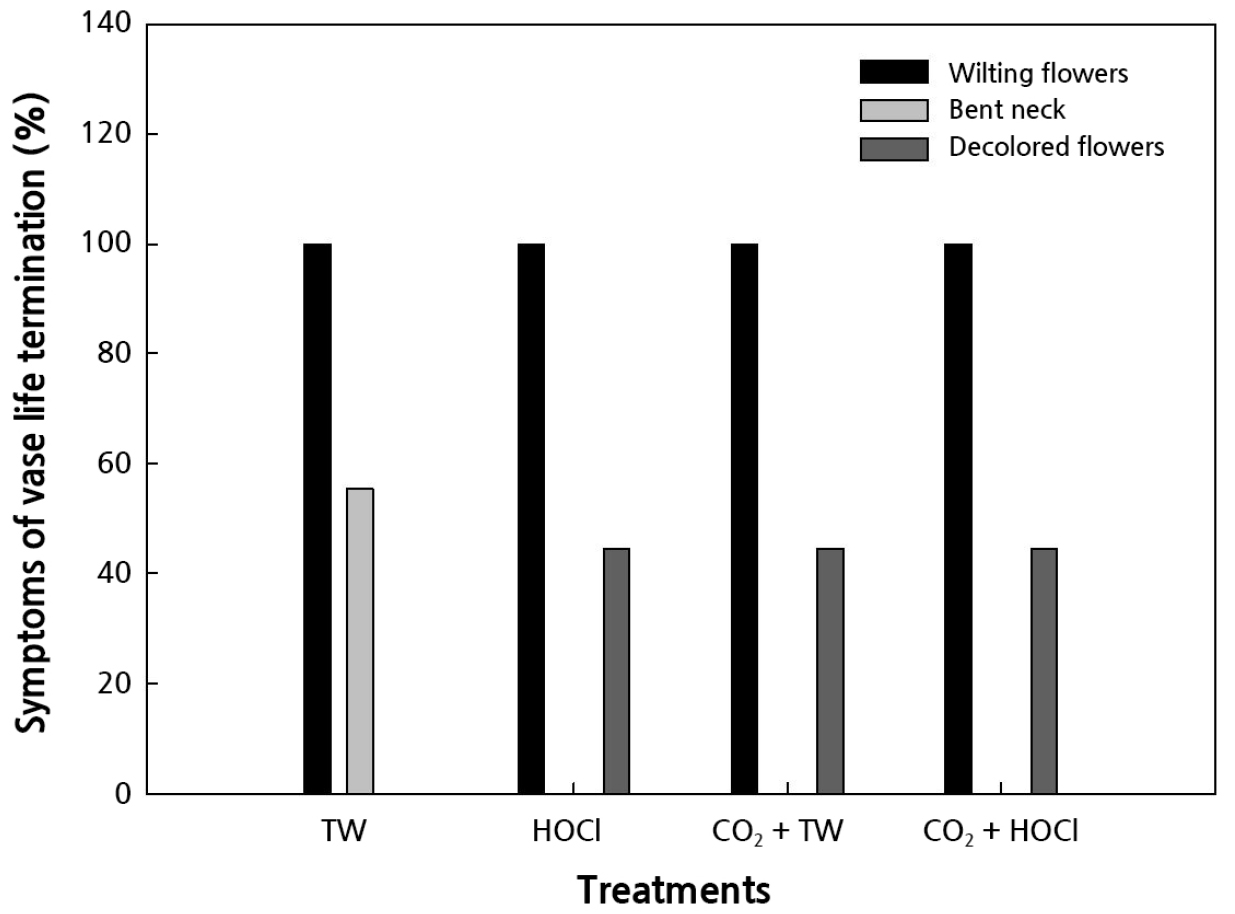
Fig. 4.
Percentage of vase life termination symptoms of cut hydrangea ‘Moonstar’ treated as CO2 fertilization in cultivation or vase solution treatment of slightly acidic hypochlorous water (HOCl, pH 5.0 – 6.5) postharvest; tap water (TW), HOCl 5 µL·L-1, CO2 fertilization + tap water (TW), and CO2 fertilization + HOCl 5 µL·L-1.
Table 3.
Effect of CO2 fertilization in cultivation and slightly acidic hypochlorous water (HOCl, pH 5.0 – 6.5) in postharvest on the flower color, chlorophyll contents of leaf, and flower size on day 6 after treatment of cut hydrangea ‘Moonstar’
| Treatment | Petal color | △Ev |
Chlorophyll contents |
Flower size (%) | |||||
| L | a | b | cx | hw | |||||
| Control | Tap water | 57.67 az | 20.31 a | –9.43 bc | 22.43 a | 334.74 b | 9.14 a | 47.74 a | 105.51 a |
| HOCly | 61.12 a | 17.44 a | –9.03 bc | 19.69 a | 332.32 b | 9.27 a | 49.48 a | 100.14 a | |
| CO2 fertilization | Tap water | 56.03 a | 18.55 a | –6.50 a | 19.70 a | 341.55 a | 10.86 a | 45.32 a | 101.42 a |
| HOCl | 58.42 a | 19.26 a | –7.50 ab | 20.69 a | 338.93 a | 12.42 a | 46.32 a | 102.53 a | |
| CO2 fertilization (A) | ns | ns | *** | ns | *** | ns | ns | ns | |
| Vase solution (B) | ns | ns | ns | ns | ns | ns | ns | ns | |
| A × B | ns | ns | ns | ns | ns | ns | ns | ns | |
The test room was maintained at 24°C of air temperature, relative humidity of 54%, and light intensity of 15.4 µmol·m-2·s-1 PAR in a 12 h photoperiod.
zDifferent letters within columns indicate significant mean separation by Duncan's new multiple range test at p < 0.05 (n = 9).
In conclusion, CO2 fertilization and HOCl treatment after harvest improved the quality of cut hydrangea flowers. The end of stems treated with HOCl treatment extended the vase life by suppressing the growth of bacteria and increasing the water uptake. Therefore, the initial sterilization of the end of stems after harvest is an essential factor for improving the quality of cut hydrangea flowers. The vase solution treatment of HOCl 5 µL·L-1 after harvest extended the vase life of cut hydrangea flowers.
